Categories
Crypto News Market Analysis Trading

Top 3 Coins To Watch Today: CAKE, ANKR, AKRO – November 1 Trading Analysis

Let’s take a closer look at today’s altcoins showing breakout signals. We’ll explain what the coin is, then dive into the trading charts and provide some analysis to help you decide.

1. PancakeSwap (CAKE)

PancakeSwap CAKE is an automated market maker (AMM) – a decentralised finance (DeFi) application that allows users to exchange tokens, providing liquidity via farming and earning fees in return. PancakeSwap uses an automated market maker model where users trade against a liquidity pool. These pools are filled by users who deposit their funds into the pool and receive liquidity provider (LP) tokens in return. PancakeSwap allows users to trade BEP20 tokens, provide liquidity to the exchange and earn fees, stake LP tokens to earn CAKE, stake CAKE to earn more CAKE, and stake CAKE to earn tokens of other projects.

CAKE Price Analysis

At the time of writing, CAKE is ranked the 45th cryptocurrency globally and the current price is A$23.06. Let’s take a look at the chart below for price analysis:

Source: TradingView

CAKE‘s 71% decline during May created relatively equal lows near A$23.56 before bouncing over the local range’s midpoint near A$34.60. A bullish altcoin market could help CAKE bulls regain a stronger bullish trend.

Aggressive bulls could look for entries in the daily gap starting near A$20.77. The monthly open aligns with more probable support near A$19.84. 

A stop run below the monthly open near A$18.62 might provide a more favourable entry. A more substantial bearish move – perhaps from a sharp drop in Bitcoin’s price – could challenge support near A$16.30, just above the equal lows.

Resistance rests just above, with the zone from A$27.59 to A$31.26 likely to provide a short-term ceiling. A break through this level might target resistance just under the cluster of relatively equal highs near A$33.47. 

Beyond these highs, resistance near A$38.15 provides a final challenge before attacking an old daily swing high near A$40.86.

2. Ankr (ANKR)

ANKR originates as a solution that utilises shared resources in order to provide easy and affordable blockchain node hosting solutions. Founded in November 2017, it has since built a marketplace for container-based cloud services through the usage of shared resources. It is a platform that enables the sharing economy, where any customer can access resources at a more affordable rate, while also providing enterprises with the ability to monetise their spare computing power that is not being utilised. It is unique in the way that it is the first to use trusted hardware, and this ensures a high level of security.

ANKR Price Analysis

At the time of writing, ANKR is ranked the 104th cryptocurrency globally and the current price is A$0.1706. Let’s take a look at the chart below for price analysis:

Source: TradingView

ANKR continues to set new monthly highs in its chaotic upwards trend.

Support might be found in the daily gap above the October monthly open near A$0.1395. A deeper retracement is likely to target the relatively equal lows into support near A$0.1254. 

The daily gap near A$0.1586 could also provide support. However, another gap inside the down candles, around A$0.1424, provides the highest chances of solid support while offering a high risk-reward entry.

There is currently no resistance overhead since the price is in discovery. Extensions hint at the areas around A$0.2166 and A$0.2463 as reasonable take-profit zones.

3. Akropolis (AKRO)

Akropolis AKRO is a company that operates an Ethereum-based decentralised finance protocol that seeks to provide an autonomous financial ecosystem for saving and growing wealth, including through borrowing and lending. To do so, it offers a series of products including AkropolisOS, a framework for developing for-profit decentralised autonomous organisations; Sparta, a platform for uncollateralised lending; and Delphi, a yield farming aggregator and tool for dollar-cost averaging. The project uses an ERC-20 token, AKRO, for protocol governance across its suite of products.

AKRO Price Analysis

At the time of writing, AKRO is ranked the 387th cryptocurrency globally and the current price is A$0.04938. Let’s take a look at the chart below for price analysis:

Source: TradingView

AKRO holders endured a wild October as the price rallied over 85% before running the month’s lows. This stop run could set the stage for another rally. However, the recent volatility means bulls should be extra cautious with stop placement. 

Bulls might find support around the current price near A$0.04355. The next high probability support rests near A$0.03912, below the last two swing lows. A move this deep could sweep monthly lows into an area near A$0.03577.

The price is currently struggling with resistance near A$0.05134 at the previous monthly open. A strong move into this resistance is likely to target the swing high near A$0.05421. 

Above this swing high, a monthly high at A$0.05986 is the next likely target, which also marks another wide resistance zone. Volatility inside this resistance could tag a new monthly high at A$0.06532.

Where to Buy or Trade Altcoins?

These coins have high liquidity on Binance Exchange, so that could help with trading on AUD/USDT/BTC pairs. And if you’re looking at buying and HODLing cryptos, then Swyftx Exchange is an easy-to-use popular choice in Australia.

Categories
Crypto News Market Analysis Trading

MANA Surges +80% in a Single Day amid HashKey to Open First Virtual Headquarter in Decentraland

MANA is trading in an uptrend, like many other Altcoins. The cryptocurrency MANA just went up +80% in a single day by breaking a bullish pennant pattern with strong buying volume on multiple exchanges and surges over +135% in a week.

What is Decentraland?

Decentraland MANA defines itself as a virtual reality platform powered by the Ethereum blockchain that allows users to create, experience, and monetize content and applications. Decentraland uses two tokens: MANA and LAND. MANA is an ERC-20 token that must be burned to acquire non-fungible ERC-721 LAND tokens. MANA tokens can also be used to pay for a range of avatars, wearables, names, and more on the Decentraland marketplace.

MANA Price Analysis

At the time of writing, MANA is ranked the 60th cryptocurrency globally and the current price is A$1.72. Let’s take a look at the chart below for price analysis:

Source: TradingView

After looking at the above 1-Day candle chart, we can clearly see that MANA was trading inside the bullish pennant pattern on the MANA/USDT pair. The first resistance was on the A$1.23 price level, which MANA broke with a strong bullish trend buying volume and is now heading towards the recent high price at A$1.98. Seeing that many Altcoins are holding a strong position this week after the recent bitcoin price breakout, MANA may continue to increase in the uptrend if traders keep buying with high volume.

“A bullish pennant is a technical trading pattern that indicates the impending continuation of a strong upward price move. They’re formed when a market makes an extensive move higher, then pauses and consolidates between converging support and resistance lines.”

What Do the Technical Indicators Say?

The MANA TradingView indicators (on the 1-day) mainly indicate MANA as a Strong Buy, except the Oscillators which indicate MANA as a Buy.

So Why Did MANA Breakout?

General market sentiment seems to suggest cryptos are hopefully turning back bull run season after recent price corrections. Another reason for this sudden pump in price could be whales secretly buying MANA for the coming Altcoins rally. Recent news was also announced regarding HashKey Virtual Headquarter Launch.

Where to Buy or Trade MANA?

MANA has the highest liquidity on Binance Exchange so that would help for trading MANA/BTC or MANA/USDT pairs. And if you’re looking at buying and HODLing cryptos, then Swyftx Exchange is an easy-to-use popular choice in Australia.

Categories
Crypto News Litecoin Market Analysis Trading

Top 3 Coins To Watch Today: LTC, 1INCH, SAND – October 29 Trading Analysis

Let’s take a closer look at today’s altcoins showing breakout signals. We’ll explain what the coin is, then dive into the trading charts and provide some analysis to help you decide.

1. Litecoin (LTC)

Litecoin LTC is a cryptocurrency designed to provide fast, secure, and low-cost payments by leveraging the unique properties of blockchain technology. The cryptocurrency was created based on the Bitcoin protocol, but it differs in terms of the hashing algorithm used, hard cap, block transaction times, and a few other factors. Litecoin has a block time of just 2.5 minutes and extremely low transaction fees, making it suitable for micro-transactions and point-of-sale payments.

LTC Price Analysis

At the time of writing, LTC is ranked the 19th cryptocurrency globally and the current price is A$250.46. Let’s take a look at the chart below for price analysis:

Source: TradingView

After setting a low in late July, LTC kicked off a bullish trend that rallied nearly 115% by September to break March’s cycle high.

The following 50% plummet found support near A$225.36, sweeping under the 40 EMA into the 61.8% retracement level before bouncing to resistance beginning at A$220.43.

This area could continue to provide resistance, possibly causing a retracement to the 9 EMA and 18 EMA near A$259.12, where aggressive bulls might begin bidding. The level near A$266.98, which has confluence with the 40 EMA, may see more interest from bulls loading up for an attempt on probable resistance beginning near A$274.05. 

However, if Bitcoin continues its downtrend, much lower prices could be seen. The old support near A$215.18 could provide at least a short-term bounce. If this level fails, the old highs near A$208.44 might also give support and see the start of a new bullish cycle.

2. 1inch (1INCH)

1INCH is a decentralised exchange (DEX) aggregator, connecting several DEXes into one platform to allow its users to find the most efficient swapping routes across all platforms. In order for users to find the best price for a swap, they need to look at every exchange – DEX aggregators eliminate the need for manually checking, bringing efficiency to swapping on DEXes. 1inch has launched its 1INCH governance token, and the 1inch Network began to be governed by a decentralised autonomous organisation (DAO).

1INCH Price Analysis

At the time of writing, 1INCH is ranked the 117th cryptocurrency globally and the current price is A$7.01. Let’s take a look at the chart below for price analysis:

Source: TradingView

After breaking its May highs, 1INCH began a range that has been whiplashing both bulls and bears.

Resistance beginning near A$7.54 has held the price down for the second half of September, although bulls have shown some strength near the 9 and 18 EMAs. 

A quick drop to A$7.43, or into the zone beginning near A$7.40, could give bulls the fuel to push through the nearby resistance. If this resistance breaks, the high near A$7.62 provides a reasonable target. 

A break of this level could move further into uncharted territory with the nearest probable resistances projected around A$7.68 and A$7.79.

More patient bulls might be waiting far below the 40 EMA with bids near the higher-timeframe range’s 61.8% retracement, near A$6.78.

3. The Sandbox (SAND)

The Sandbox SAND is a blockchain-based virtual world allowing users to create, build, buy and sell digital assets in the form of a game. By combining the powers of decentralised autonomous organisations (DAOs) and non-fungible tokens (NFTs), the Sandbox creates a decentralised platform for a thriving gaming community. The Sandbox employs the powers of blockchain technology by introducing the SAND utility token, which facilitates transactions on the platform.

SAND Price Analysis

At the time of writing, SAND is ranked the 130th cryptocurrency globally and the current price is A$1.19. Let’s take a look at the chart below for price analysis:

Source: TradingView

Since August’s high, SAND‘s 57% drop marks the current range as a reasonable area to expect accumulation.

The recent bearish flip of the 9, 18 and 40 EMAs might cause bulls to be less aggressive in bidding. However, possible support near A$1.10 and A$1.05 – between the 61.8% and 78.6% retracements – could see at least a short-term bounce. 

Long-term consolidation suggests that the areas near A$1.25 and A$1.37 may be more likely to cause a longer-term trend reversal.

Bears are likely to add to their shorts at probable resistance beginning near A$1.14, which has confluence with the 18 EMA. A fast break of this resistance could trigger more selling near A$1.21, the start of the bearish move.

If an aggressive bullish move does appear, trapped buyers in the probable resistance beginning near A$1.29 might provide a ceiling for this impulse.

Where to Buy or Trade Altcoins?

These coins have high liquidity on Binance Exchange, so that could help with trading on AUD/USDT/BTC pairs. And if you’re looking at buying and HODLing cryptos, then Swyftx Exchange is an easy-to-use popular choice in Australia.

Categories
Crypto News Market Analysis Trading

Top 3 Coins To Watch Today: ATOM, CRV, HBAR – October 28 Trading Analysis

Let’s take a closer look at today’s altcoins showing breakout signals. We’ll explain what the coin is, then dive into the trading charts and provide some analysis to help you decide.

1. Cosmos (ATOM)

Cosmos ATOM bills itself as a project that solves some of the “hardest problems” facing the blockchain industry. It aims to offer an antidote to “slow, expensive, unscalable and environmentally harmful” proof-of-work protocols, like those used by Bitcoin, by offering an ecosystem of connected blockchains. ATOM tokens are earned through a hybrid proof-of-stake algorithm, and they help to keep the Cosmos Hub, the project’s flagship blockchain, secure. This cryptocurrency also has a role in the network’s governance.

ATOM Price Analysis

At the time of writing, ATOM is ranked the 22nd cryptocurrency globally and the current price is A$49.80. Let’s take a look at the chart below for price analysis:

Source: TradingView

September provided respectable 128% gains for bulls who bought ATOM at the monthly open, with the price finding resistance near A$62.34.

If bulls take back control this week, the top of the former gap beginning at A$47.05 may provide support for at least a short-term bounce. The top of the consolidation range starting near A$45.22 is more likely to provide substantial support.

The most robust support is likely to be found in the overlapping consolidation ranges between A$43.75 and A$41.88, with a sharp slice through these levels possibly suggesting the end of the bull run.

The region from approximately A$55.61 to the most recent swing high is likely to provide some resistance. The swing high provides a reasonable first target for a possible next leg up. 

If this high breaks, the 1.0 extension near A$58.12 and the 2.0 extension near A$65.34 may provide the next primary targets.

2. Curve DAO Token (CRV)

Curve CRV is a decentralised exchange for stablecoins that uses an automated market maker (AMM) to manage liquidity. Curve has gained considerable attention by following its remit as an AMM specifically for stablecoin trading. The launch of the DAO and CRV token brought in further profitability, given CRV’s use for governance, as it is awarded to users based on liquidity commitment and length of ownership. The explosion in DeFi trading has ensured Curve’s longevity, with AMMs turning over huge amounts of liquidity and associated user profits.

CRV Price Analysis

At the time of writing, CRV is ranked the 70th cryptocurrency globally and the current price is A$5.69. Let’s take a look at the chart below for price analysis:

Source: TradingView

This month, bulls enjoyed 118% gains at CRV‘s peak before the price confirmed stiff resistance beginning at A$6.40.

The 1-Day chart shows that support may be forming between A$5.34 and A$5.22, near the monthly open. Aggressive bulls could enter in this area, although safer entries may be found much further below near A$5.10 and A$4.93 after a sweep of the current consolidation’s swing lows.

The last swing high near A$5.85 provides a likely first target if the price does bounce from this region. Beyond this swing high, the 1.0 extension near A$5.99 and the 2.0 extension near A$6.32 may provide the next major targets.

3. Hedera Hashgraph (HBAR)

Hedera Hashgraph HBAR is a public network that allows individuals and businesses to create powerful decentralised applications (DApps). It is designed to be a fairer, more efficient system that eliminates some of the limitations that older blockchain-based platforms face, such as slow performance and instability. The HBAR token has a dual role within the Hedera public network.

HBAR Price Analysis

At the time of writing, HBAR is ranked the 36th cryptocurrency globally and the current price is A$0.4836. Let’s take a look at the chart below for price analysis:

Source: TradingView

HBAR‘s 109% September run retraced almost to its origin, narrowly missing probable support near A$0.4122 before bears swatted down the bounce near resistance around A$0.5536.

With the daily gap between A$0.4678 and A$0.4514 almost filled in a single wick, the price may not need to revisit areas below this level. However, the safer entry is still in probable support between A$0.4155 and A$0.3826, which would also sweep the lows of last week’s bounce.

The relatively equal highs near A$0.5422 provide a likely first target on lower timeframes. However, the resistance beginning at A$0.6035 may initially suppress a further move up.

A clean break through this resistance will need to contend with the next resistance near A$0.6392, under the last swing high. This swing high at A$0.6570 gives a reasonable take-profit area before a possible move to the 1.0 extension near A$0.7044.

Where to Buy or Trade Altcoins?

These coins have high liquidity on Binance Exchange, so that could help with trading on AUD/USDT/BTC pairs. And if you’re looking at buying and HODLing cryptos, then Swyftx Exchange is an easy-to-use popular choice in Australia.

Categories
Crypto News Market Analysis Trading

Top 3 Coins To Watch Today: FTM, COCOS, LINA – October 27 Trading Analysis

Let’s take a closer look at today’s altcoins showing breakout signals. We’ll explain what the coin is, then dive into the trading charts and provide some analysis to help you decide.

1. Fantom (FTM)

Fantom FTM is a directed acyclic graph (DAG) smart contract platform providing decentralised finance (DeFi) services to developers using its own bespoke consensus algorithm. Together with its in-house token FTM, Fantom aims to solve problems associated with smart-contract platforms, specifically transaction speed, which developers say they have reduced to under two seconds.

FTM Price Analysis

At the time of writing, FTM is ranked the 26th cryptocurrency globally and the current price is A$4.36. Let’s take a look at the chart below for price analysis:

Source: TradingView

During mid-October, FTM broke several swing highs that could be the signal for a new bullish trend.

Last week’s break of the most recent swing low could suggest some downside in the short term. It formed probable resistance near A$4.30 and may target the swing low and possible support near A$4.23.

The swing low and possible support near A$4.12 could be the second bearish target if the move down continues. The relatively equal lows near A$4.00 and possible support underneath near A$3.89 could provide more substantial support.

The last swing high near A$4.50 gives a near-term target if bullish continuation continues. However, resistance beginning around A$4.45 could cap this move. A break of this resistance might continue to probable resistance near A$4.58 and reach above the cluster of relatively equal new highs near A$4.77 and A$4.95.

2. Cocos-BCX (COCOS)

Cocos-BCX COCOS is a public blockchain platform aiming to create a complete run-time environment for games with multi-game system compatibility, providing game developers with a user-friendly platform for blockchain game development.

COCOS Price Analysis

At the time of writing, COCOS is ranked the 716th cryptocurrency globally and the current price is A$0.9379. Let’s take a look at the chart below for price analysis:

Source: TradingView

Mid-July marked a turning point for COCOS, with the price rocketing up almost 125% from its lows to probable resistance beginning near A$1.13.

The price is currently struggling with the area between A$1.05 and A$0.7245. This region could provide support after a close above, or resistance after a close below. 

A retracement could reach into the daily gap and possible support around A$0.8532. A more bearish shift in the marketplace will likely aim for the relatively equal lows near A$0.8076, and the potential support just below that begins around A$0.7714.

Continuation to the upside will likely target the monthly high near A$1.10. However, probable resistance beginning at A$1.16 and A$1.24 could cap or slow down this move.

3. Linear (LINA)

Linear LINA is a decentralised delta-one asset protocol capable of instantly creating synthetic assets with unlimited liquidity. The project opens traditional assets like commodities, forex, market indices and other thematic sectors to cryptocurrency users by supporting the creation of “Liquids”, Linear’s synthetic asset tokens. LINA is an ERC-20 token built on the Ethereum network whose main purpose is as collateral for Liquids (using Buildr), and for community governance of the protocol.

LINA Price Analysis

At the time of writing, LINA is ranked the 279th cryptocurrency globally and the current price is A$0.07247. Let’s take a look at the chart below for price analysis:

Source: TradingView

During August, LINA also turned the corner, breaking a key swing high early to mid-month. This move could suggest a longer-term bullish trend.

The swing high near A$0.09436 stands out as a bullish target and marks an area of probable resistance. Further continuation could reach into possible resistance starting near A$0.1057.

Even if the bullish trend continues, a stop run at the recent swing low near A$0.07534 into possible support beginning near A$0.07185 is reasonable. If the price reaches further down, the swing low and possible support near A$0.06812 might provide another downside target. 

The area near A$0.06722 could also provide support. However, a drop this far could suggest a stop run below the higher-timeframe relatively equal lows near A$0.06493 into possible support beginning around A$0.06349.

Where to Buy or Trade Altcoins?

These coins have high liquidity on Binance Exchange, so that could help with trading on AUD/USDT/BTC pairs. And if you’re looking at buying and HODLing cryptos, then Swyftx Exchange is an easy-to-use popular choice in Australia.

Categories
Crypto News Dogecoin NFTs Tokens Trading

Shiba Inu Coin Surges 500% Amid Shiboshi’s NFTs Launch and Exchange Listings

Shiba Inu (SHIB), the token that ate dogecoin, hit an all-time high on October 24 with a month-to-date gain of almost 500 percent. SHIB traded at US$0.0000455, topping its previous best of $0.0000388 on May 10, and at time of writing was trading at $0.0000394.

SHIB Also Subject to Listing Frenzy

Prices for the meme token had surged by nearly 50 percent in the previous 24 hours and its latest high-water mark comes amid rumours that online brokerage platform Robinhood may soon list the cryptocurrency. Brazilian exchange Novadax listed SHIB just a few days ago, and popular trading app Public followed suit soon after.

Prices bumped over 200 percent in early October on the back of increased buying by whales and other large investors. While SHIB has gone ballistic this month, DOGE has gained just 27 percent and still trades well below its August high of US$0.35. Like SHIB, DOGE had hit a peak of just over $0.73 in early May.

Shiboshi NFTs Sell Out in Just Over Half an Hour

Adding to this month’s SHIB fever, the Shiboshi NFTs released on October 14 sold out in just over 35 minutes, fetching between US$350 and US$1050 apiece. And SHIB holders perhaps owed Tesla CEO Elon Musk a vote of thanks for posting an image of his new Shiba Inu puppy, Floki, which was at least partly responsible for the meme coin’s price surge.

The irony is that Musk, originally a champion of Dogecoin, confirmed on Twitter that he does not own any SHIB:

While some in the SHIB community hit out at Musk for damaging the price of SHIB (it dropped 20 percent after Musk’s tweet), some noted that Shiba Inu could survive handsomely without the influence of celebrities and should instead focus on the community.

$1,000 Invested in Shiba Inu on January 1, 2021, Is Now Worth $500 Million

SHIB’s market capitalisation now exceeds US$15 billion, placing it well within the top 15 coins. SHIB/USDT is also the most traded pair on Binance over the past 24 hours, surpassing US$2 billion in traded volume.

SHIB traded at a mere $0.000000000077 on January 1, 2021. This means that the meme coin is up by a colossal 50,649,250 percent year-to-date. As such, a hypothetical investment of US$1,000 made on January 1 would be worth over US$500 million today.

Categories
Crypto News Ethereum Market Analysis Trading

Top 3 Coins To Watch Today: ETH, CSPR, NWC – October 26 Trading Analysis

Let’s take a closer look at today’s altcoins showing breakout signals. We’ll explain what the coin is, then dive into the trading charts and provide some analysis to help you decide.

1. Ethereum (ETH)

Ethereum ETH is a decentralised open-source blockchain system that features its own cryptocurrency, Ether. ETH works as a platform for numerous other cryptocurrencies, as well as for the execution of decentralised smart contracts. Ethereum’s own purported goal is to become a global platform for decentralised applications, allowing users from all over the world to write and run software that is resistant to censorship, downtime, and fraud.

ETH Price Analysis

At the time of writing, ETH is ranked the 2nd cryptocurrency globally and the current price is A$5,624.16. Let’s take a look at the chart below for price analysis:

Source: TradingView

ETH‘s long-term range from May’s high to May’s low could be coming to an end.

The 9, 18 and 40 EMAs flipped bullish at the beginning of October after late September’s retracement, showing strength as BTC rallied. Currently, the price is hovering just under the all-time high as bulls take some profits.

Two swing highs and the 9 EMA could mark A$5380.87 to A$5276.72 as an area of possible support. However, a sell-the-news run on stops triggered by Wednesday’s news could reach A$5136.53, near the 18 EMA, or even A$4908.21, near the 40 EMA. A deeper retracement will likely find some buyers around the 61.8% retracement near A$4467.59.

The all-time high will likely see some profit-taking, but the area near the 27% extension, at A$6214.03, could also provide some resistance. The 61.8% extensions of the last two swings converge near A$7223.45, which could be the target for an all-time high break before a new setup emerges.

2. Casper (CSPR)

Casper CSPR is the first live proof-of-stake (PoS) blockchain built off the Casper CBC specification. The Casper platform is designed to boost the adoption of blockchain technology, smart contracts, and DApps on a global scale. Casper is optimised to suit both enterprise and developer needs. Casper’s mission is to usher in a new era for Web3, as demand for intuitive, interconnected services continues to grow across the board. Casper does so by solving the adoption trilemma: offering enterprise-grade security, scalability, and decentralisation, all within the same blockchain protocol.

CSPR Price Analysis

At the time of writing, CSPR is ranked the 190th cryptocurrency globally and the current price is A$0.1493. Let’s take a look at the chart below for price analysis:

Source: TradingView

After setting a low in mid-July, CSPR‘s 260% spike in early August turned into a nearly three-month-long consolidation. The 9, 18 and 40 EMAs are still compressing and technically show a bearish trend. However, this most likely indicates long-term accumulation, given the current market environment.

The range low established in mid-August could provide support again near A$0.1426. The price is hovering just above this level as Thursday’s mainnet upgrade approaches. This area has confluence with the current leg’s 61.8% retracement and the larger range’s 78.6% retracement.

If this level fails, bulls might also step in near the July lows at around A$0.09470. If this move occurs, it could be to run stops below the range low before starting a more significant bullish trend.

While the ultimate target might be waiting much further above, A$0.1823 has provided stiff resistance since late August. Bulls will likely take some profits here and near the 61.8% extension. The 127% extension could also see some profit-taking, along with the upper portion of the consolidation near A$0.3627.

3. NewsCrypto (NWC)

The NewsCrypto token NWC is the native token of the NewsCrypto ecosystem, which offers a comprehensive set of indicators, educational resources, and entertainment for everyone from novice traders to experts in crypto. The project aims to offer everything that a crypto trader needs in one place, while also creating a community-focused ecosystem where users can learn from each other and earn NWC for posting quality content. The NWC token is used to unlock access to the online platform, which is focused on interactive education on blockchain technology and cryptocurrency trading.

NWC Price Analysis

At the time of writing, NWC is ranked the 340th cryptocurrency globally and the current price is A$1.35. Let’s take a look at the chart below for price analysis:

Source: TradingView

NWC‘s stunning 1,592% run during the first two quarters of 2021 retraced over 80% by mid-July, making the current range a reasonable area to suspect accumulation.

The price has ranged under the 61.8% retracement of the summer’s bullish trend. This retracement and the 9, 18 and 40 EMAs give some confluence to A$1.26 as an area of possible support for aggressive bulls.

While the EMAs are currently showing a bullish trend, a dip below the last month’s stops could reach possible support near A$0.9581. If traders aggressively sell the news of Friday’s bridge, the price might also find support near A$0.8125 as it retests range lows established in early May.

An area between A$1.60 and A$1.83 is likely to provide some resistance until a more significant move is under way. If this resistance breaks, bulls might take some profits near May’s breakdown, around A$2.23, and near the 127% extension of the summer’s bull trend, near A$2.67.

Where to Buy or Trade Altcoins?

These coins have high liquidity on Binance Exchange, so that could help with trading on AUD/USDT/BTC pairs. And if you’re looking at buying and HODLing cryptos, then Swyftx Exchange is an easy-to-use popular choice in Australia. You can also buy these coins from different exchanges listed on Coinmarketcap.

Categories
Bitcoin Market Analysis Solana The Crypto Den Trading

TradeRoom: Our Weekly Crypto Trades & Analysis – Oct 25, 2021

Welcome to this weekly series from the TradeRoom. My name is Dave and I’m the founder of The Crypto Den, an Australian-based crypto trading and education community aiming to give you the knowledge to take your trading game to the next level.

In this article:

  1. Crypto Market Outlook
  2. Last Week’s Performance
  3. This Week’s Trades

Crypto Market Outlook

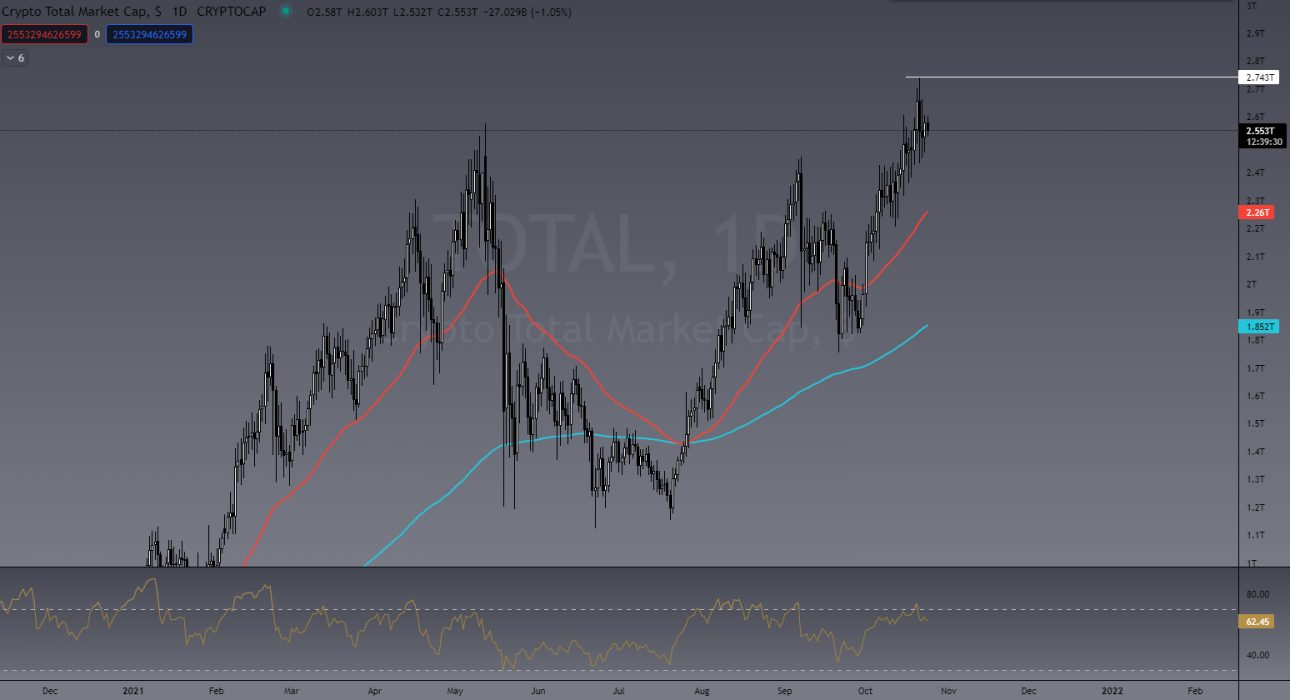
The entire crypto market cap peaked to a new all-time high (ATH) at US$2.7 trillion last week, showing strong confidence in the market. Prices are taken from Binance exchange.

Total crypto marketcap reaching US$2.7 trillion

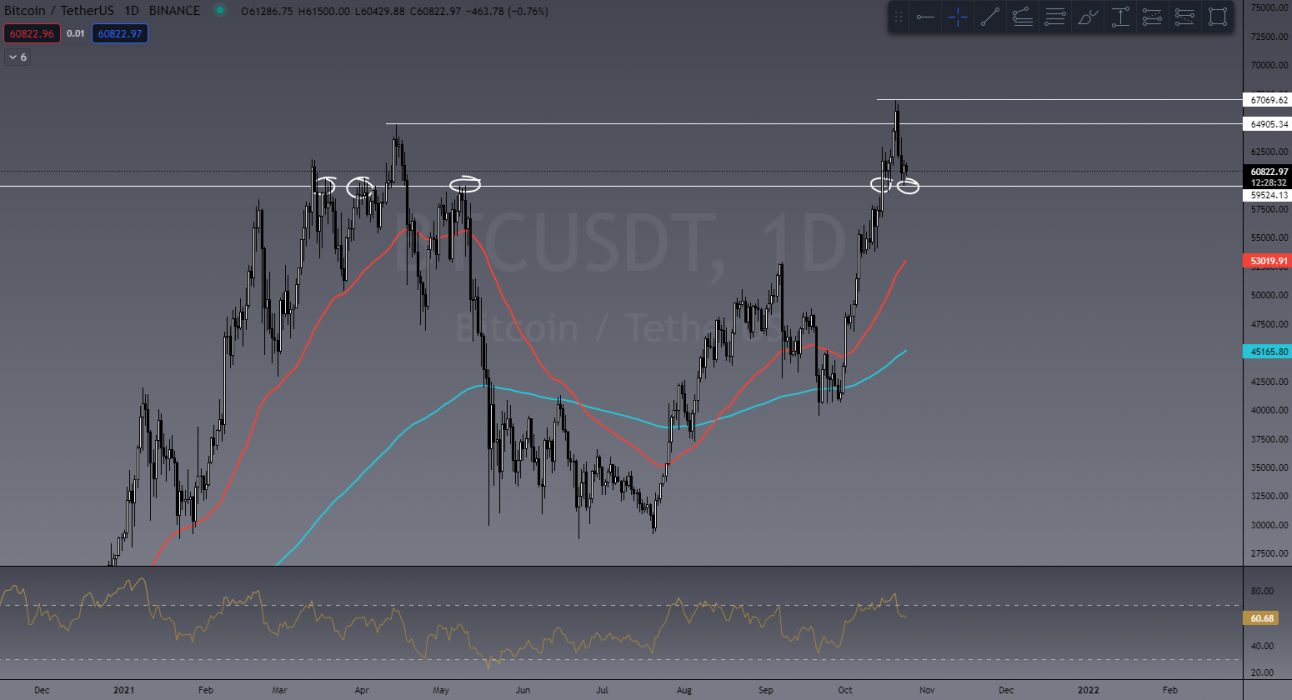
Bitcoin itself reached a new ATH of US$67,000 after clearing the previous high of US$64,900. Despite having a daily candle close above the previous ATH, bitcoin has pulled back below for the past four days, finding support at US$59,500, which has previously proved to be a key level of support/resistance.

BTC currently sitting on daily support level

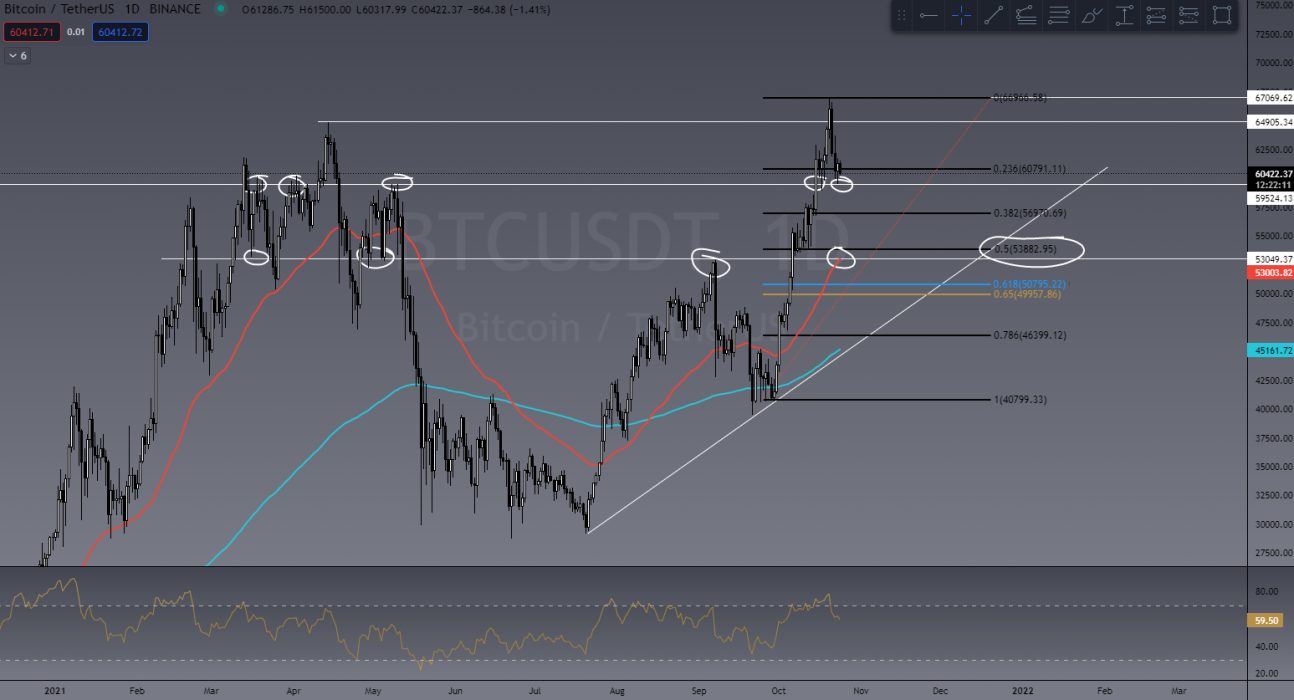
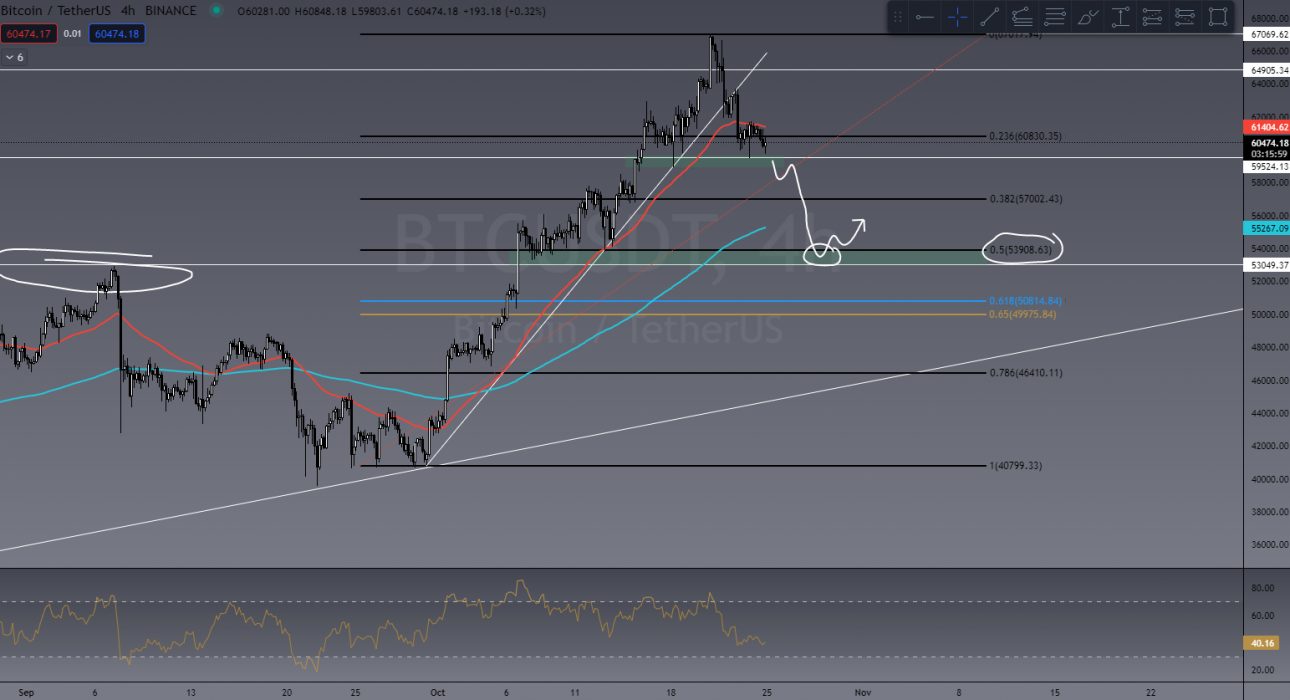
If this key level of BTC support holds, we are expecting to see some more bullish action with an initial target of US$78,000. I have outlined the reasons I believe this to be a good target in a separate blog post. If this price level were to break below and close, we could see a decent pullback to the US$53,000 zone, which will likely bring ALTS with it.

Why have we picked US$53k as a bearish target for BTC? You’ll see in the image below we have a confluence of strong daily support: with the 50EMA and 50% Fibonacci level in bull runs, a 50% retrace can be typical. For beginners to technical chart analysis, we’ve got your back and can teach how to use these tools to plot your own trades in our Trading Fundamentals Course available on The Crypto Den website.

Possible bearish price target

Ultimately in our TradeRoom, the general consensus is that we still hold a bullish bias with BTC. However, as traders we must adapt and move with the market, and have a trade plan for both scenarios of an up and down market.

In our courses and live lessons, we teach people to use the correct risk management strategies to have a plan in place no matter the direction the market takes.


Last Week’s Performance

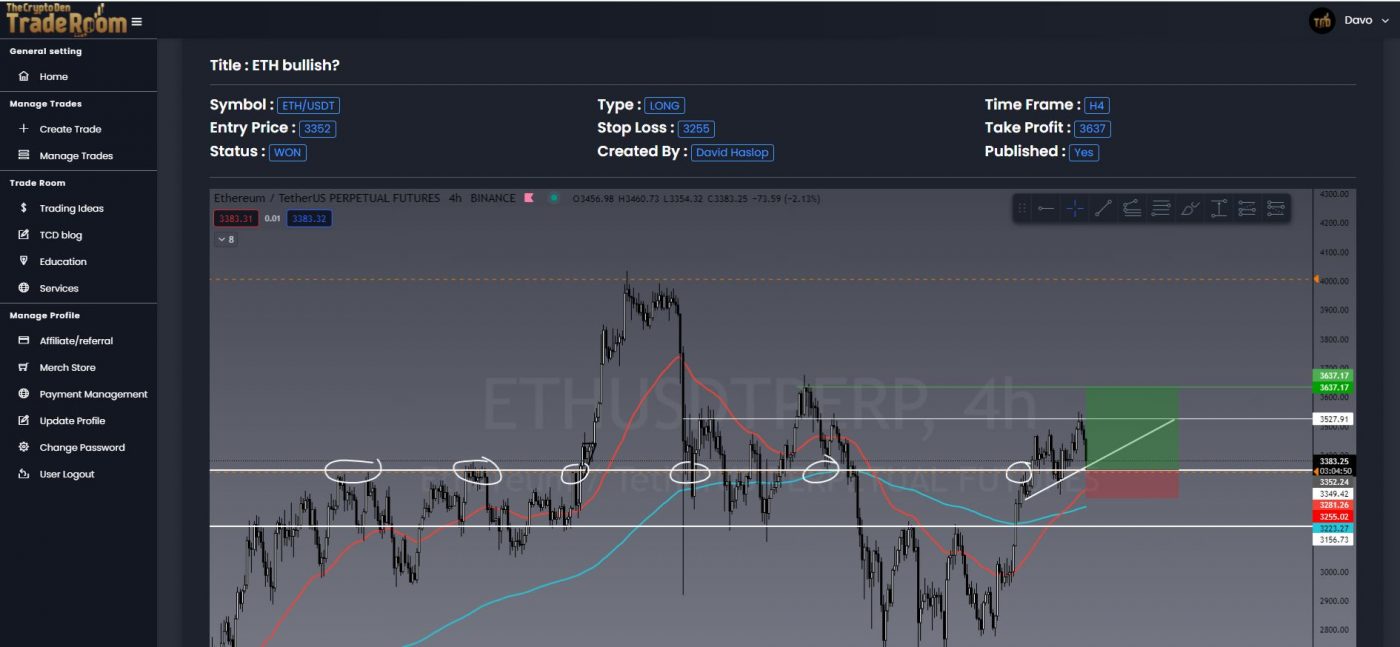
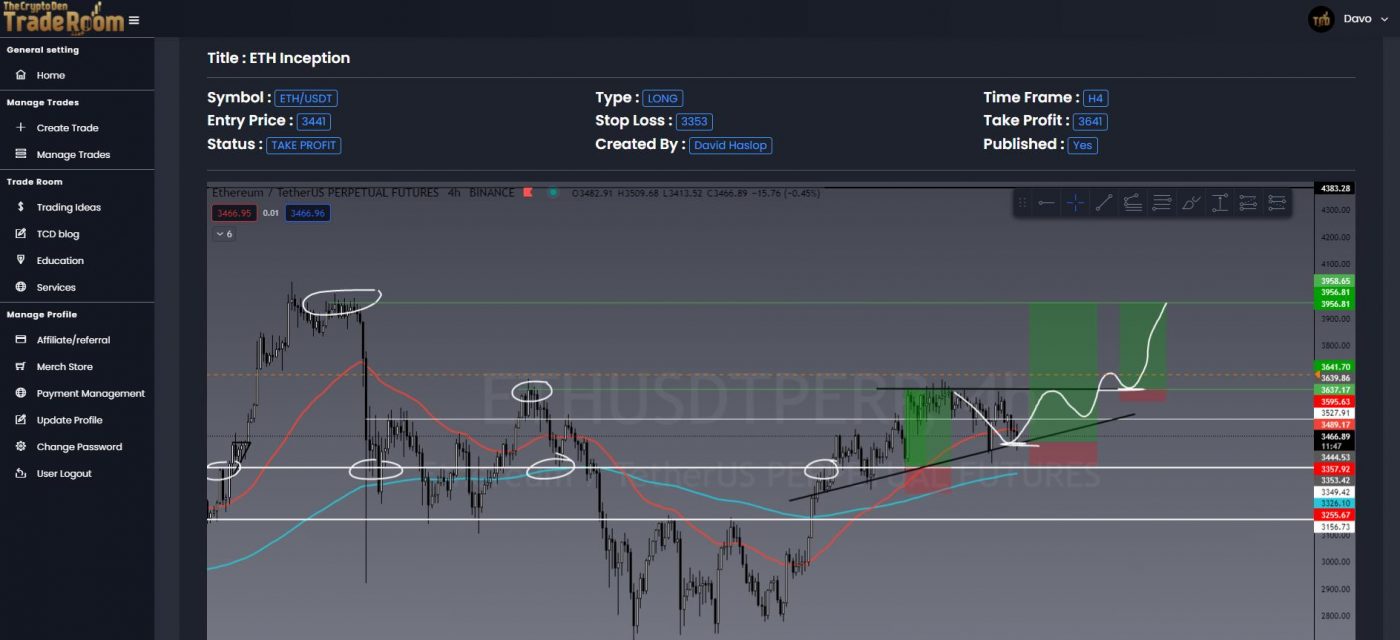
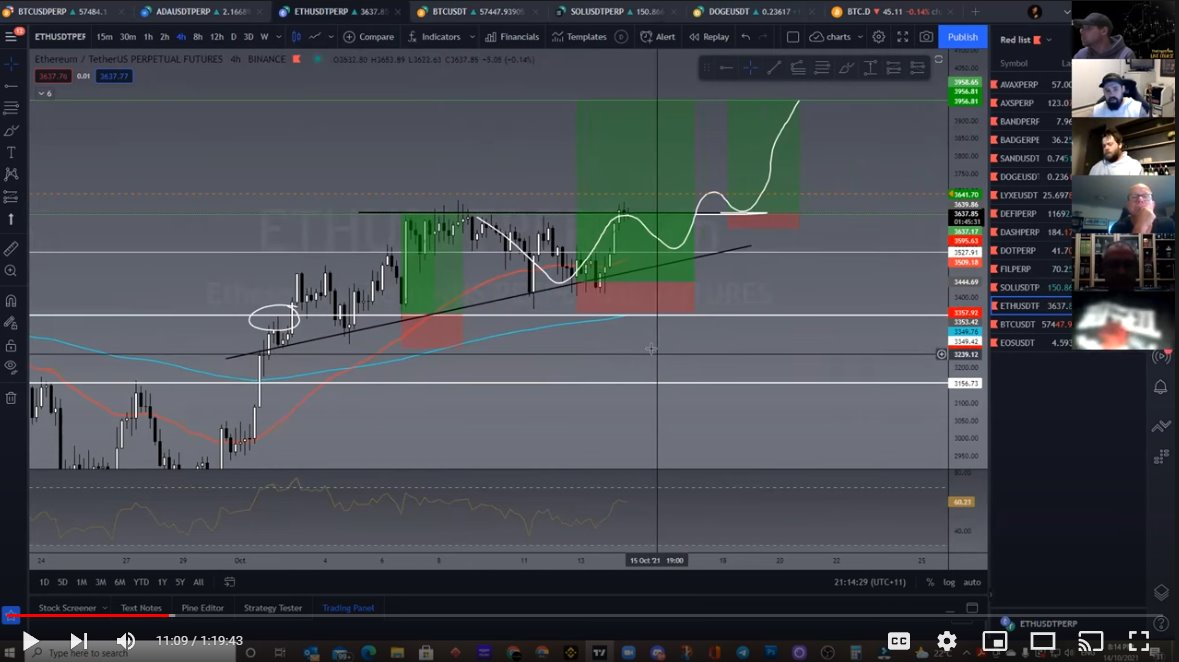
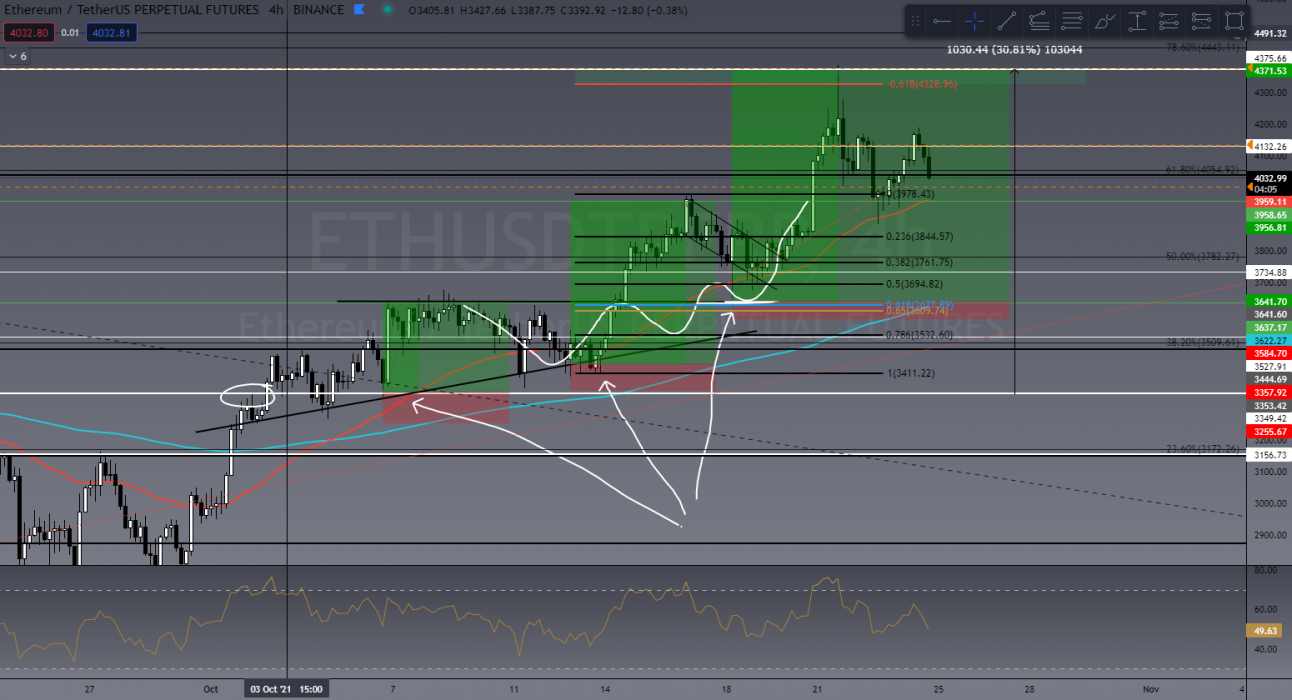
Last week in TradeRoom there were three trades we entered for Ethereum (ETH), as it tested its previous ATH showing some bullish signals in the charts. Some of the trades we made were successful and saw profit up to 500%, using staggering buy positions.

We discussed in our community that taking profits and also leaving some capital to ride through was the best strategy for this one; our members have used this strategy before with great success.

See our entries and exits below:

Trade #1: ETH/USDT

ETH/USDT: Initial entry at support level US$3,349
ETH/USDT: Next entry at new support of US$3,446
ETH/USDT: Some profit taken at resistance of US$3,641 and some at US$3,958
ETH/USDT: New entry at support of US$3,641 with profit taken at US$4,370

Trade #2: SOL/USDT

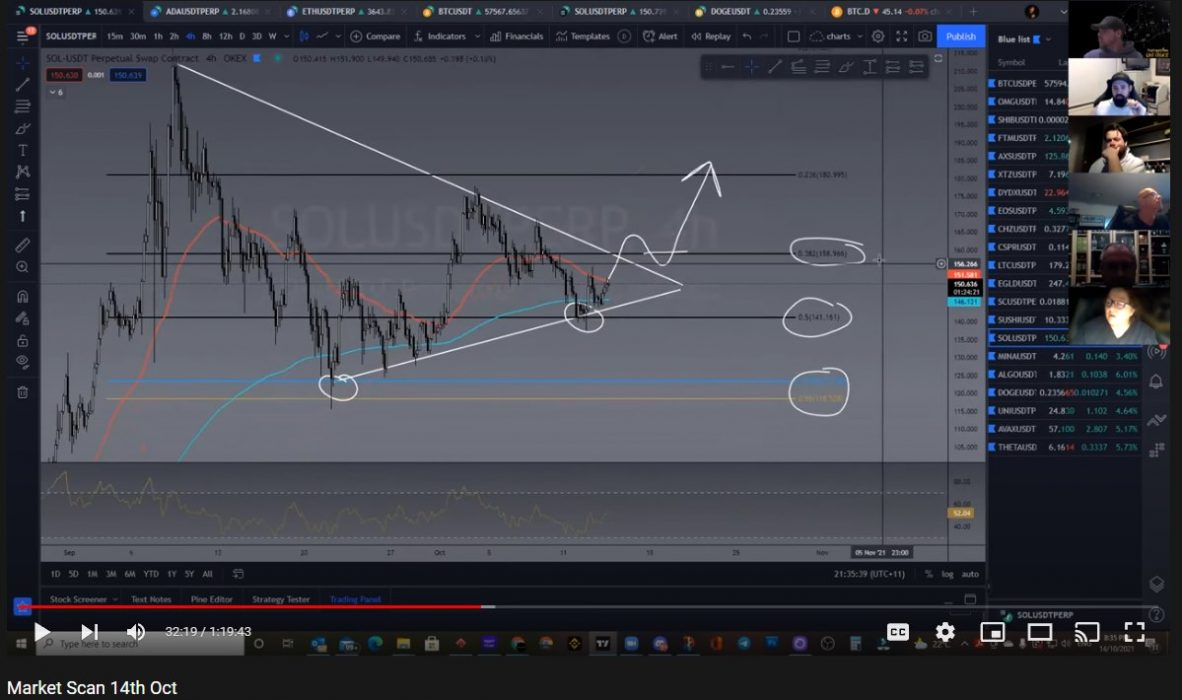
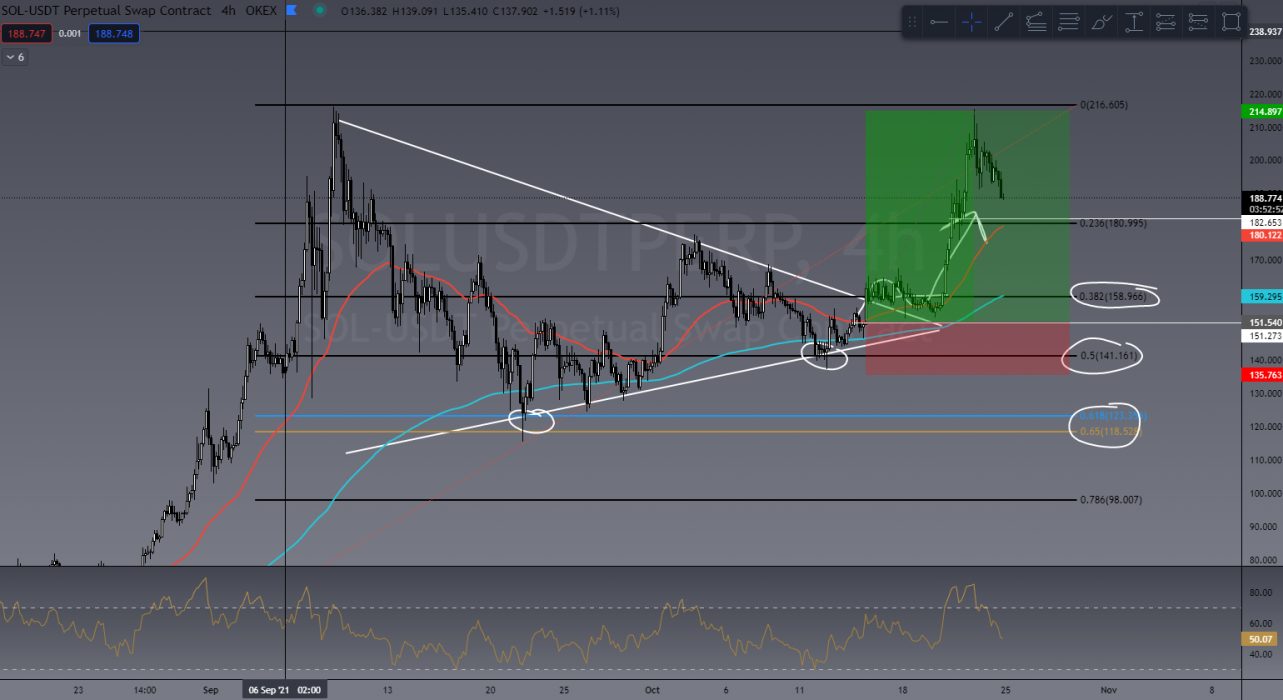
The next trade was one of our community favourites, Solana (SOL). In our TradeRoom live market scan on October 14, I drew a chart live with our members showing my plan for entering a new SOL trade. A week later, luckily, this trade went to plan and saw a profit up to 700%!

I love these live market scans as we can discuss the trades as a group and learn together. We are stronger together!

SOL/USDT: Live market scan entry shared at US$151
SOL/USDT: Profit taken at US$212

This Week’s Trades

As with most weeks, our market outlook ultimately depends on how BTC opens after the weekend. As mentioned previously, we are currently sitting on a solid level of support, however if BTC breaks below this level, we’ll be either catching a retest for a counter-trend short or waiting for US$59k to hit to enter a long position.

BTC/USDT

BTC/USDT: Bearish scenario

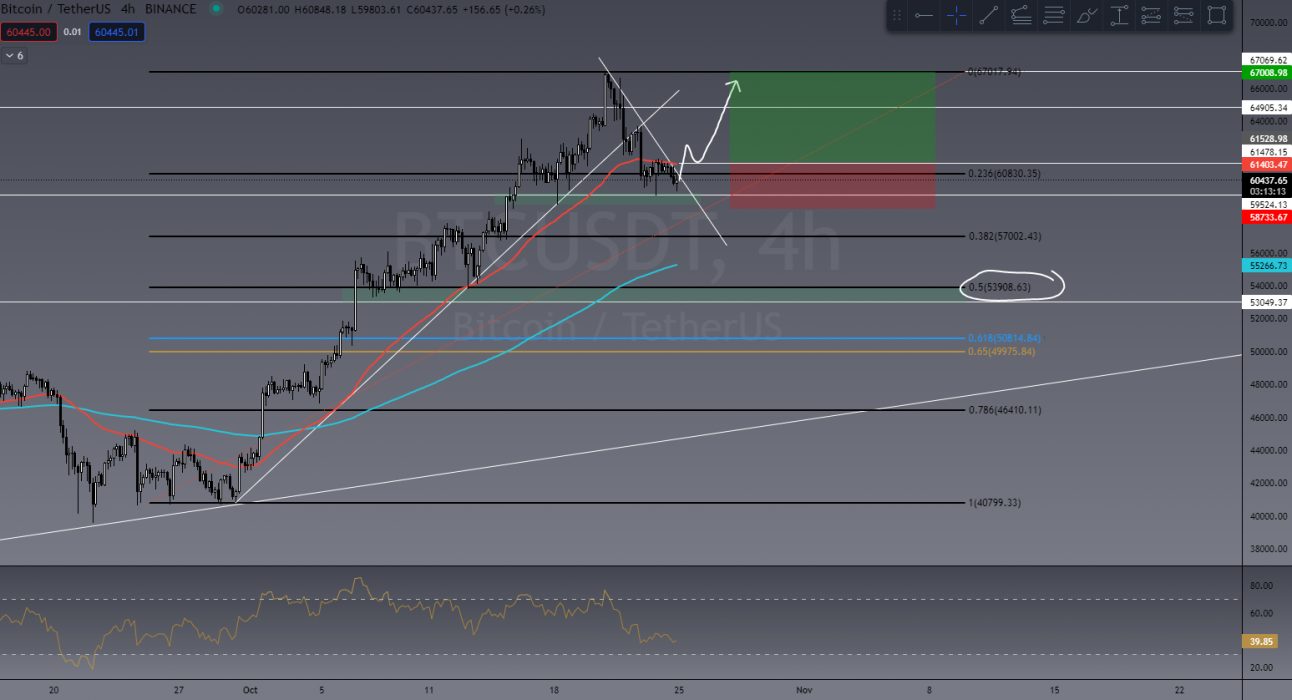
What we’re looking for at the current price level is solid candlestick analysis. We want to see a bullish engulfing candle causing a breakout of the local downtrend BTC has been in for the past four days and retest the 50EMA as support for an entry.

BTC/USDT : Bullish scenario

ETH/USDT

One of the biggest movers this week could definitely be ETH as the charts suggest. As outlined above in last week’s trades, ETH has performed extremely well lately and we see no reason for that momentum to slow just yet.

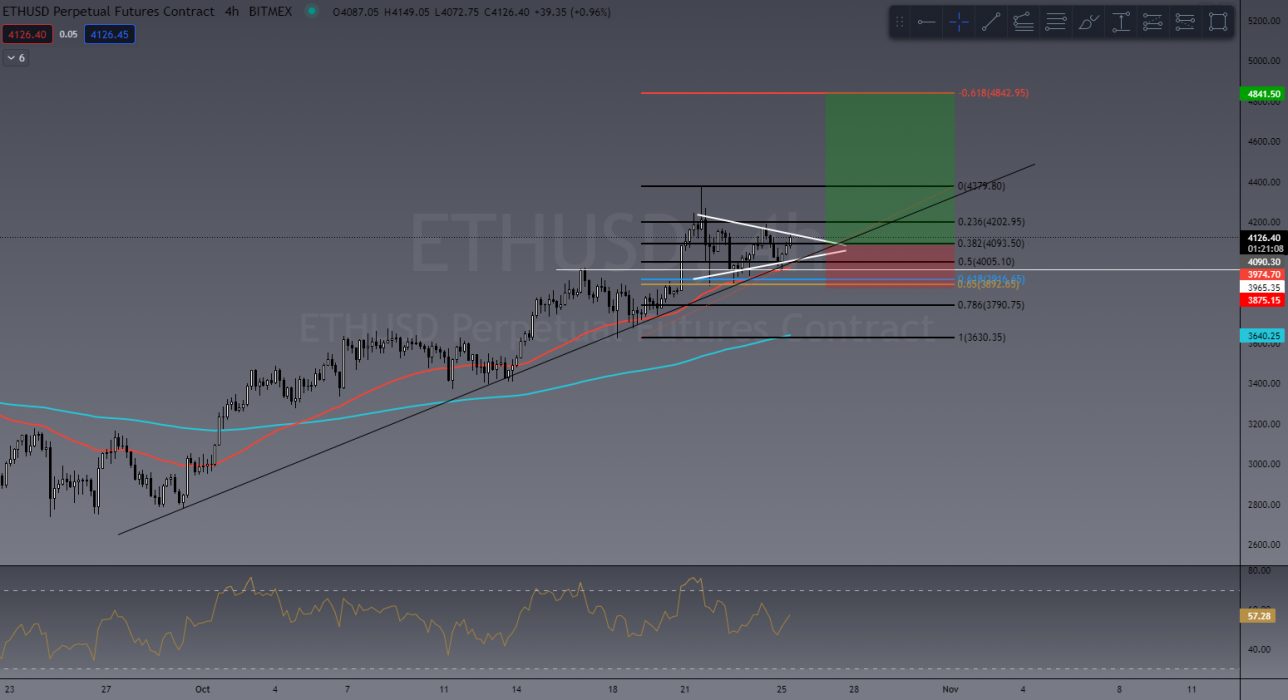
In the TradeRoom we are currently watching this symmetrical Triangle, having tested the Fib golden pocket (a key retrace level of 61.8% – 65%). A breakout to the upside here could very well see ETH on the path to a new ATH of US$5,000! Tune in next week to see if it happens!

ETH/USDT: Testing local uptrend line

SOL/USDT

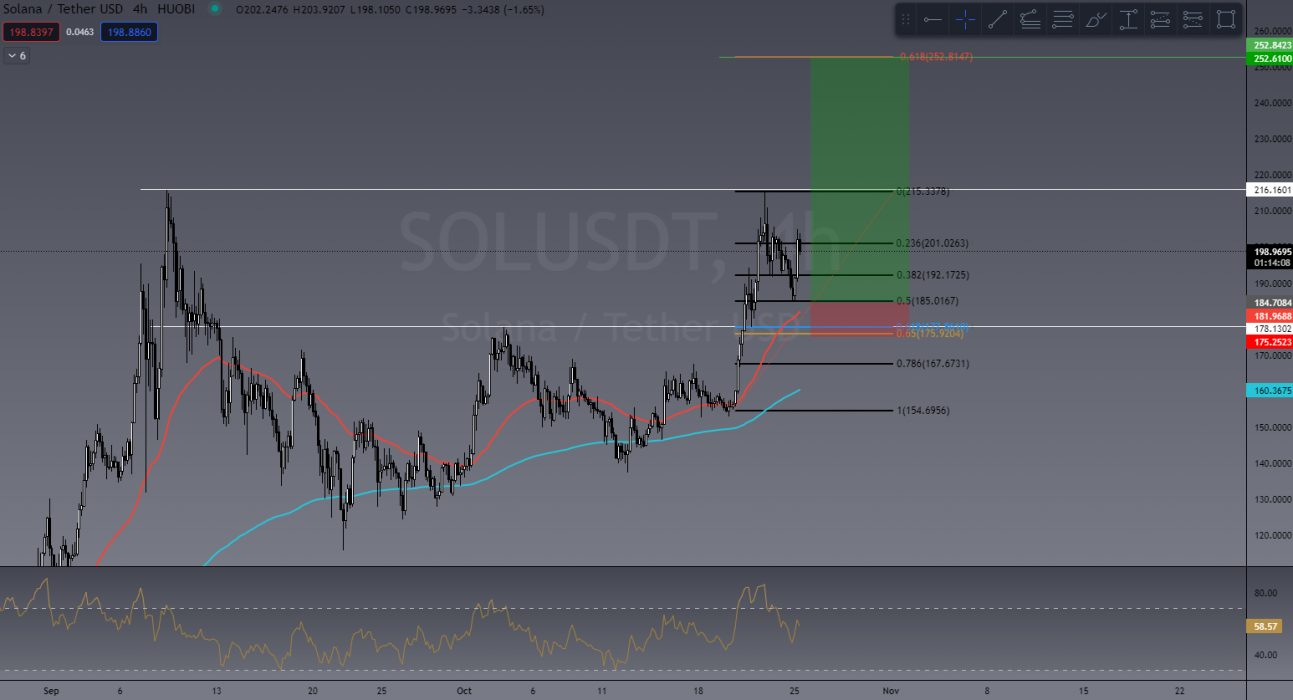
It’s hard not to be watching the frontrunners from last week’s success and, like ETH, we agree SOL is still looking very bullish. Market structure is up even after BTC had a little pullback. SOL has tested that 50% Fibonacci level again with a price projection of US$252 in price discovery. If this plays out to plan, the key entry on 50% fib has been missed, however SOL certainly has room to move here! Definitely one to keep a close eye on.

One thing we’ve learnt about trading altcoins is that they are absolutely subject to what BTC is doing. If BTC takes a bullish path we may see the altcoins follow it up, whereas if BTC takes a bearish path we may likely see them follow it down.

If you would like to become a better trader, you are invited to join our TradeRoom where we share daily charts and market analysis. In our community we strongly encourage and teach correct risk management strategies to keep our members safe in this new volatile crypto market.

>> Take our Free Beginners’ Trading Course

>> Join our Trading Community


The Crypto Den was created in 2017 to help the rapidly growing crypto community learn and understand the fundamentals of digital currencies and how to trade them. 

Since then we have taught thousands of members the basics of technical analysis and trading strategies to further progress and perfect their trading abilities.

In the TradeRoom you will be included in a supportive environment which encourages personal growth, education and community support.

It’s a place to share your trading ideas and follow other experienced traders’ feeds to help keep your finger on the pulse of such a volatile market!

Categories
Crypto News Market Analysis Monero Theta Trading

Top 3 Coins To Watch Today: THETA, SHIB, XMR – October 25 Trading Analysis

Let’s take a closer look at today’s altcoins showing breakout signals. We’ll explain what the coin is, then dive into the trading charts and provide some analysis to help you decide.

1. Theta Network (THETA)

Theta Network THETA is a blockchain-powered network purpose-built for video streaming. Launched in March 2019, the Theta mainnet operates as a decentralised network in which users share bandwidth and computing resources on a peer-to-peer (P2P) basis. Theta features its own native cryptocurrency token, THETA, which performs various governance tasks within the network, and counts Google, Binance, Blockchain ventures, Gumi, Sony Europe and Samsung as Enterprise validators, along with a Guardian network of thousands of community-run guardian nodes.

THETA Price Analysis

At the time of writing, THETA is ranked the 32nd cryptocurrency globally and the current price is A$8.68. Let’s take a look at the chart below for price analysis:

Source: TradingView

THETA‘s euphoric early-June pump turned into a late-July dump, with little higher-timeframe support for bulls to justify entries.

Currently, the price is distributing at the 60% retracement level. A small consolidation near A$8.60 is visible on the daily chart. This area does have some confluence with the retracement level and could offer some support in the future. 

The daily gap’s midpoint near A$9.55 has suppressed the price, although a push through this level could fill the daily gap up to A$11.62. A lack of sensitivity at this resistance could suggest a minor retracement before a possible move to new monthly highs.

2. Shiba Inu (SHIB)

Shiba Inu SHIB coin was created anonymously in August 2020 under the pseudonym “Ryoshi”. The meme coin quickly gained speed and value as a community of investors was drawn in by the cute charm of the coin, paired with headlines and tweets from personalities like Elon Musk and Vitalik Buterin.

SHIB Price Analysis

At the time of writing, SHIB is ranked the 11th cryptocurrency globally and the current price is A$0.00005787. Let’s take a look at the chart below for price analysis:

Source: TradingView

SHIB wasted no time during October, rocketing upward over 465% from the first week of the month into the resistance near A$0.00005982.

For the past several days, the price has been moving in a rising wedge and appears to be flipping old resistance near A$0.00005542 to support. If this level breaks – perhaps due to the tempting daily equal lows below – the next support begins near A$0.00004829.

Bulls entering at these levels could set their first target near the previous resistance near A$0.00005980. Beyond this level, probable targets include the new highs near A$0.00006124 and the resistance above near A$0.00006492.

A break of this resistance later this month could continue to the new all-time highs near A$0.00006822 and A$0.00007154.

3. Monero (XMR)

Monero XMR allows transactions to take place privately and with anonymity. Even though it’s commonly thought that BTC can conceal a person’s identity, it’s often easy to trace payments back to their original source because blockchains are transparent. On the other hand, XMR is designed to obscure senders and recipients alike through the use of advanced cryptography. The team behind Monero says privacy and security are their biggest priorities, with ease of use and efficiency coming second. It aims to provide protection to all users irrespective of how technologically competent they are.

XMR Price Analysis

At the time of writing, XMR is ranked the 38th cryptocurrency globally and the current price is A$370.75. Let’s take a look at the chart below for price analysis:

Source: TradingView

XMR‘s 235% pump during Q2 ran into resistance near A$620 on April 10. Since then, the price has been consolidating in a 120% range between A$345 and A$420.

Just below the monthly open, A$347 is the first level likely to provide substantial support. If the price breaks down through this level, overlapping levels near A$336 might cap a run on the lows near A$325 and A$308.

The higher-timeframe analysis points to the area near A$384 as the next substantial resistance. Significant selling has been occurring here on the daily chart. If this level breaks, the swing highs near A$398 and A$417 may be the next target.

Where to Buy or Trade Altcoins?

These three coins have high liquidity on Binance Exchange, so that could help with trading on AUD/USDT/BTC pairs. And if you’re looking at buying and HODLing cryptos, then Swyftx Exchange is an easy-to-use popular choice in Australia.

Categories
Crypto News Litecoin Market Analysis Ripple Trading

Top 3 Coins to Watch Today: XRP, LTC, AAVE – October 22 Trading Analysis

Let’s take a closer look at today’s altcoins showing breakout signals. We’ll explain what the coin is, then dive into the trading charts and provide some analysis to help you decide.

1. Ripple (XRP)

Ripple XRP is the currency that runs on a digital payment platform called RippleNet, which is on top of a distributed ledger database called XRP Ledger. While RippleNet is run by a company called Ripple, the XRP Ledger is open-source and is not based on blockchain, but rather the previously mentioned distributed ledger database.

XRP Price Analysis

At the time of writing, XRP is ranked the 7th cryptocurrency globally and the current price is A$1.48. Let’s take a look at the chart below for price analysis:

Source: TradingView

XRP‘s 87% climb during early August returned to the monthly open, sweeping lows several times down to A$1.40. Last week, the price bounced from the monthly open near A$1.44 again, creating possible support near A$1.42. A quick sweep of this recent swing low could reach into a support area near A$1.38, while a sharp downturn in the market is likely to run for the relatively equal lows near A$1.35.

If the price breaks through the closest significant resistance near A$1.54, the swing high at A$1.57 is a likely target. This move could reach the daily gap near A$1.63.

Strong bullish momentum could propel the price to resistance near A$1.65. If this move occurs, the significant swing high near A$1.70 provides a reasonable goal.

2. Litecoin (LTC)

Litecoin LTC is a cryptocurrency that was designed to provide fast, secure and low-cost payments by leveraging the unique properties of blockchain technology. The cryptocurrency was created based on the Bitcoin protocol, but it differs in terms of the hashing algorithm used, hard cap, block transaction times, and a few other factors. Litecoin has a block time of just 2.5 minutes and extremely low transaction fees, making it suitable for micro-transactions and point-of-sale payments.

LTC Price Analysis

At the time of writing, LTC is ranked the 14th cryptocurrency globally and the current price is A$267.61. Let’s take a look at the chart below for price analysis:

Source: TradingView

LTC spent the month of September ranging across the monthly open, reaching 26.5% over and 45% below.

The price is currently consolidating between adjacent resistance and support at A$258 with no clear higher-timeframe trend. A strong move over the monthly open could signal a run to resistance beginning near A$270. 

This move would likely target the swing high at A$276 and relatively equal highs near A$280. A sustained bullish trend could reach up to the monthly high near A$295.

Bulls might see a sweep of the relatively equal lows near A$255 as a chance to buy at a discount. If this level fails to hold, the next significant area for the price to find buyers is likely near the consolidation around A$245.

3. Aave (AAVE)

AAVE is a decentralised finance protocol that allows people to lend and borrow crypto. Lenders earn interest by depositing digital assets into specially created liquidity pools. Borrowers can then use their crypto as collateral to take out a flash loan using this liquidity. AAVE provides holders with discounted fees on the platform, and it also serves as a governance token – giving owners a say in the future development of the protocol.

AAVE Price Analysis

At the time of writing, AAVE is ranked the 420th cryptocurrency globally and the current price is A$421.72. Let’s take a look at the chart below for price analysis:

Source: TradingView

AAVE‘s strong downtrend that began in August has retraced most of its Q3 move, recently sweeping lows near A$388 but struggling to find strong support.

A sweep of the relatively equal lows near A$384 into possible support around A$380, combined with bullish market conditions, could be the catalyst that begins to form a bottom. If this level fails, bulls might buy the monthly gap’s low near A$375.

The swing low near A$418 may form resistance to any sudden pumps as holders unload some of their position. A more substantial move might sweep relatively swing highs into probable resistance near A$431, potentially reaching up to the monthly open near A$238 and A$246.

Where to Buy or Trade Altcoins?

These coins have high liquidity on Binance Exchange, so that could help with trading on AUD/USDT/BTC pairs. And if you’re looking at buying and HODLing cryptos, then Swyftx Exchange is an easy-to-use popular choice in Australia.