Categories
Crypto News Market Analysis Ripple The Sandbox Trading TRON

Top 3 Coins to Watch Today: XRP, SAND, TRX – July 6 Trading Analysis

Let’s take a closer look at today’s altcoins showing breakout signals. We’ll explain what the coin is, then dive into the trading charts and provide some analysis to help you decide.

1. Ripple (XRP)

Ripple XRP is the currency that runs on a digital payment platform called RippleNet, on top of a distributed ledger database called XRP Ledger. While RippleNet is run by a company called Ripple, the XRP Ledger is open-source and not based on a blockchain, but rather the aforementioned distributed ledger database.

XRP Price Analysis

At the time of writing, XRP is ranked the 7th cryptocurrency globally and the current price is US$0.3249. Let’s take a look at the chart below for price analysis:

Source: TradingView

XRP printed some gains during Q1 and Q2 after moving sideways for the past few weeks. The price is in a downtrend, with the 9, 18 and 40 EMAs providing resistance on each attempt to rally.

However, bulls are showing some interest at the 80% retracement, near $0.3210. If this level breaks, a move into possible support – just below the lows near $0.2932 – seems likely.

If the price does rally through the swing high at $0.3755 – perhaps triggered by a sudden surge in Bitcoin – bulls might find some resistance at the 61.8% retracement level near $0.4050. 

Overlapping swing highs and lows near $0.4426 may provide the next target, where bears immediately forced the price down in late December.

More bullish market conditions could shift targets up near the midpoint of Q1’s consolidation, near $0.5032, where higher timeframes show an inefficiently traded zone.

2. The Sandbox (SAND)

The Sandbox SAND is a blockchain-based virtual world allowing users to create, build, buy and sell digital assets in the form of a game. By combining the powers of decentralised autonomous organisations (DAOs) and non-fungible tokens (NFTs), the Sandbox creates a decentralised platform for a thriving gaming community. The Sandbox employs the powers of blockchain technology by introducing the SAND utility token, which facilitates transactions on the platform.

SAND Price Analysis

At the time of writing, SAND is ranked the 34th cryptocurrency globally and the current price is US$1.19. Let’s take a look at the chart below for price analysis:

Source: TradingView

SAND‘s impressive gains during Q1 halted at $3.10 before retracing 85% of the move. This price action created several areas of possible higher-timeframe resistance in the process.

The price found resistance on its last swing upward near $1.27 – an area that could provide resistance again. If this swing high breaks, the price might find resistance near $1.40. If this area does provide resistance, it would suggest the formation of a higher-timeframe consolidation.

The fast move up left little higher-timeframe support. However, a vast zone between $0.9890 and $0.9146 has provided support before and could give support again on a retest. This zone is between the 71.8%-to-88.6% retracement levels of 2021 Q4’s parabolic move.

Continuation downward through this level, especially if the overall market remains bearish, could retrace most of Q2’s move to the next higher-timeframe support near $0.8645.

3. Tron (TRX)

Tron TRX is a blockchain-based operating system that aims to ensure this technology is suitable for daily use. Whereas Bitcoin can handle up to six transactions per second, and Ethereum up to 25, TRON claims that its network has a capacity for 2,000 TPS. This project is best described as a decentralised platform focused on content sharing and entertainment, and to this end, one of its biggest acquisitions was the file-sharing service BitTorrent in 2018. Overall, TRON has divided its goals into six phases. These include delivering simple distributed file sharing and driving content creation through financial rewards.

TRX Price Analysis

At the time of writing, TRX is ranked the 13th cryptocurrency globally and the current price is US$0.06821. Let’s take a look at the chart below for price analysis:

Source: TradingView

TRX accompanied the rest of the market during the Q2 drop, falling nearly 54% from mid-May until it found a low last week.

Price action formed a weekly support level near $0.06254, which has so far held up the price. The most recent swing low inside this range, near $0.06049, may be the target for any future stop runs. After this low, the swing low near $0.05689 and the gap beginning near $0.05126 mark possible higher-timeframe support.

The price is currently battling with significant higher-timeframe resistance levels, with the closest probable resistance resting near $0.08492, just over the previous monthly open. A sweep of the relatively equal highs above this resistance might find sellers near $0.09235 but could reach as high as $0.1093.

Learn How to Trade Live!

Join Dave and The Crypto Den Crew and they’ll show you live on a webinar how to take your crypto trading to the next level.
Where to Buy or Trade Altcoins?

These coins have high liquidity on Binance Exchange, so that could help with trading on AUD/USDT/BTC pairs. And if you’re looking at buying and HODLing cryptos, then Swyftx Exchange is an easy-to-use popular choice in Australia.

Categories
ARPA Chain Crypto News Elrond Gala Market Analysis Trading

Top 3 Coins to Watch Today: GALA, EGLD, ARPA – July 4 Trading Analysis

Let’s take a closer look at today’s altcoins showing breakout signals. We’ll explain what the coin is, then dive into the trading charts and provide some analysis to help you decide.

1. Gala (GALA)

GALA aims to take the gaming industry in a different direction by giving players back control over their games. Gala Games’ mission is to make “blockchain games you’ll actually want to play”. The project wants to change how players can spend hundreds of dollars on in-game assets and countless hours playing the game, all of which could be taken away from them with the click of a button. It plans to reintroduce creative thinking by giving players control of the games and in-game assets with the help of blockchain technology.

GALA Price Analysis

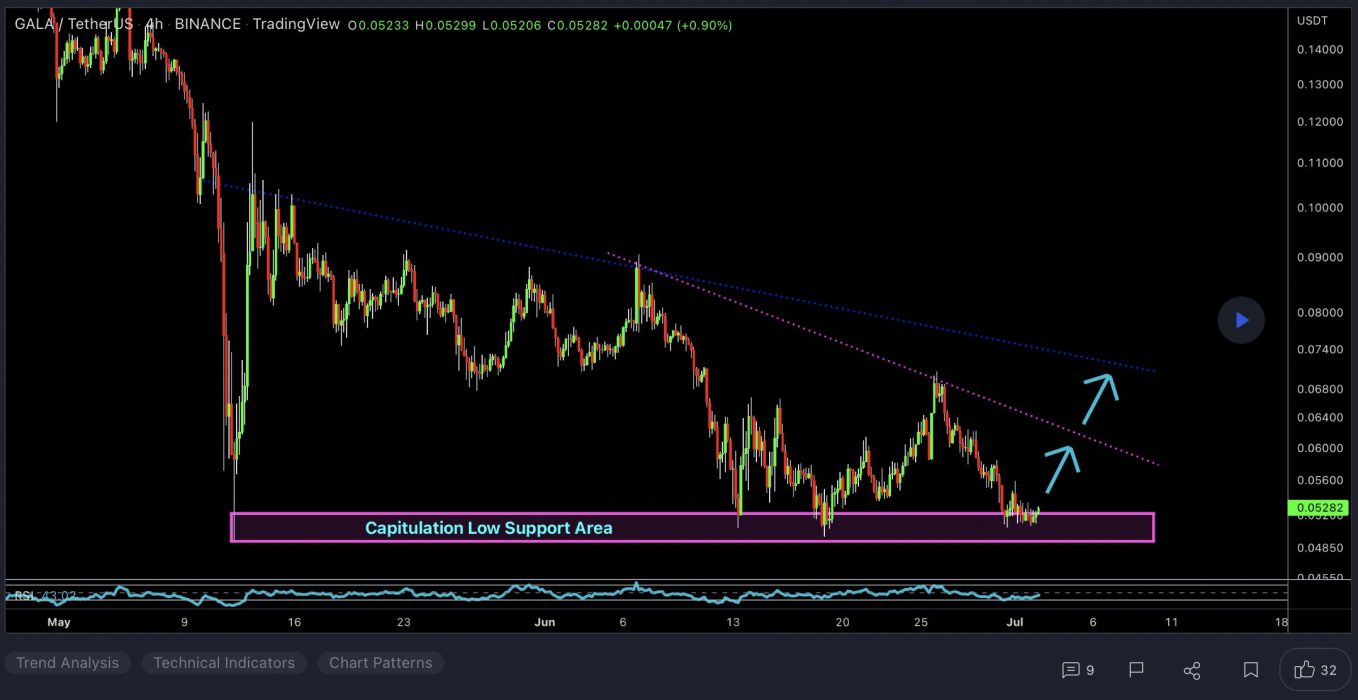
At the time of writing, GALA is ranked the 84th cryptocurrency globally and the current price is US$0.05267. Let’s take a look at the chart below for price analysis:

Source: TradingView

After setting a low last week, GALA turned into a recovery trend to make the new monthly highs.

The following 80% plummet found support near $0.05039, sweeping under the 40 EMA into the 60.8% retracement level before bouncing to resistance beginning at $0.06320.

This area could continue to provide resistance, possibly causing a retracement to the 9 EMA and 18 EMA near $0.06912, where aggressive bulls might begin bidding. The level near $0.07534, which has confluence with the 40 EMA, may see more interest from bulls loading up for an attempt on probable resistance beginning near $0.08685. 

However, if Bitcoin continues its sideways trend, much lower prices could be seen. The old support near $0.04620 could provide at least a short-term bounce. If this level fails, the old highs near $0.03935 might also give support and see the start of a new bullish cycle after retesting these support levels.

2. Elrond (EGLD)

Elrond EGLD is a blockchain protocol that seeks to offer extremely fast transaction speeds by using sharding. The project describes itself as a technology ecosystem for the new internet, which includes fintech, decentralised finance, and the Internet of Things. Its smart contracts execution platform is reportedly capable of 15,000 transactions per second, six-second latency, and a $0.001 transaction cost. The blockchain has a native token known as eGold, or EGLD, used for paying network fees, staking, and rewarding validators.

EGLD Price Analysis

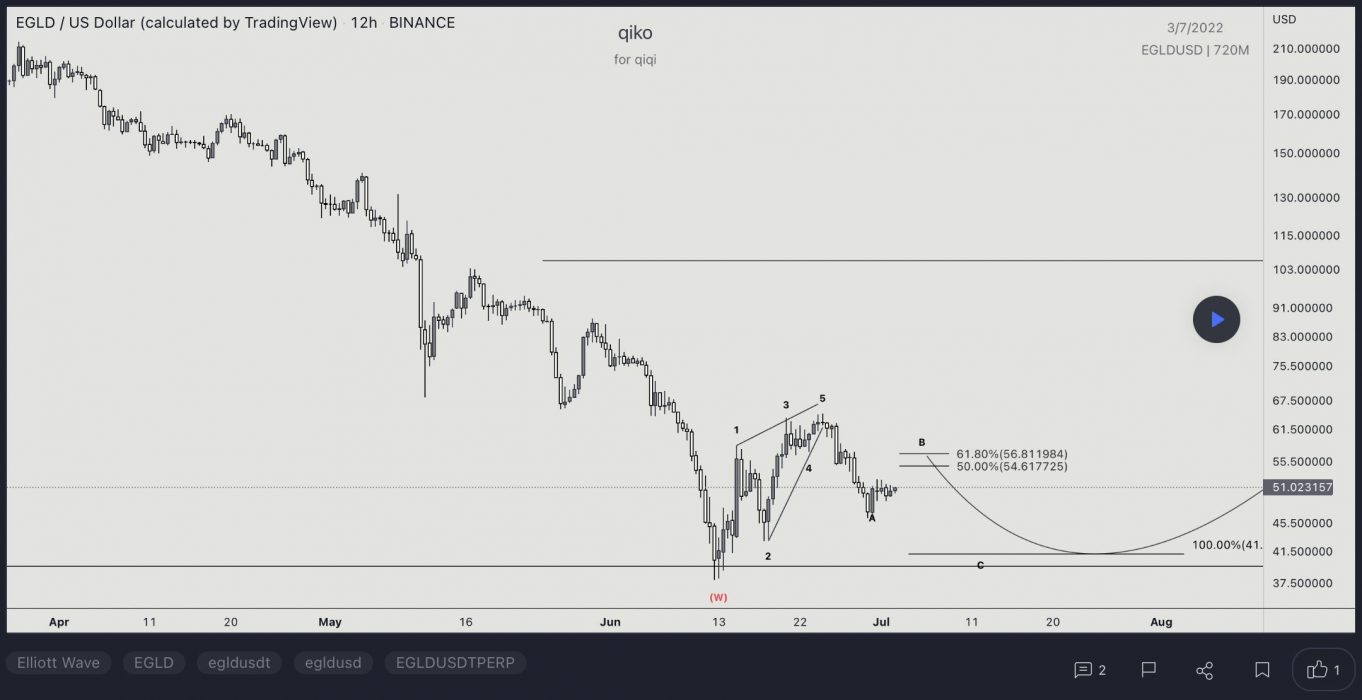
At the time of writing, EGLD is ranked the 43rd cryptocurrency globally and the current price is US$50.33. Let’s take a look at the chart below for price analysis:

Source: TradingView

EGLD‘s 65% rally during Q1 reversed with many other coins in Q2, retracing nearly 45%.

Just above the current price and near the June monthly open, $70.68 could provide resistance before a downward move. This level has confluence with the 18 EMA.

Bears might consider $75.94 as a higher probability resistance to hunt shorts for a longer swing downward. However, higher-timeframe charts suggest that the price could reach $87.45 at the top of an inefficiently traded area before any future bearish breakdowns.

Resistance might also rest near $90.45, above the recent monthly open. However, the price is less likely to reach this level unless the overall market starts a bullish swing.

The price is finding support between $49.44 and $40.586. This zone might continue to hold, while overlapping higher-timeframe levels from $38.44 to $35.81 could provide the most substantial support inside this area. 

3. ARPA Chain (ARPA)

ARPA is a blockchain-based layer 2 solution for privacy-preserving computation, enabled by Multi-Party Computation (MPC). Founded in April 2018, the goal of ARPA is to separate data utility from ownership and enable data renting. ARPA’s MPC protocol creates ways for multiple entities to collaboratively analyse data and extract data synergies while keeping each party’s data input private and secure. Developers can build privacy-preserving dApps on blockchains compatible with ARPA. Some immediate use cases include credit anti-fraud, secure data wallets, precision marketing, joint AI model training, and key management systems.

ARPA Price Analysis

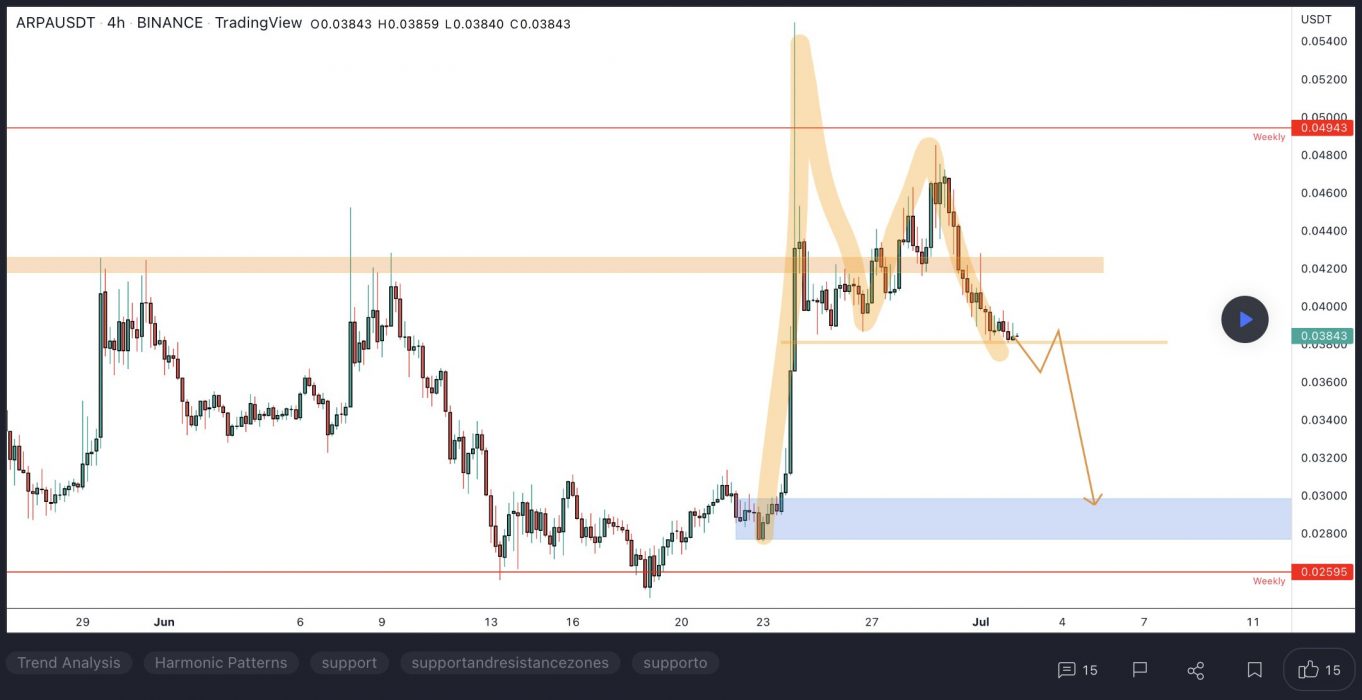
At the time of writing, ARPA is ranked the 367th cryptocurrency globally and the current price is US$0.03729. Let’s take a look at the chart below for price analysis:

Source: TradingView

ARPA set a high near $0.08732 in April before retracing nearly 83% to find a low near $0.03157. The price consolidated around this level before the strong bullish impulse during the past several weeks.

Probable resistance near $0.04288 is slowing the bullish advance down. However, another leg might target the last swing high at $0.04351 and relatively equal highs at $0.04833. Resistance near $0.05472 could cap the move before the second swing high. Beyond these levels, little stands in the bulls’ way before reaching the swing high near $0.06148.

A retracement before a move higher might find support in the daily gap near $0.03574, just above the monthly open. Relatively equal lows near $0.03130 could also provide support. Run-on stops at $0.02944 and $0.02820 might find support in the gap beginning near $0.02687 or a high-timeframe level near $0.02477.

Learn How to Trade Live!

Join Dave and The Crypto Den Crew and they’ll show you live on a webinar how to take your crypto trading to the next level.

Where to Buy or Trade Altcoins?

These coins have high liquidity on Binance Exchange, so that could help with trading on AUD/USDT/BTC pairs. And if you’re looking at buying and HODLing cryptos, then Swyftx Exchange is an easy-to-use popular choice in Australia.

Categories
Cosmos Crypto News Market Analysis Request Trading Zcash

Top 3 Coins to Watch Today: ZEC, REQ, ATOM – July 1 Trading Analysis 

Let’s take a closer look at today’s altcoins showing breakout signals. We’ll explain what the coin is, then dive into the trading charts and provide some analysis to help you decide.

1. Zcash (ZEC)

Zcash ZEC is a decentralised cryptocurrency focused on privacy and anonymity. It uses the zk-SNARK zero-knowledge proof technology that allows nodes on the network to verify transactions without revealing any sensitive information about those transactions. Zcash transactions, on the other hand, still have to be relayed via a public blockchain but, unlike pseudonymous cryptocurrencies, ZEC transactions by default do not reveal the sending and receiving addresses or the amount being sent.

ZEC Price Analysis

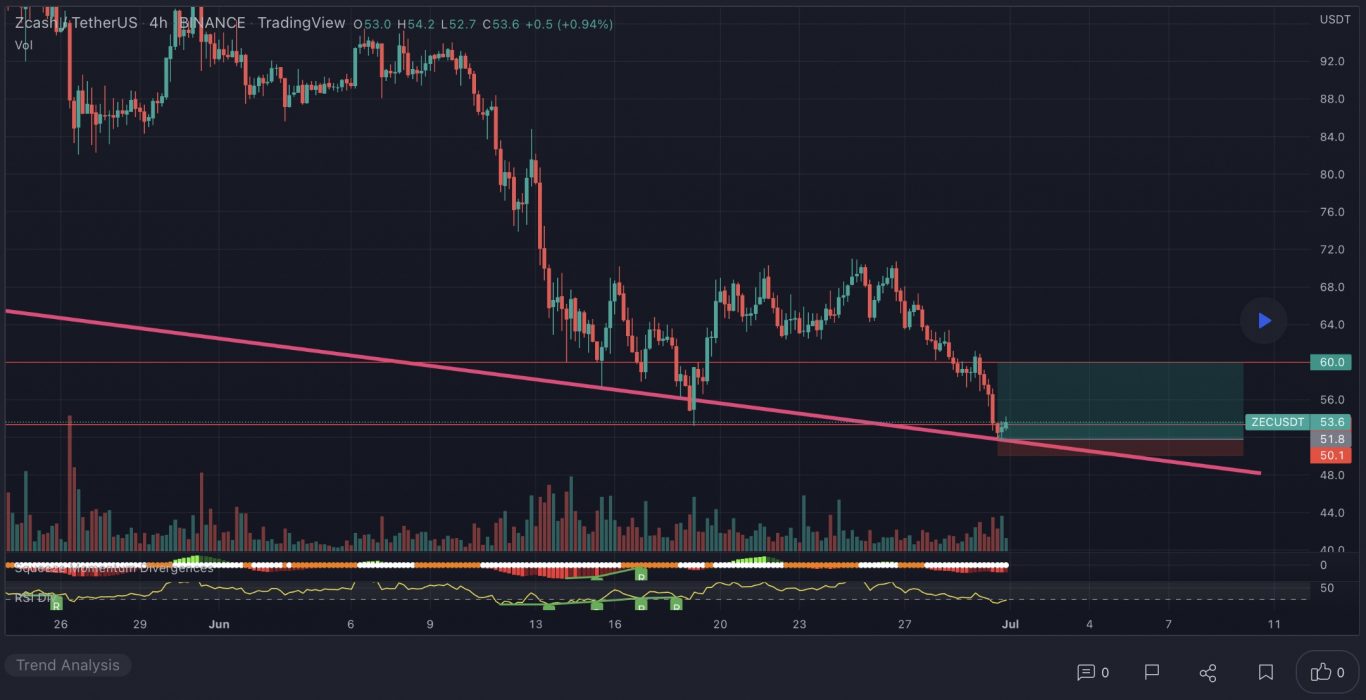
At the time of writing, ZEC is ranked the 50th cryptocurrency globally and the current price is US$53.23. Let’s take a look at the chart below for price analysis:

Source: TradingView

ZEC‘s recent bearish flip of the 9, 18 and 40 EMAs may cause bulls to be less aggressive in bidding. However, possible support near $50.47 and $41.96 – between the 41.8% and 58.6% retracements – could see at least a short-term bounce. 

Last year’s long-term consolidation suggests that the areas near $84.23 may be more likely to cause a longer-term trend reversal. 

Bears are likely to add to their shorts at probable resistance beginning near $95.50, which has confluence with the 18 EMA. A fast break of this resistance could trigger more selling near $106.12, the start of the bearish move.

If an aggressive bullish move does appear, trapped buyers in the probable resistance beginning near $115.32 might provide a ceiling for this impulse.

2. Request (REQ)

The Request REQ utility token ensures the performance and stability of the Request Network. The Request Network itself is an Ethereum-based decentralised payment system where anyone can request a payment and receive money through secure means. It removes the requirement for third parties in order to provide a cheaper, more secure payment solution that works with all global currencies. 

REQ Price Analysis

At the time of writing, REQ is ranked the 160th cryptocurrency globally and the current price is US$0.1174. Let’s take a look at the chart below for price analysis:

Source: TradingView

REQ has continued its rally through the daily gap between $0.08133 and $0.1057, turning this region into an area of possible support. 

However, a stop run under the relatively equal lows at $0.07583 could form a wick below this level, potentially reaching an untapped daily gap beginning near $0.07051.

Resistance beginning at $0.1372 has seen significant profit-taking, shown by the long upper wicks on the daily candles. A break of this resistance may reach the next significant swing high at $0.1507, continue into probable resistance just above, and possibly set a new monthly high at $0.1833.

3. Cosmos (ATOM)

Cosmos ATOM bills itself as a project that solves some of the “hardest problems” facing the blockchain industry. It aims to offer an antidote to “slow, expensive, unscalable and environmentally harmful” proof-of-work protocols, like those used by Bitcoin, by offering an ecosystem of connected blockchains. ATOM tokens are earned through a hybrid proof-of-stake algorithm and they help to keep the Cosmos Hub, the project’s flagship blockchain, secure. This cryptocurrency also has a role in the network’s governance.

ATOM Price Analysis

At the time of writing, ATOM is ranked the 27th cryptocurrency globally and the current price is US$7.10. Let’s take a look at the chart below for price analysis:

Source: TradingView

ATOM has been consolidating in a range around Q1 2022’s high. Q2 2022 saw the start of a smaller range inside this larger range. Near the current price, $7.00 or $6.80 could support at least a small move upward. This area is near the local range low, inefficiently traded, and the site of a stop run.

Just above the current price, the 9, 18 and 40 EMAs might provide resistance near $7.86. This level saw consolidation before last week’s downward move.

A move back toward the local range highs could reach possible resistance near $8.65, where bears rejected the recent rally. This level is just above the May monthly open.

A more extended move by bulls might reach the larger range’s rejection area near $9.81. However, a move this far is less likely unless the overall market rallies.

Below the higher timeframe’s range, $6.75 to $6.10 could provide more substantial support to start a longer-term bullish trend. This level is near the 78.6% retracement of the July 2021 to September 2021 rally, shows inefficient trading on higher-timeframe charts, especially between $6.05 and $5.90, and provides a reasonable stop run target.

Learn How to Trade Live!

Join Dave and The Crypto Den Crew and they’ll show you live on a webinar how to take your crypto trading to the next level.

Where to Buy or Trade Altcoins?

These coins have high liquidity on Binance Exchange, so that could help with trading on AUD/USDT/BTC pairs. And if you’re looking at buying and HODLing cryptos, then Swyftx Exchange is an easy-to-use popular choice in Australia.

Categories
Crypto News IOTA Market Analysis Quant Trading TrueFi

Top 3 Coins to Watch Today: IOTA, QNT, TRU – June 30 Trading Analysis

Let’s take a closer look at today’s altcoins showing breakout signals. We’ll explain what the coin is, then dive into the trading charts and provide some analysis to help you decide.

1. IOTA (MIOTA)

IOTA is a distributed ledger with one big difference – it isn’t actually a blockchain. Instead, its proprietary technology is known as Tangle, a system of nodes that confirm transactions. The foundation behind the platform says this offers far greater speeds than conventional blockchains, and an ideal footprint for the ever-expanding Internet of Things ecosystem.

IOTA Price Analysis

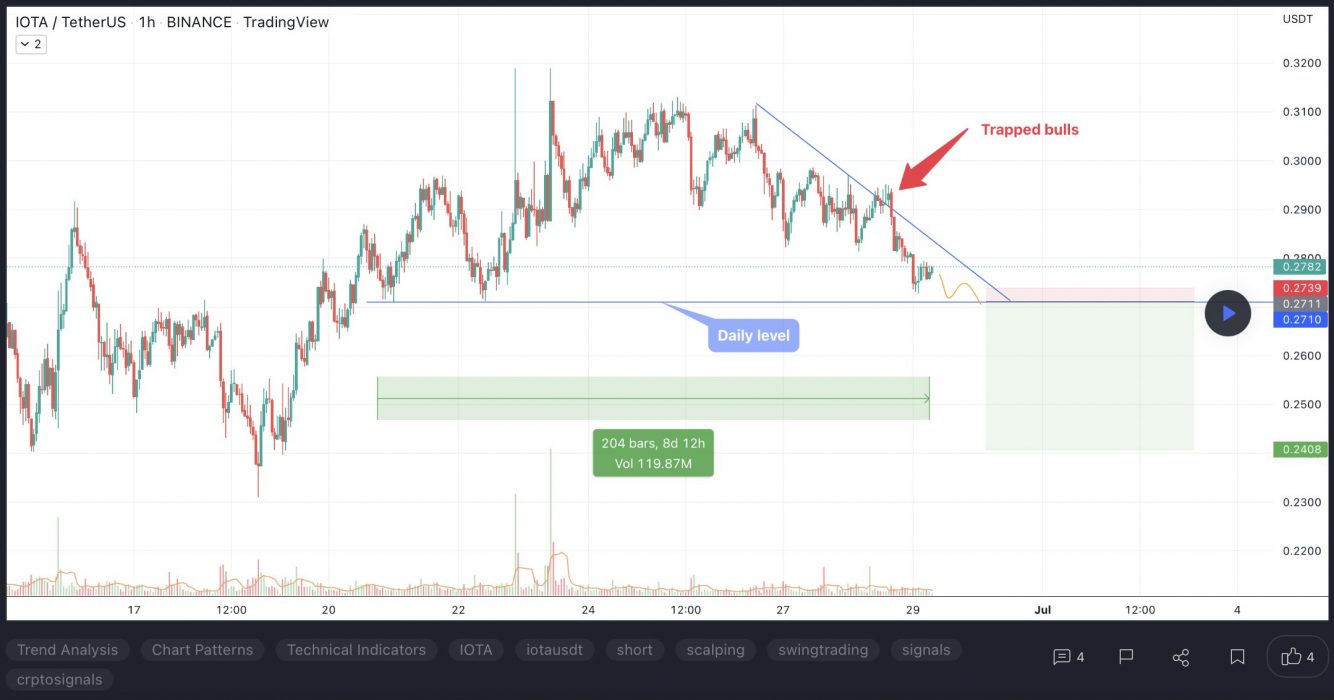
At the time of writing, IOTA is ranked the 55th cryptocurrency globally and the current price is US$0.2712. Let’s take a look at the chart below for price analysis:

Source: TradingView

After a 70% decline during Q2, IOTA has ranged between $0.2633 and $0.3503. The recent rally was approaching probable resistance near $0.4045 but could be aiming for stops above the relatively equal highs near $0.4320. Continuation of the bullish move could target the daily gap near $0.4835.

Aggressive bulls might add to positions near $0.2740 and $0.2644. Price action near $0.2460 may be more likely to provide support – if the price reaches it – during any retracements.

Relatively equal lows clustered around $0.2235 seem likely to be swept if the bearish trend resumes. If this move occurs, the price may find support at the significant higher-timeframe level near $0.1955.

2. Quant (QNT)

Quant QNT launched with the goal of connecting blockchains and networks on a global scale, without reducing the efficiency and interoperability of the network. It is the first project to solve the interoperability problem through the creation of the first blockchain operating system. The main aim of Quant – using Overledger – is to bridge the gap that exists between different blockchains. The backbone of the project is the Overledger network, which Quant bills as the ecosystem on which the future digital economy ecosystem will be built.

QNT Price Analysis

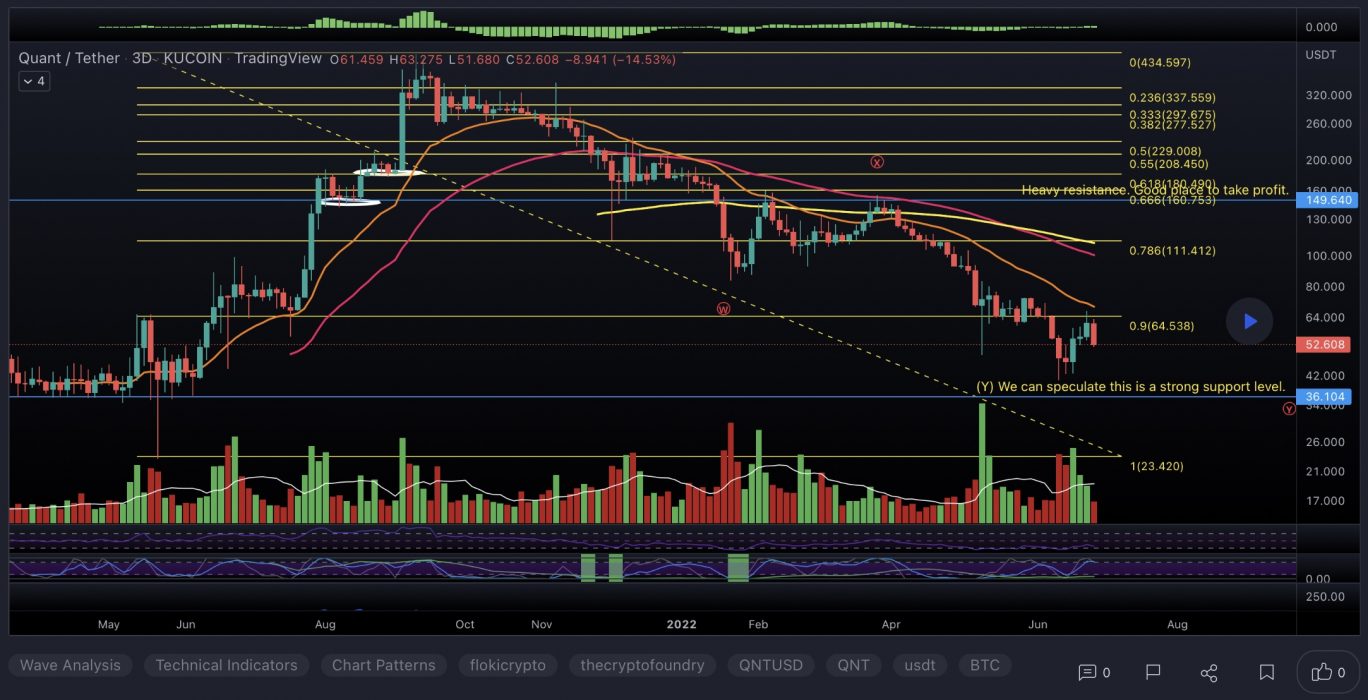
At the time of writing, QNT is ranked the 63rd cryptocurrency globally and the current price is US$53.27. Let’s take a look at the chart below for price analysis:

Source: TradingView

Q1 marked a turning point for QNT, with the price gaining almost 60% from its lows to probable resistance beginning near $146.30.

The price is currently struggling with the area between $48.80 and $60.33. This region could provide support after a close above, or resistance after a close below. 

A retracement could reach into the daily gap and possible support around $45.41. A more bearish shift in the marketplace will likely aim for the relatively equal lows near $42.65, and the potential support just below that begins around $39.34.

Continuation to the upside will likely target the monthly high near $66.19. However, probable resistance beginning at $72.77 and $80.30 could cap or slow down this move.

3. TrueFi (TRU)

TrueFi TRU is a protocol for creating interest-bearing pools with a high APR for liquidity providers. TrueFi includes utility and rewards mechanisms using TrustTokens and rewards participants for maintaining stable, high APRs. TRU is the native token of the TrueFi protocol and TrustToken holders ultimately have a say over who is a credible borrower in the prediction market. TRU gives the holder the ability to rate credit for third parties.

TRU Price Analysis

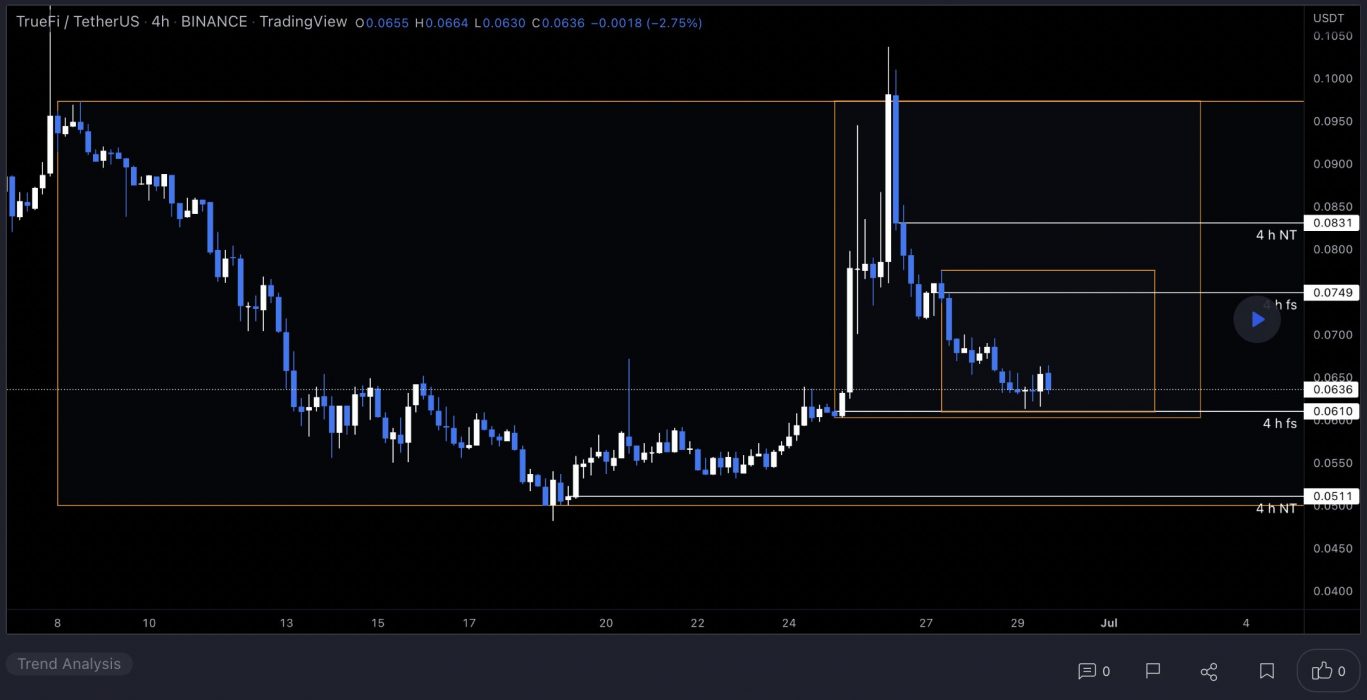
At the time of writing, TRU is ranked the 429th cryptocurrency globally and the current price is US$0.06499. Let’s take a look at the chart below for price analysis:

Source: TradingView

TRU‘s chart paints a different picture than many other altcoins, with April’s high leading to a massive range before setting a low near $0.05655 in June.

The nearly 36% spike at the beginning of June makes immediate bids questionable. However, the price may be finding support near $0.06016 and possibly near $0.05742. Since the price swept the impulse’s high at $0.07536, bulls might be waiting to enter near the swing low and gap near $0.05260, or slightly lower near $0.04790.

Little resistance lies overhead, although some resistance might exist between $0.06995 and approximately $0.07417, just above the current price. A sweep and rejection of the high near $0.08345 would make most areas of possible support highly suspect and could mark the end of the bullish trend.

Learn How to Trade Live!

Join Dave and The Crypto Den Crew and they’ll show you live on a webinar how to take your crypto trading to the next level.

Where to Buy or Trade Altcoins?

These coins have high liquidity on Binance Exchange, so that could help with trading on AUD/USDT/BTC pairs. And if you’re looking at buying and HODLing cryptos, then Swyftx Exchange is an easy-to-use popular choice in Australia.
Categories
Crypto News IOST Market Analysis Polkadot Stellar Trading

Top 3 Coins to Watch Today: XLM, IOST, DOT – June 29 Trading Analysis

Let’s take a closer look at today’s altcoins showing breakout signals. We’ll explain what the coin is, then dive into the trading charts and provide some analysis to help you decide.

1. Stellar (XLM)

Stellar XLM is an open network that allows money to be moved and stored. When it was released, the goal was boosting financial inclusion by reaching the world’s unbanked – but soon after, its priorities shifted to helping financial firms connect with one another via blockchain technology. The network’s native token, lumens, serves as a bridge that makes it less expensive to trade assets across borders. All of this aims to challenge existing payment providers who often charge high fees for a similar service.

XLM Price Analysis

At the time of writing, XLM is ranked the 24th cryptocurrency globally and the current price is US$0.1164. Let’s take a look at the chart below for price analysis:

Source: TradingView

XLM set a high near $0.2357 in Q2 before retracing nearly 70% to find a low near $0.1058. The price consolidated around this level before the strong bullish impulse over the past several days.

Probable resistance near $0.1370 is slowing the bullish advance down. However, another leg might target the last swing high at $0.1424 and relatively equal highs at $0.1550. Resistance near $0.1759 could cap the move before the second swing high. Beyond these levels, little stands in the bulls’ way before reaching the swing high near $0.1856.

A retracement before a move higher might find support in the daily gap near $0.1104, just above the weekly open. Relatively equal lows near $0.1035 could also provide support. Run-on stops at $0.0984 and $0.09174 might find support in the gap beginning near $0.08312.

2. Iost (IOST)

IOST‘s blockchain infrastructure is open-source and designed to be secure and scalable, all in the hope it will serve as the backbone for online services in the future. One of the biggest challenges IOST aims to resolve centres on how big companies may not be able to embrace blockchains in a customer-facing environment unless they are scalable. The Internet of Services Token is put forward as a way of tackling this problem.

IOST Price Analysis

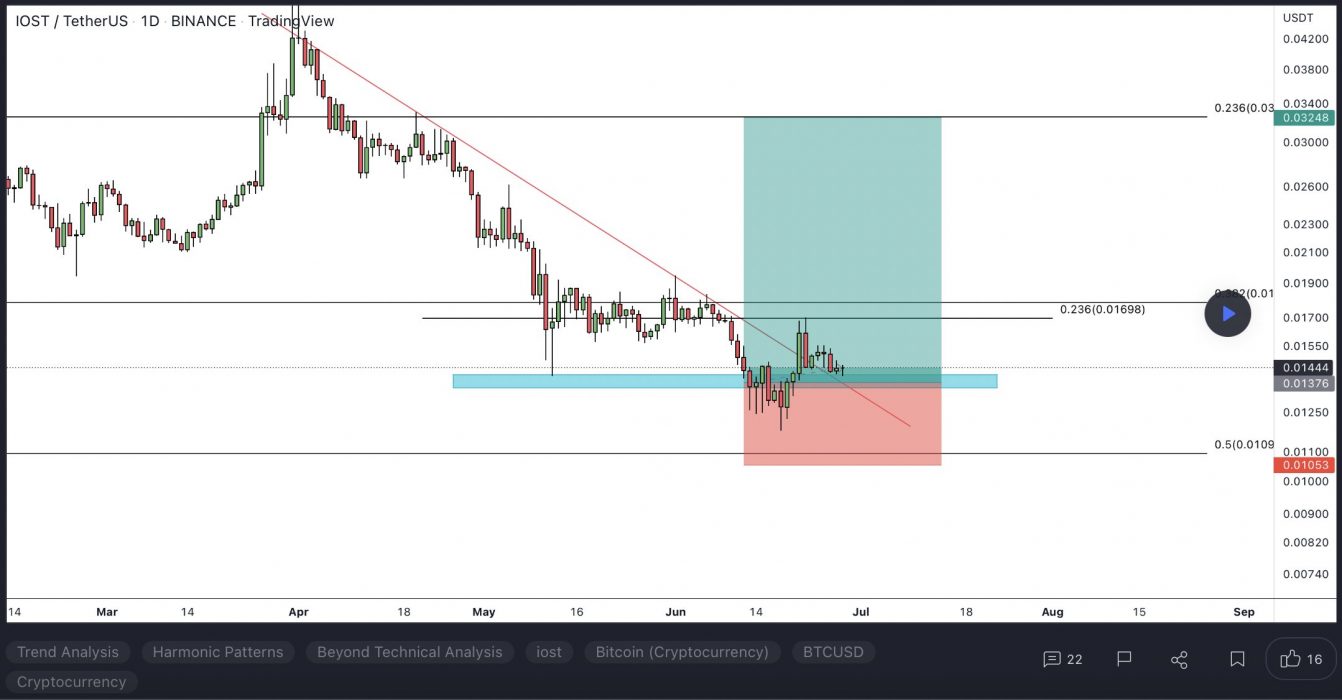
At the time of writing, IOST is ranked the 109th cryptocurrency globally and the current price is US$0.01418. Let’s take a look at the chart below for price analysis:

Source: TradingView

IOST rallied 95% during late March and almost set new monthly highs before selling off 45% into its weekly low.

A retest of the monthly open, near $0.02625, started a new wave of selling in early May. The subsequent break of the weekly open created a new area of resistance between $0.01959 and $0.01863 – an area that is also inefficiently traded and has confluence with the 9 and 18 EMAs.

If this resistance breaks, a move toward the monthly highs might find resistance between $0.02174 and $0.02270. Any potential move through this resistance will likely find a ceiling near an inefficient higher-timeframe level at $0.02730.

Old support near $0.01389 created a sharp bullish reaction in late June. This region, down to $0.01274, could provide support again. 

However, a longer-term bottom is more likely to be found between $0.01027 and $0.00963, where higher-timeframe charts show an inefficiently traded area.

3. Polkadot (DOT)

Polkadot DOT is an open-source sharding multichain protocol that facilitates the cross-chain transfer of any data or asset types, not just tokens, thereby making a wide range of blockchains interoperable with each other. Polkadot’s native DOT token serves three clear purposes: providing network governance and operations, and creating parachains by bonding. The Polkadot protocol connects public and private chains, permissionless networks, oracles and future technologies, allowing these independent blockchains to trustlessly share information and transactions through the Polkadot relay chain.

DOT Price Analysis

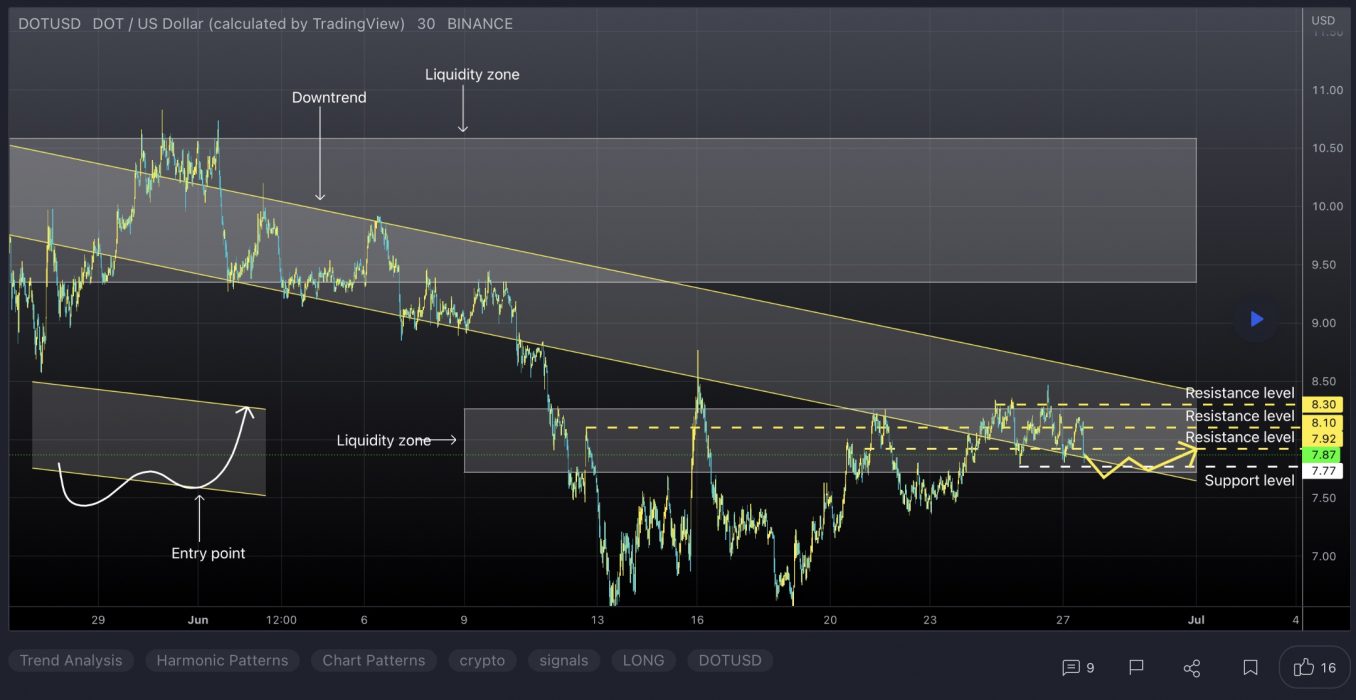
At the time of writing, DOT is ranked the 11th cryptocurrency globally and the current price is US$7.61. Let’s take a look at the chart below for price analysis:

Source: TradingView

DOT has retraced nearly 70% after Q2, showing little sign of interest from buyers.

June’s consolidation at possible support from $9.85 to $7.10 broke down with the rest of the market last month, turning this into likely resistance on future retests. This area now has confluence with the 9 and 18 EMAs.

If market conditions turn and this resistance breaks, an area near the midpoint of Q2 consolidation range, near $8.70, and the monthly high near $10.58 may see profit-taking from bulls.

The first test of possible support near $7.10 has showed some sensitivity. Still, continued bearishness in the market will likely cause a break of this level.

A break of this support might continue to drop to the next possible support near $6.80, running stops under the Q3 2021 swing low. If this level gives support and begins a consolidation forming a bottom, bulls might wait for a wick below to possible support from $6.15 to $5.70.

Learn How to Trade Live!

Join Dave and The Crypto Den Crew and they’ll show you live on a webinar how to take your crypto trading to the next level.

Where to Buy or Trade Altcoins?

These coins have high liquidity on Binance Exchange, so that could help with trading on AUD/USDT/BTC pairs. And if you’re looking at buying and HODLing cryptos, then Swyftx Exchange is an easy-to-use popular choice in Australia.
Categories
Crypto News Ergo Market Analysis MyNeighborAlice Trading Waves

Top 3 Coins to Watch Today: ALICE, ERG, WAVES – June 28 Trading Analysis

Let’s take a closer look at today’s altcoins showing breakout signals. We’ll explain what the coin is, then dive into the trading charts and provide some analysis to help you decide.

1. MyNeighborAlice (ALICE)

ALICE is a multiplayer builder game where anyone can buy and own virtual islands, collect and build exciting items, and meet new friends. Inspired by successful games such as Animal Crossing, the game combines the best of the two worlds – a fun narrative for regular players who want to enjoy the gameplay experience, as well as an ecosystem for players who want to collect and trade non-fungible tokens (NFTs).

ALICE Price Analysis

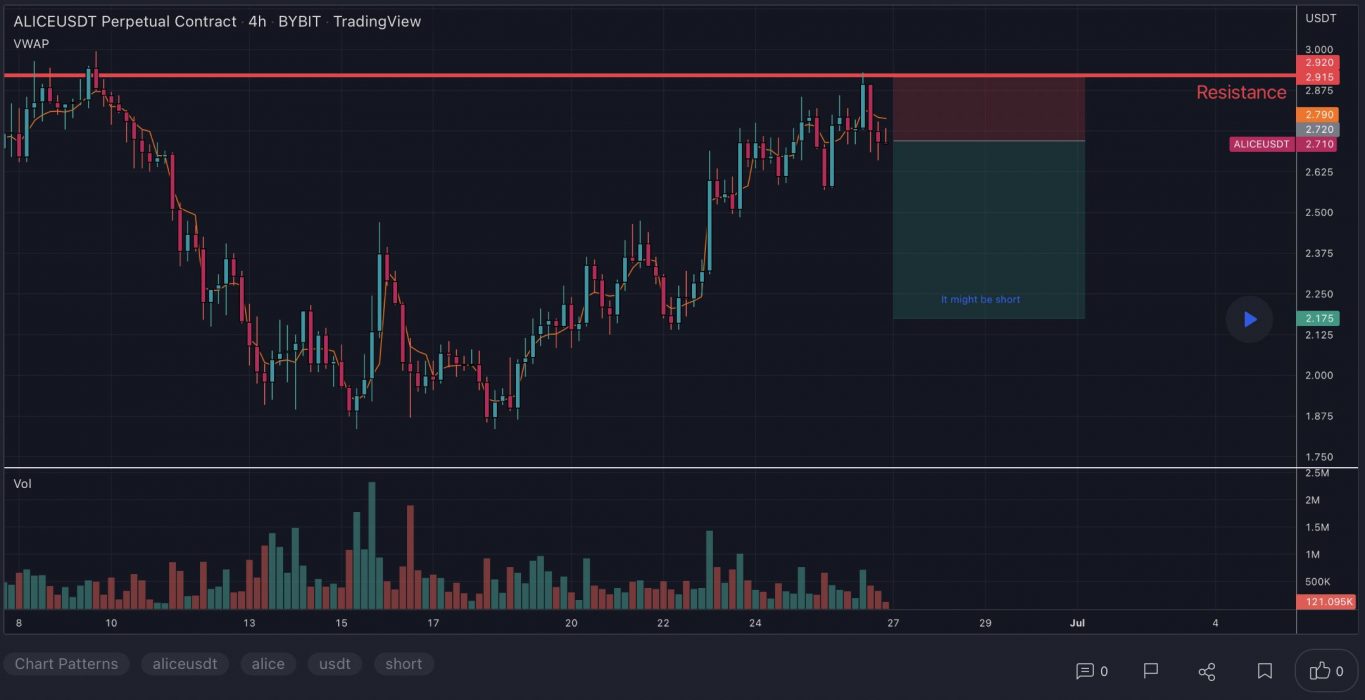
At the time of writing, ALICE is ranked the 280th cryptocurrency globally and the current price is US$2.570. Let’s take a look at the chart below for price analysis:

Source: TradingView

ALICE dropped almost 79% from its April high to a mid-May low. Since this drop, the price has consolidated in a tight range between approximately $3.330 and $1.845.

Support may have formed near $2.571. This area shows inefficient trading on the daily chart. It also overlaps June 15’s swing high and contains the 9 and 18 EMAs.

If this level breaks, the price might also find support at a small distance below, near $2.169. Here, the weekly chart shows that bulls rejected bears.

The 40 EMA is currently providing some resistance. Yet the price may be seeking the next resistance near $3.00. This level is near the top of the range, contains relative equal highs, and is just below the June monthly open.

A break through this level might reach the next resistance near $3.330. This level is just above relative equal highs and the June monthly open. It also shows inefficient trading on the weekly chart and overlaps with the June 2021 swing low’s wick.

If the rally continues, $3.804 could provide the next resistance. This level shows inefficient trading on the weekly and monthly charts. It also overlaps with June 2021’s weekly and monthly swing low candle body boundaries.

The overall market is still bearish, so bulls should be cautious. There is no historical price action to suggest support below the current price. The local range’s 50% extension suggests that $1.250 to $1.00 could be the next longer-term downside target.

2. Ergo (ERG)

The Ergo ERG platform aims to provide an efficient, secure and easy way to implement financial contracts that will be useful and survivable in the long term. Ergo describes itself as a self-amendable protocol that reportedly allows it to absorb new ideas and improve itself in a decentralised manner. It is a project that boasts a programmable blockchain with an energy-efficient and stable mining protocol.

ERG Price Analysis

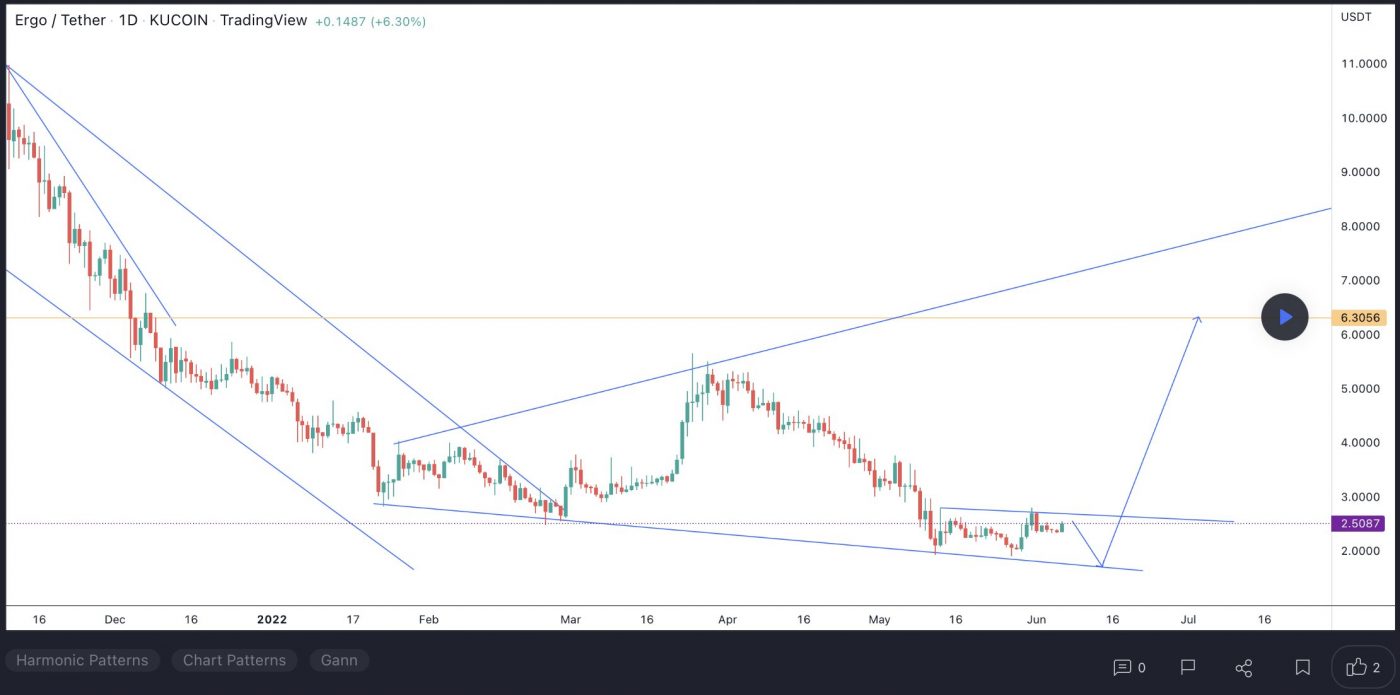
At the time of writing, ERG is ranked the 315th cryptocurrency globally and the current price is US$1.97. Let’s take a look at the chart below for price analysis:

Source: TradingView

ERG‘s price has dropped almost 67% from its late-March high to its mid-June low, and has been consolidating in a tight range since.

The price is now testing possible support near $2.050. This level is at the May swing lows and in the upper half of the local consolidation range. It also contains the 9 and 18 EMAs.

If the price does rally, the next resistance may be at $2.2657. This level contains the 40 EMA. It also shows inefficient trading and is at the bottom of early June’s consolidation on the daily chart. A rally this high would fill a pocket of inefficient trading on the weekly chart.

A more substantial rally could reach up to $2.7272. This move would run bears’ stops above late May and early June’s swing highs. In this area, the monthly and weekly charts show inefficient trading. It also overlaps with a swing low from February 2022.

Bulls should be careful since market conditions are still bearish. If the price breaks the closest support, it might reach the next possible support between $1.680 and $1.4950.

A move this low would run bulls’ stops under a mid-March 2021 weekly swing low. Under this low, bears might take profits in the area of inefficient trading on the monthly chart.

3. Waves (WAVES)

WAVES is a multi-purpose blockchain platform that supports various use cases, including decentralised applications (DApps) and smart contracts. The platform has undergone various changes and added new spin-off features to build on its original design. Waves’ native token is WAVES, an uncapped supply token used for standard payments such as block rewards. Waves initially set out to improve on the first blockchain platforms by increasing speed, utility, and user-friendliness.

WAVES Price Analysis

At the time of writing, WAVES is ranked the 66th cryptocurrency globally and the current price is US$5.92. Let’s take a look at the chart below for price analysis:

Source: TradingView

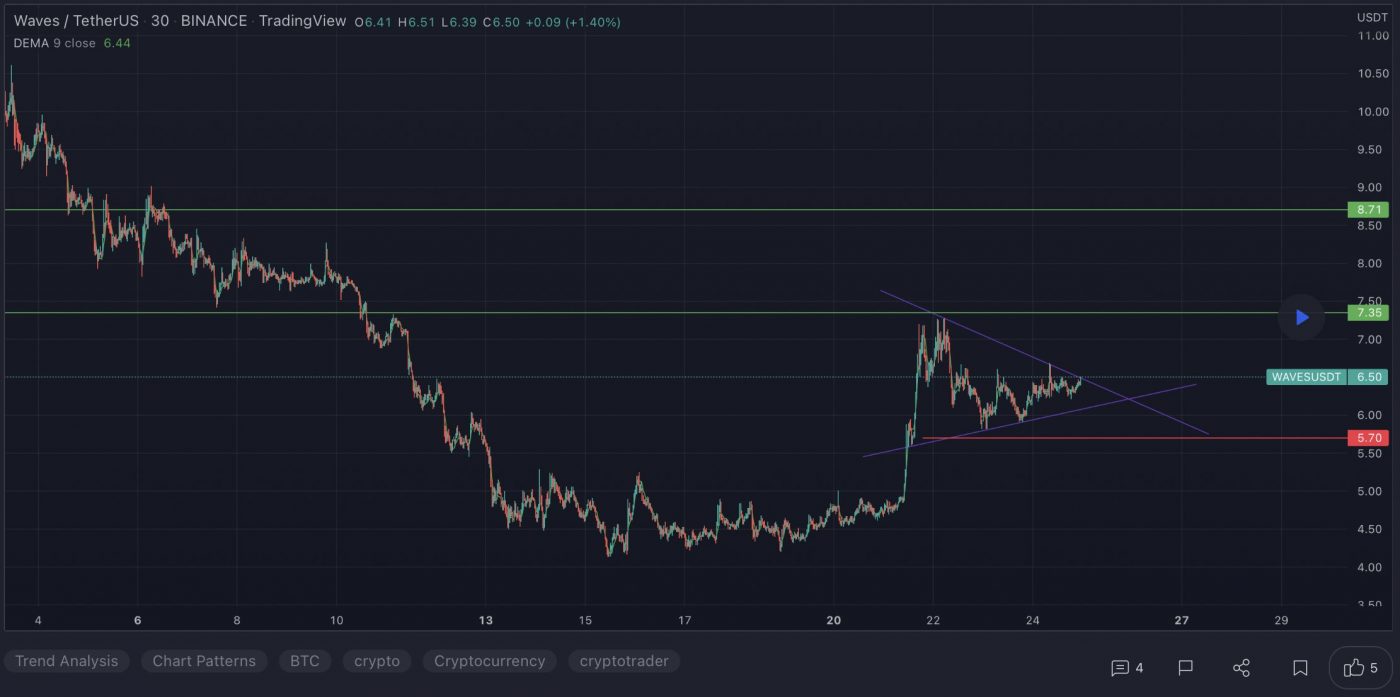
WAVES has dropped almost 96% from its late-March high and over 64% from its early June high. The price is now rallying toward the middle of its local range.

Bulls might find their first support between $5.82 and $5.01. This area shows inefficient trading on the daily chart inside June 21’s strong bullish impulse. It’s also just below the 9 and 18 EMAs.

The price may be seeking probable resistance near $7.97. This level shows consolidation on the daily chart over the current range’s midpoint. Weekly candle bodies also show that bears rejected bulls near January’s swing lows around this area.

This potential rally could continue over the June monthly open to $9.12. Candle bodies on the weekly and monthly charts show that bulls rejected bears at this level in late January. This area also shows inefficient trading on the weekly chart, which may need a revisit.

Yet relative equal lows near $4.13 offer a very tempting target for bears. The price could find some support under these lows, down to $3.75. This area shows inefficient trading on the weekly and monthly charts. It’s also near the high of September 2020’s consolidation.

A longer bearish move may continue through these possible supports to a zone from $2.57 to $1.80. If the price moves this low, it might be targeting bulls’ stops below weekly swing lows near $2.00. The bottom of this zone also shows inefficient trading on the monthly chart.

Learn How to Trade Live!

Join Dave and The Crypto Den Crew and they’ll show you live on a webinar how to take your crypto trading to the next level.

Where to Buy or Trade Altcoins?

These coins have high liquidity on Binance Exchange, so that could help with trading on AUD/USDT/BTC pairs. And if you’re looking at buying and HODLing cryptos, then Swyftx Exchange is an easy-to-use popular choice in Australia.
Categories
Basic Attention Token Crypto News Market Analysis Orion Protocol Trading Zilliqa

Top 3 Coins to Watch Today: BAT, ORN, ZIL – June 27 Trading Analysis

Let’s take a closer look at today’s altcoins showing breakout signals. We’ll explain what the coin is, then dive into the trading charts and provide some analysis to help you decide.

Basic Attention Token BAT is the token that powers a new blockchain-based digital advertising platform designed to fairly reward users for their attention while providing advertisers with a better return on their ad spend. The Basic Attention Token itself is the unit of reward in this advertising ecosystem and is exchanged between advertisers, publishers and users. Advertisers pay for their advertising campaigns in BAT tokens. Out of this budget, a small portion is distributed to advertisers, while 70% is distributed to users – whereas the intermediaries that typically drive up advertising costs are cut out of the equation to improve cost-efficiency.

At the time of writing, BAT is ranked the 68th cryptocurrency globally and the current price is US$0.4032. Let’s take a look at the chart below for price analysis:

Source: TradingView

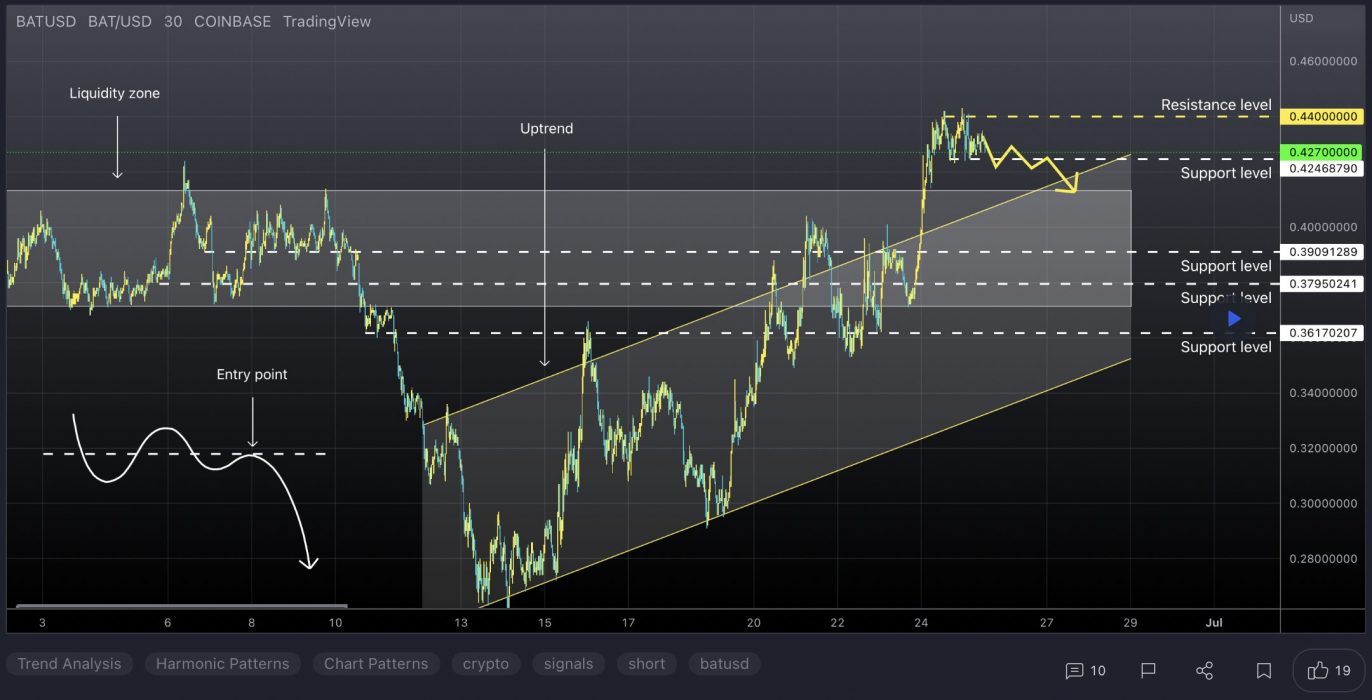
BAT has dropped nearly 70% from its Q2 2022 high and 82% from its November 2021 all-time high.

Support might have formed last week from $0.3834 to $0.3565 and should hold if bulls are ready for a bounce. This zone overlaps with an inefficiently traded area on the weekly chart from $0.3763 to $0.3294.

If this level breaks, bears might target an inefficiently traded area on the monthly chart from $0.3047 to $0.2732. Below this level, $0.2545 to $0.2380 could provide support after a run on bulls’ stops under the Q4 2020 lows into an area of significant accumulation.

The closest resistance begins near $0.4583. This level has confluence with the 9 EMA and a brief consolidation before May 11’s spike downward.

A more significant rally might find resistance near $0.5140. This level is inefficiently traded and has confluence with the lows of last summer’s accumulation and the 18 EMA.

If the market becomes more bullish, $0.6146 may provide the next resistance. This level is slightly above the May monthly open, overlaps with multiple old lows and aligns with the 40 EMA.

2. Orion Protocol (ORN)

Orion ORN aims to solve the difficulties in performing profitable transactions associated with the lack of liquidity on the majority of crypto exchanges. This is the case for both centralised and decentralised exchanges. Orion’s solution to this is to aggregate exchanges’ order books into one simple-to-use-and-understand terminal. The Orion Protocol’s goal is to help users get the best returns out of their investments while also lowering the risks associated with using multiple exchanges.

ORN Price Analysis

At the time of writing, ORN is ranked the 397th cryptocurrency globally and the current price is US$1.30. Let’s take a look at the chart below for price analysis:

Source: TradingView

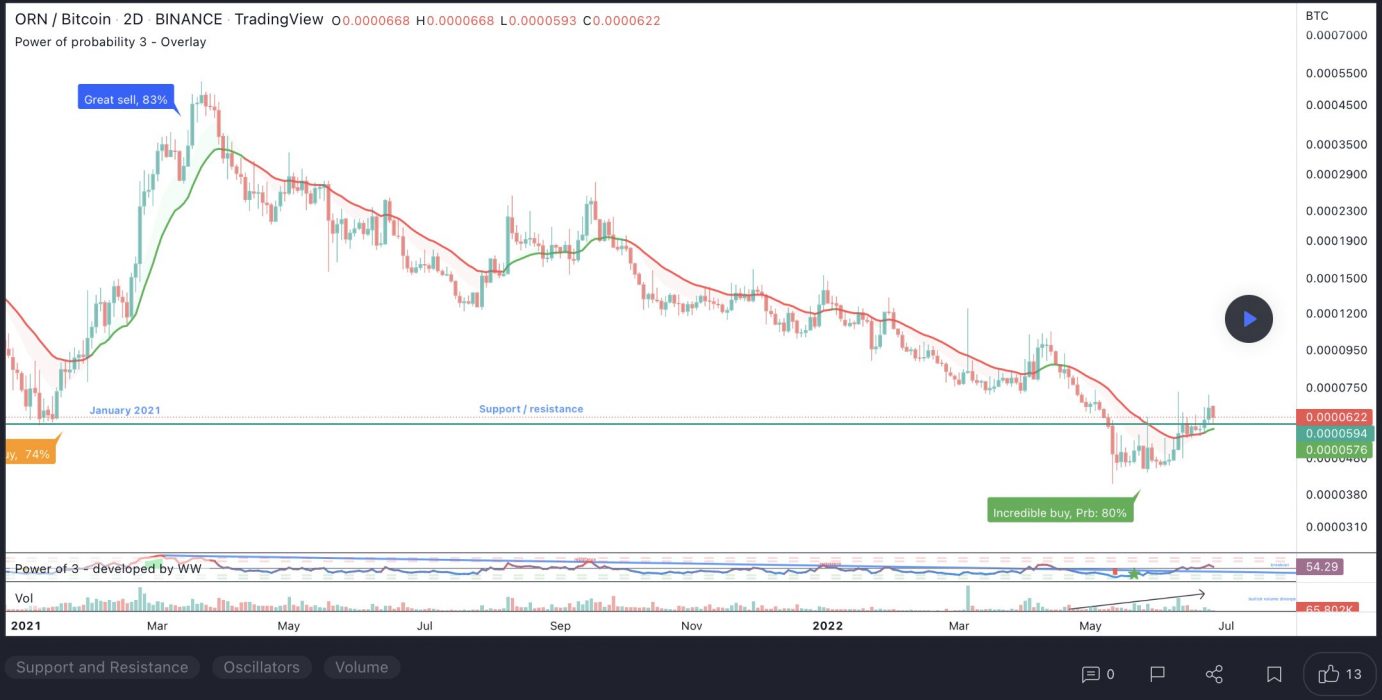
After a 75% retracement from its April highs, ORN found a temporary low near $1.20. A recent move above $1.49 could be the first sign of a bullish shift – but could also signal a stop run before the next drop lower. 

If the market adopts a more bullish tone, the price could run through the most recent swing high. If this bounce occurs, it would likely find some resistance near $1.63, possibly reaching up to $1.85.

However, a move below the closest support near $1.25 makes stop runs on the swing lows near $1.21 and $1.18 likely. A confluence of several levels near $1.16 could provide a temporary bounce. Still, a sustained bearish market will likely target $1.12 and even $1.00.

3. Zilliqa (ZIL)

Zilliqa ZIL is a public, permissionless blockchain designed to offer high throughput with the ability to complete thousands of transactions per second. It seeks to solve the issue of blockchain scalability and speed by employing sharding as a second-layer scaling solution. The platform is home to many decentralised applications, and it also allows for staking and yield farming. The native utility token of Zilliqa, ZIL, is used to process transactions on the network and execute smart contracts.

ZIL Price Analysis

At the time of writing, ZIL is ranked the 67th cryptocurrency globally and the current price is US$0.04687. Let’s take a look at the chart below for price analysis:

Source: TradingView

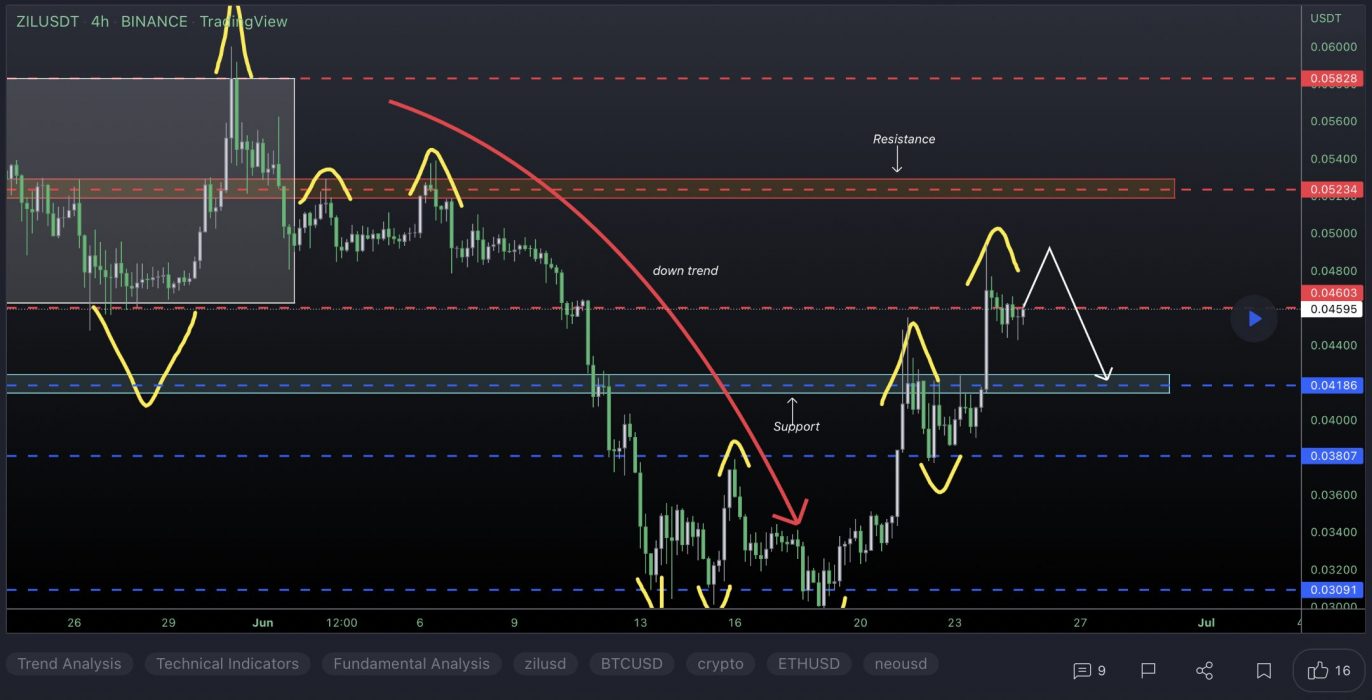
ZIL‘s 85% drop found a low near $0.03368 before closing over a weekly high around $0.04682. This daily close over the high could signal a shift in market structure that might reach probable resistance near $0.06032.

A sustained bullish move may target the swing high at $0.05860. If this stop run occurs, a run beyond the high into probable resistance near $0.06384 and $0.06645 is possible.

Bulls could buy a retracement to possible support near $0.04258, just above the weekly open. A bearish turn in the marketplace may propel the price toward possible support near $0.03926. 

However, relatively equal lows near $0.03714 and $0.03524 provide an attractive target for bears if the market resumes its bearish trend. A run on these lows might find support between $0.03315 and $0.03069.

Learn How to Trade Live!

Join Dave and The Crypto Den Crew and they’ll show you live on a webinar how to take your crypto trading to the next level.

Where to Buy or Trade Altcoins?

These coins have high liquidity on Binance Exchange, so that could help with trading on AUD/USDT/BTC pairs. And if you’re looking at buying and HODLing cryptos, then Swyftx Exchange is an easy-to-use popular choice in Australia.
Categories
Compound Crypto News Kucoin Market Analysis NEAR Protocol Trading

Top 3 Coins to Watch Today: KCS, NEAR, COMP – June 23 Trading Analysis

Let’s take a closer look at today’s altcoins showing breakout signals. We’ll explain what the coin is, then dive into the trading charts and provide some analysis to help you decide.

1. KuCoin Token (KCS)

KCS is the native token of KuCoin, launched in 2017 as a profit-sharing token that allows traders to draw value from the exchange. It was issued as an ERC-20 token running on the Ethereum network and was supported by most Ethereum wallets. The total supply of KCS was set at 200 million, and there is a planned buyback and burn until just 100 million KCS remain. Sooner or later, as the KuCoin decentralised trading solution goes live, KCS will be the native asset of KuCoin’s decentralised financial services as well as the governance token of the KuCoin community in the future.

KCS Price Analysis

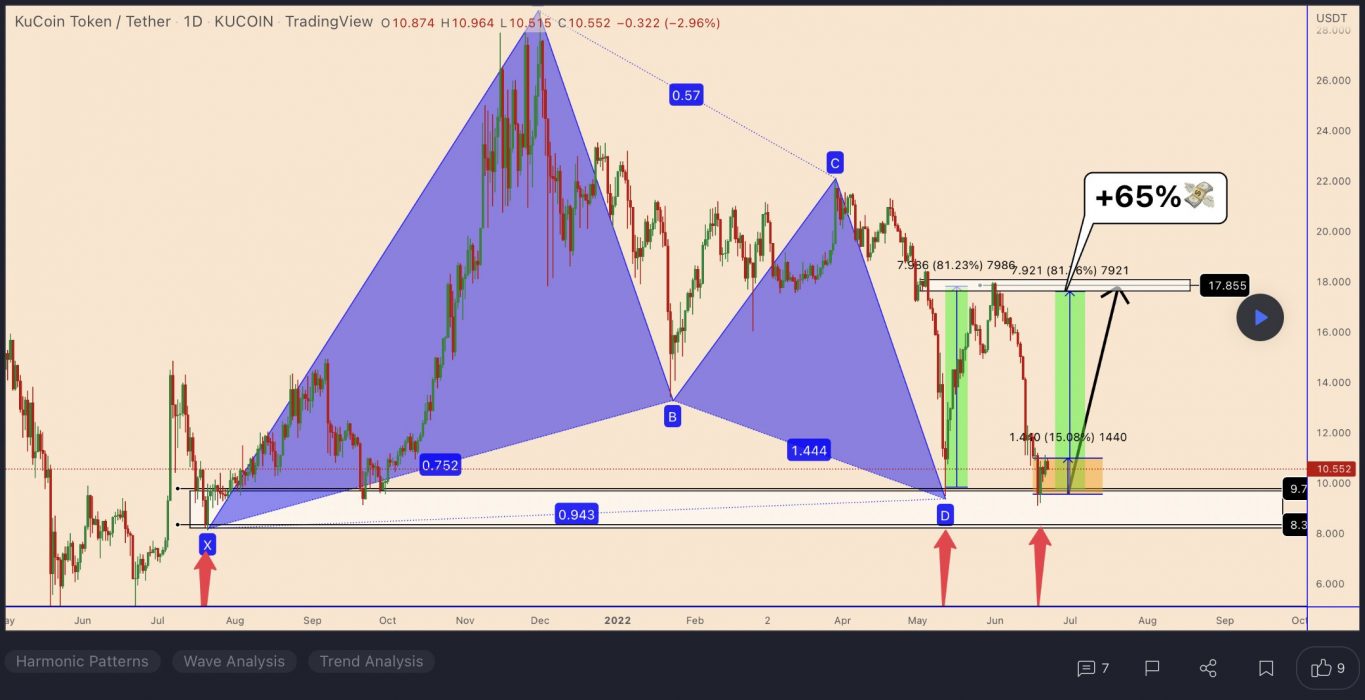
At the time of writing, KCS is ranked the 46th cryptocurrency globally and the current price is US$10.53. Let’s take a look at the chart below for price analysis:

Source: TradingView

KCS has been trading through a massive range during Q2, with the price showing mild bullishness from last week.

Bulls bought near $9.50. The weekly level and daily gap near $10.23 could prompt buyers to step in again as the price challenges the swing high and resistance around $13.50. A strong move and acceptance above this level may reach for the swing highs at $14.75 and $15.66, which mark another area of resistance.

However, rejection from the current area may send the price down to retest support near $10.00. Relatively equal lows around $9.78 provide a rich target for a stop run. Sustained bearishness may reach the low near $8.90 and possibly as low as $7.14 into higher-timeframe support.

2. Near Protocol (NEAR)

NEAR Protocol is a decentralised application platform designed to make apps usable on the web. The network runs on a Proof-of-Stake (PoS) consensus mechanism called Nightshade, which aims to offer scalability and stable fees. NEAR uses human-readable account names, unlike the cryptographic wallet addresses common to Ethereum. NEAR also introduces unique solutions to scaling problems and has its own consensus mechanism, called “Doomslug”.

NEAR Price Analysis

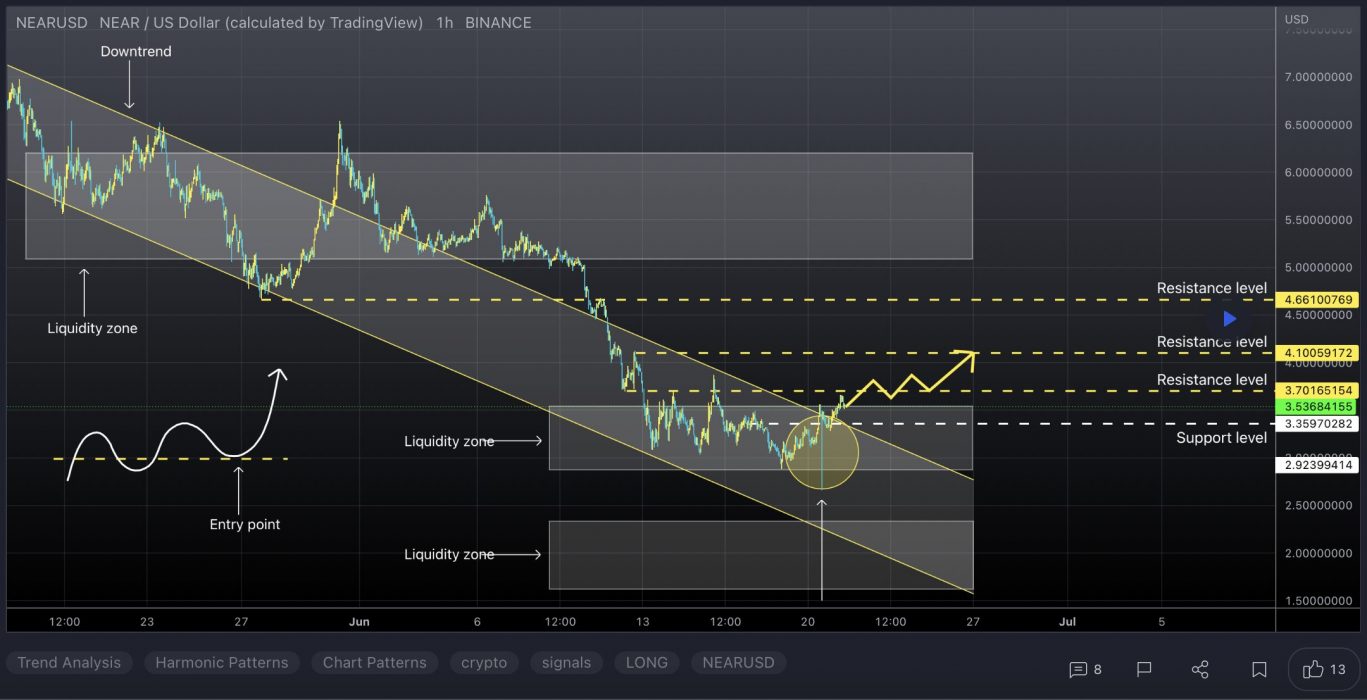
At the time of writing, NEAR is ranked the 25th cryptocurrency globally and the current price is US$3.36. Let’s take a look at the chart below for price analysis:

Source: TradingView

During Q2, NEAR has retraced 70% from its highs to support at the retracement of around $3.10.

The price shifted market structure to run to the consolidation lows near $3.40, just under the monthly open. A continued bearish trend in the market may create support just below, between $3.00 and $2.70.  

On the other hand, if the current resistance breaks, the price might find resistance near $4.83 and $5.14, whereas mid-Q2 buyers may still be trapped in longs.

3. Compound (COMP)

Compound COMP is a DeFi lending protocol that allows users to earn interest on their cryptocurrencies by depositing them into one of several pools supported by the platform. When a user deposits tokens to a Compound pool, they receive cTokens in return. These cTokens represent the individual’s stake in the pool and can be used to redeem the underlying cryptocurrency initially deposited into the pool at any time. These COMP tokens can be bought from third-party exchanges or can be earned by interacting with the Compound protocol, such as by depositing assets or taking out a loan.

COMP Price Analysis

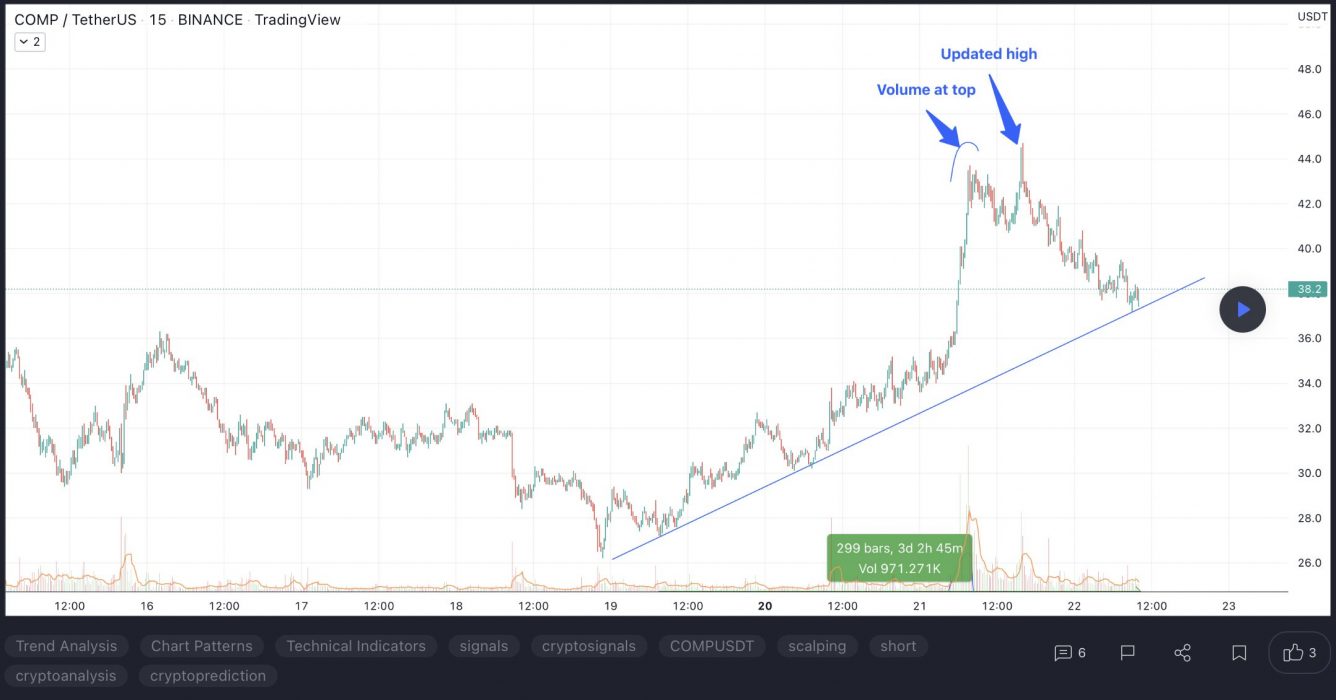
At the time of writing, COMP is ranked the 99th cryptocurrency globally and the current price is US$39.29. Let’s take a look at the chart below for price analysis:

Source: TradingView

After rallying over 55% from its Q1 low, COMP is encountering resistance near $57.43.

This resistance and the monthly open at $40.13 currently have the price trapped. The swing high and resistance near $49.27 provide a likely target before any major bearish market shift, with continuation through this resistance possibly reaching for short stops and resistance near $62.55.

The daily gap at $35.12 could provide support, while the area beginning near $30.49 could see more substantial interest from the bulls. A longer-term bearish shift in the marketplace will likely reach the relatively equal lows near $28.48, possibly finding a floor at possible support beginning near $24.71.

Learn How to Trade Live!

Join Dave and The Crypto Den Crew and they’ll show you live on a webinar how to take your crypto trading to the next level.

Where to Buy or Trade Altcoins?

These coins have high liquidity on Binance Exchange, so that could help with trading on AUD/USDT/BTC pairs. And if you’re looking at buying and HODLing cryptos, then Swyftx Exchange is an easy-to-use popular choice in Australia.
Categories
Crypto News Harmony Horizen Market Analysis SushiSwap Trading

Top 3 Coins to Watch Today: ZEN, SUSHI, ONE – June 22 Trading Analysis

Let’s take a closer look at today’s altcoins showing breakout signals. We’ll explain what the coin is, then dive into the trading charts and provide some analysis to help you decide.

1. Horizen (ZEN)

Horizen ZEN is an interoperable blockchain system, supported by a decentralised node infrastructure. Its sidechain platform focuses on scalable data privacy, and as such enables businesses as well as developers to build private or public blockchains using the unique sidechain technology known as Zendoo. Horizen claims to be completely decentralised, fully customisable with privacy features, and supports low costs associated with building blockchains with configurable revenue models and an unlimited number of tokens and digital assets.

ZEN Price Analysis

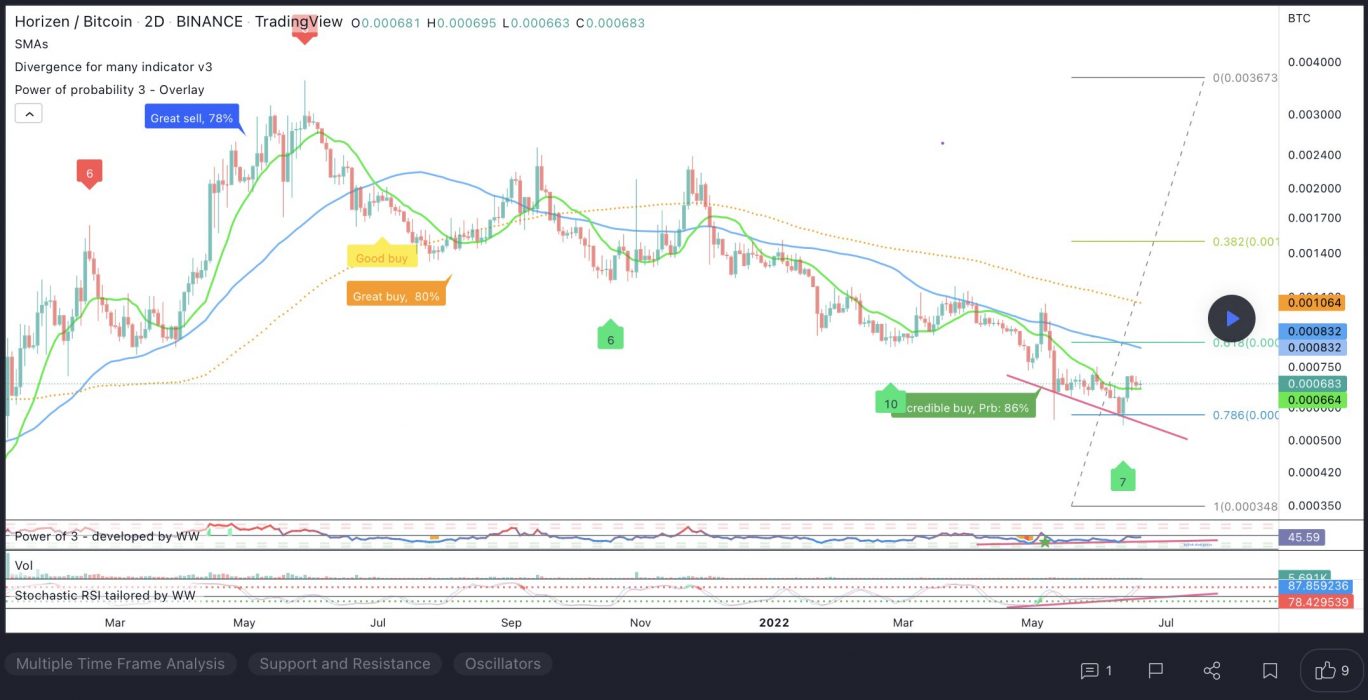
At the time of writing, ZEN is ranked the 135th cryptocurrency globally and the current price is US$14.90. Let’s take a look at the chart below for price analysis:

Source: TradingView

ZEN saw an energetic run during Q1, climbing approximately 75% before cooling off into resistance beginning near $31.85 pinned down last month’s attempt to rally, which is likely to retest possible support near $16.14.

A deeper marketwide retracement could take out the relatively equal lows below the weekly open and support near $14.23. This move may offer entries near probable support between $13.47 and $11.78.

However, more bullish market conditions may prompt a rally to the relatively equal highs near $17.67 into resistance beginning at $21.46. If the price reaches this level, the last high at $24.58 gives the next likely target before price discovery begins.

2. SushiSwap (SUSHI)

SushiSwap SUSHI is an example of an automated market maker (AMM). An increasingly popular tool among cryptocurrency users, AMMs are decentralised exchanges that use smart contracts to create markets for any given pair of tokens. SushiSwap aims to diversify the AMM market and also add features not previously present on Uniswap, such as increased rewards for network participants via its in-house token, SUSHI.

SUSHI Price Analysis

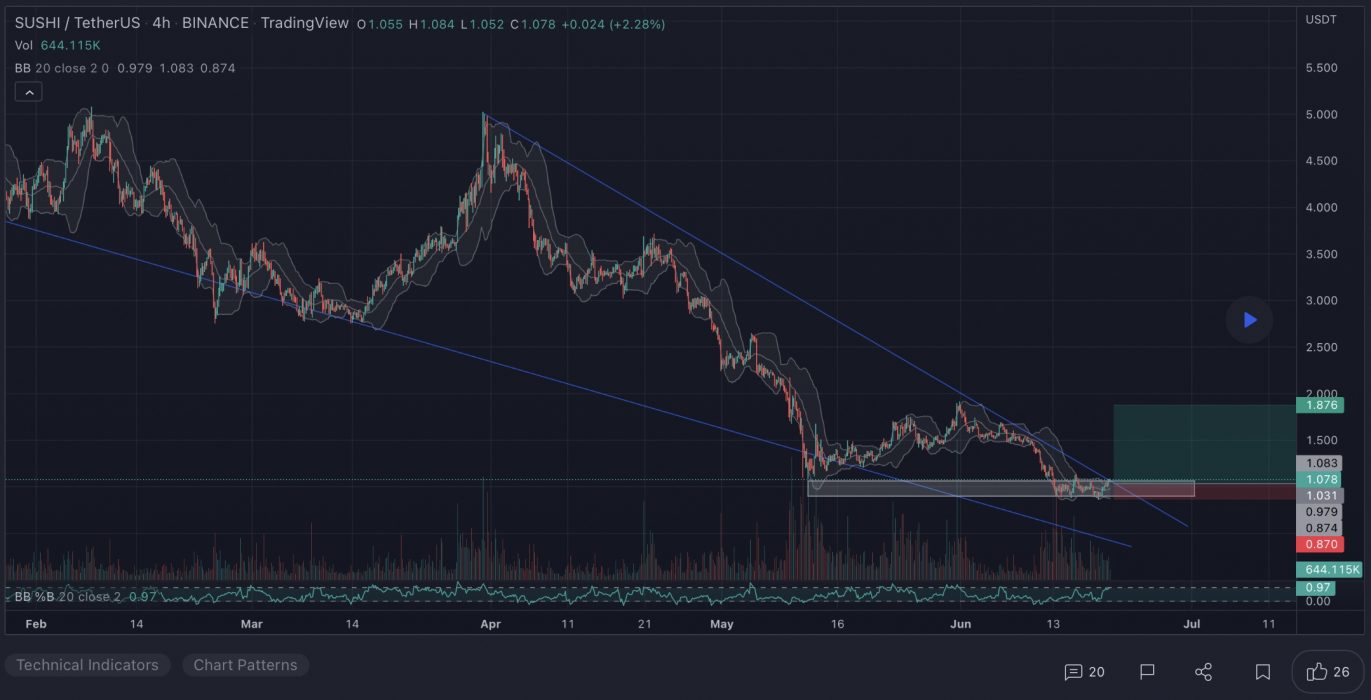
At the time of writing, SUSHI is ranked the 145th cryptocurrency globally and the current price is US$1.20. Let’s take a look at the chart below for price analysis:

Source: TradingView

After retracing nearly 80% from its Q1 highs, SUSHI set a low near $0.9210 as it formed its current range.

Last week, the price swept highs near $1.37, which now also marks the previous monthly high. Relatively equal daily highs near $1.43 provide a reasonable target, although resistance beginning near $1.55 could cap the move. A break of this resistance is likely to target the swing high near $1.64 into higher-timeframe resistance beginning near $1.72.

The current area near $1.20 could provide support, although bulls may be more likely to buy around the price fractal near $1.14 if a retracement reaches this level. A break of this area could continue down to sweep the low near $1.00 into possible support beginning near $0.8702.

3. Harmony (ONE)

Harmony ONE is a blockchain platform designed to facilitate the creation and use of decentralised applications (DApps). The network aims to innovate the way decentralised applications work by focusing on random state sharding, which allows creating blocks in seconds. Harmony was expected to introduce cross-shard contracts and a cross-chain infrastructure by the end of 2021.

ONE Price Analysis

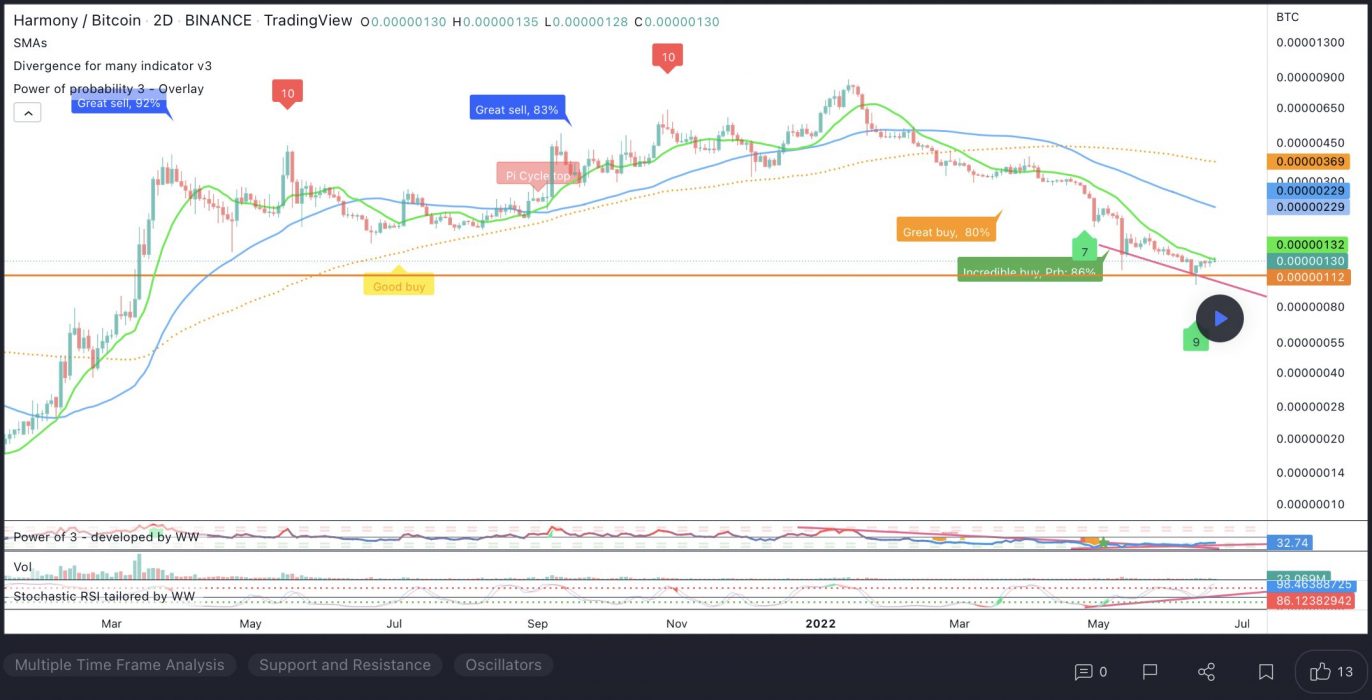
At the time of writing, ONE is ranked the 89th cryptocurrency globally and the current price is US$0.02878. Let’s take a look at the chart below for price analysis:

Source: TradingView

ONE bulls have had to endure a 79% drop since early Q2 until the price set a low and began a range in June.

Currently, the price is aggressively moving toward possible resistance, beginning near $0.03621. Stops above the swing high at $0.04135 might be the target before a downwards retracement. Multiple old lows mark this resistance, which is near the 78.6% retracement level of a recent significant bearish swing.

If the price continues through this high, it could be reaching for an inefficient area near $0.04472. Moving to this level would run bears’ stops above the swing high at the same level. A more substantial rally might reach an old swing high and inefficiently traded area between $0.04875 and $0.05038, which surrounds the yearly open.

If the price stays above Monday’s low of $0.02695, this price could support a run above the $0.02935 swing high. Just below, at $0.02554, bulls might eye the consolidation high as more substantial support. This zone contains the 9 and 40 EMAs.

A deeper retracement might retest the accumulation area between $0.02425 and $0.02280. If this level breaks, bears may be targeting an inefficiently traded area on higher timeframes beginning near $0.01980. This area overlaps the 37% extension of a recent significant bearish swing.

Learn How to Trade Live!

Join Dave and The Crypto Den Crew and they’ll show you live on a webinar how to take your crypto trading to the next level.

Where to Buy or Trade Altcoins?

These coins have high liquidity on Binance Exchange, so that could help with trading on AUD/USDT/BTC pairs. And if you’re looking at buying and HODLing cryptos, then Swyftx Exchange is an easy-to-use popular choice in Australia.

Categories
Cardano Crypto News Internet Computer Market Analysis MXC Trading

Top 3 Coins to Watch Today: ADA, ICP, MXC – June 21 Trading Analysis

Let’s take a closer look at today’s altcoins showing breakout signals. We’ll explain what the coin is, then dive into the trading charts and provide some analysis to help you decide.

1. Cardano (ADA)

Cardano ADA is a proof-of-stake blockchain platform whose stated goal is to allow “changemakers, innovators, and visionaries” to bring about positive global change. The open-source project also aims to “redistribute power from unaccountable structures to the margins to individuals”, helping to create a society that is more secure, transparent, and fair. Cardano is used by agricultural companies to track fresh produce from field to fork, while other products built on the platform allow educational credentials to be stored in a tamper-proof way, and retailers to clamp down on counterfeit goods.

ADA Price Analysis

At the time of writing, ADA is ranked the 7th cryptocurrency globally and the current price is US$0.4913. Let’s take a look at the chart below for price analysis:

Source: TradingView

From its March high to early May, ADA dropped nearly 68% before finding support near $0.4549. The price has been consolidating since it set this low and is currently testing support near $0.4549. This level has held as support despite the larger market’s sharp downturn since mid-June.

It’s reasonable to expect the price to briefly drop through this level to run bulls’ stops below the swing lows at $0.4206 and $0.4019 before any potential rally. If so, an old accumulation and inefficiently traded area on the weekly chart near $0.3972 could provide support.

If this region holds as support, bulls might find the first resistance near $0.5610. Here, the 40 EMA and an inefficiently traded area converge in the upper half of the local range. 

A break of this resistance may retest resistance just above the June monthly open, near $0.6696. This level holds many bears’ stops, is near old broken support, and is inefficiently traded on the monthly and daily charts.

However, bulls should be cautious of the bearish market conditions and a potential hardfork delay. A break of the two closest support levels could lead to a much more significant drop near $0.2288. This level, near the 2021 yearly open, is inefficiently traded on the monthly and weekly charts.

2. Internet Computer (ICP)

The Internet Computer ICP is the world’s first blockchain that runs at web speed with unbounded capacity. It also represents the third major blockchain innovation, alongside Bitcoin and Ethereum – a blockchain computer that scales smart contract computation and data, runs them at web speed, processes and stores data efficiently, and provides powerful software frameworks to developers. By making this possible, the Internet Computer enables the complete reimagination of software, providing a revolutionary new way to build tokenised internet services, pan-industry platforms, decentralised financial systems, and even traditional enterprise systems and websites.

ICP Price Analysis

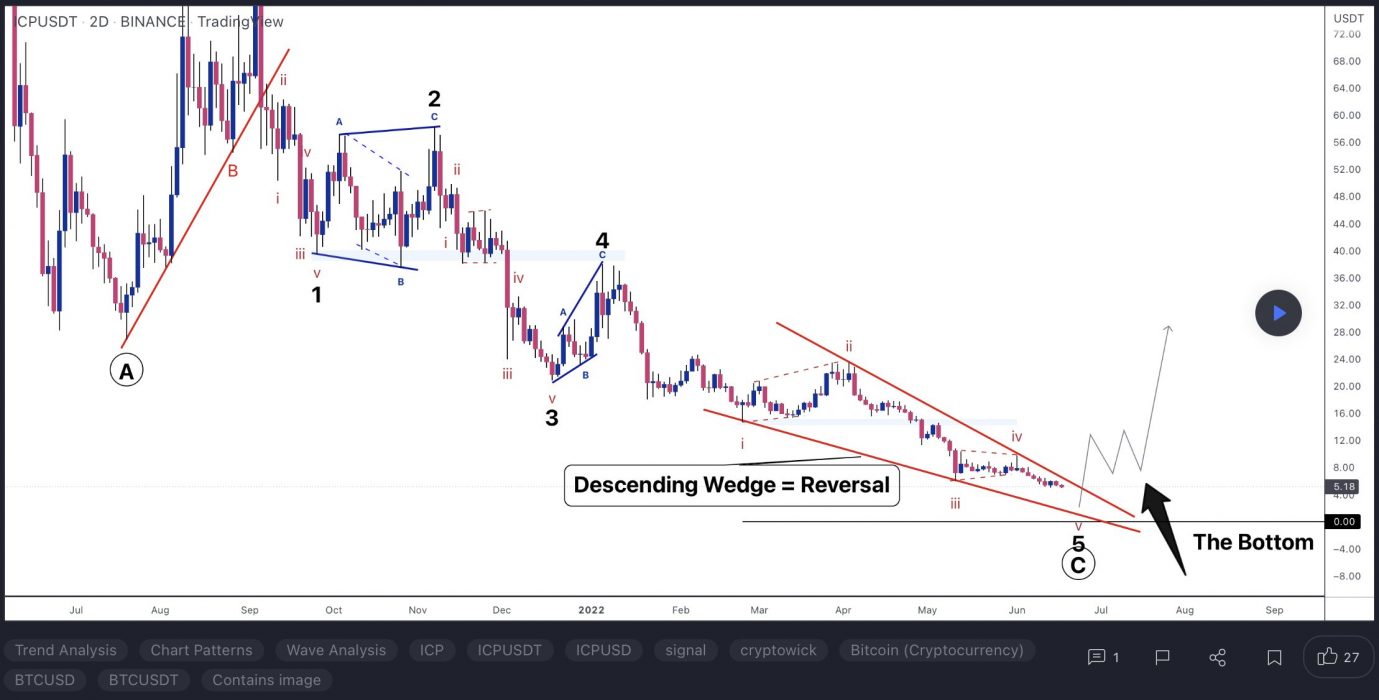
At the time of writing, ICP is ranked the 36th cryptocurrency globally and the current price is US$5.67. Let’s take a look at the chart below for price analysis:

Source: TradingView

ICP has dropped 53% from its most recent June high as it continues its nine-month downtrend.

The edge of the recent swing’s lower candle bodies could provide the closest support, near $5.15. This level overlaps with the 100% extension of June’s opening rally.

Currently, the price is testing possible resistance near $5.43. This level has confluence with the 9 EMA. It is unclear if it will hold as resistance, but it’s reasonable to anticipate a run above bears’ stops at $6.06.

If the price breaks through this resistance, it may find its next resistance near $6.59. This level is near the midpoint of May 12’s swing low and the midpoint of an inefficiently traded area on the weekly chart.

A rally this high may reach slightly higher, near $6.82. This area formed the base of the June opening rally, shows inefficient trading on the daily chart, and is at the low end of May’s accumulation range.

Below, there is no historical price action to suggest possible support. The next downside targets may be near $4.00 and $2.80. These approximate levels are near the 150% and 200% extensions of June’s opening rally.

3. Meta Connect (MXC)

Meta X Connect MXC is a utility token allowing for the increased frequency of data transactions and idiosyncratic data flows within the AI and blockchain markets. The MXProtocol ensures networks are created and connected via a decentralised and robust protocol using an interchain data market, encouraging participation via Proof of Participation (“PoP”) Mining. The mechanism also allows for the provisioning of any tangible smart Internet of Things (IoT) devices with minimal cost, creating a framework for data providers and receivers to produce their own GDPR-safe AI and blockchain NFTs.

MXC Price Analysis

At the time of writing, MXC is ranked the 132nd cryptocurrency globally and the current price is US$0.06589. Let’s take a look at the chart below for price analysis:

Source: TradingView

MXC bulls suffered a sharp 51.65% drop during the second week of May. Since then, the price has consolidated in the lower half of the range created by this drop.

A level near $0.06508 has been providing support on each recent retest. This level has confluence with the bottom of the candle bodies created in May’s significant swing low. It could continue to provide support for a run to or beyond the closest resistance.

Bulls may find their next resistance near $0.06938. Here, a recent swing high, an inefficiently traded area on the daily chart, and the 9 EMA could attract the price.

A break through this level may find its resistance in the upper half of the local range, near $0.07631. This level contains the 40 EMA and previously supported the price as it formed the base of late May and early June’s rally.

A significantly higher move could retest resistance near $0.09245. This level shows inefficient trading on the weekly and daily charts. It also provided support during March and April’s consolidation. A run to this level would sweep many bears’ stops above the swing high at $0.09245.

An eventual move below the 2022 yearly open into a zone from $0.05245 to $0.04329 is reasonable to expect. Moving to this zone would sweep bulls’ stops under two relatively equal major swing lows. This level also saw accumulation before December’s rally.

If the downtrend resumes, bears might next target possible support near $0.03428. This level is near the midpoint and lower half of 2021’s massive consolidation. It would also provide bears with a shot at bulls’ stops under the significant swing low at $0.03229. 

Learn How to Trade Live!

Join Dave and The Crypto Den Crew and they’ll show you live on a webinar how to take your crypto trading to the next level.

Where to Buy or Trade Altcoins?

These coins have high liquidity on Binance Exchange, so that could help with trading on AUD/USDT/BTC pairs. And if you’re looking at buying and HODLing cryptos, then Swyftx Exchange is an easy-to-use popular choice in Australia.