Let’s take a closer look at today’s altcoins showing breakout signals. We’ll explain what the coin is, then dive into the trading charts and provide some analysis to help you decide.
1. Cardano (ADA)
Cardano ADA is a proof-of-stake blockchain platform whose stated goal is to allow “changemakers, innovators, and visionaries” to bring about positive global change. The open-source project also aims to “redistribute power from unaccountable structures to the margins to individuals”, helping to create a society that is more secure, transparent, and fair. Cardano is used by agricultural companies to track fresh produce from field to fork, while other products built on the platform allow educational credentials to be stored in a tamper-proof way, and retailers to clamp down on counterfeit goods.
ADA Price Analysis
At the time of writing, ADA is ranked the 6th cryptocurrency globally and the current price is US$0.5774. Let’s take a look at the chart below for price analysis:
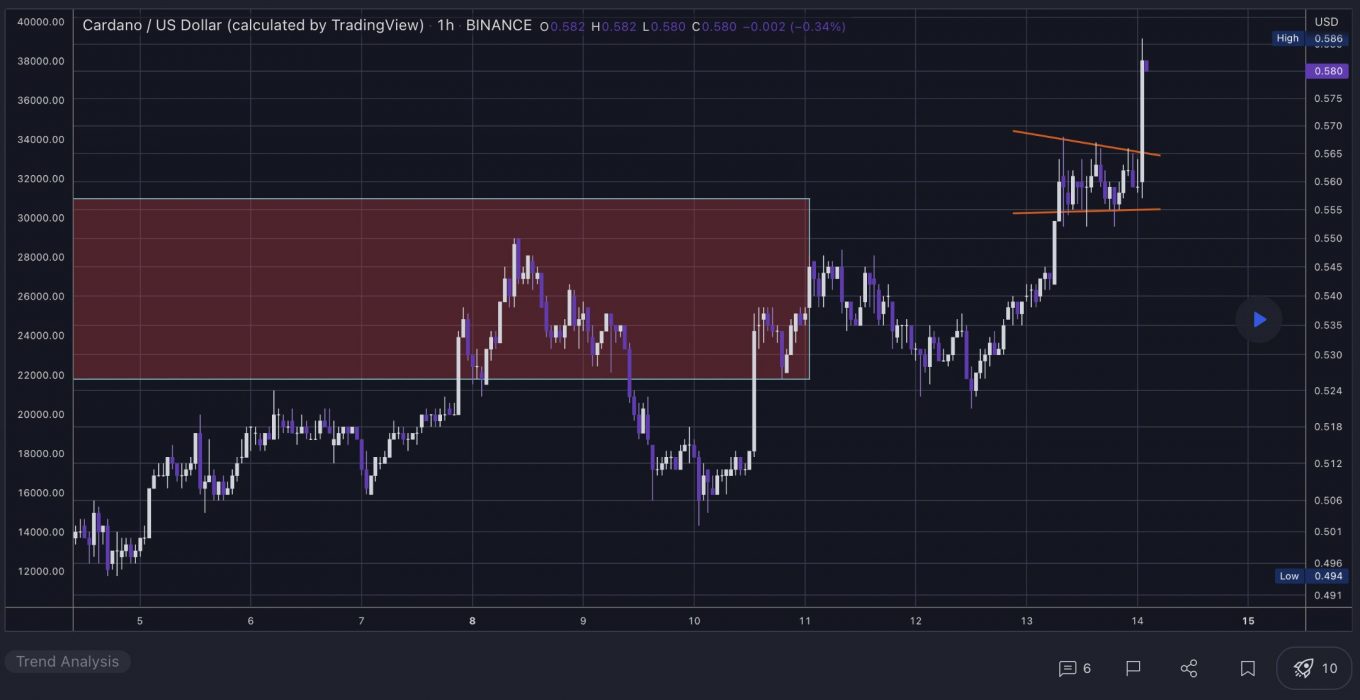
From its Q2 high, ADA dropped nearly 70% before finding support near $0.3960. The price has been consolidating since it set this low and is currently testing support near $0.4929. This level has held as support despite the larger market’s sharp downturn since mid-June.
It’s reasonable to expect the price to briefly drop through this level to run bulls’ stops below the swing lows at $0.4506 and $0.4350 before any potential rally. If so, an old accumulation and inefficiently traded area on the weekly chart near $0.4072 could provide support.
If this region holds as support, bulls may find the first resistance near $0.6510. Here, the 40 EMA and an inefficiently traded area converge in the upper half of the local range.
A break of this resistance may retest resistance just above the June monthly open, near $0.7490. This level holds many bears’ stops, is near old broken support, and is inefficiently traded on the monthly and daily charts.
2. Polygon (MATIC)
Polygon MATIC is the first well-structured, easy-to-use platform for Ethereum scaling and infrastructure development. Its core component is Polygon SDK, a modular, flexible framework that supports building multiple types of applications. The MATIC token will continue to exist and will play an increasingly important role in securing the system and enabling governance.
MATIC Price Analysis
At the time of writing, MATIC is ranked the 14th cryptocurrency globally and the current price is US$1.02. Let’s take a look at the chart below for price analysis:
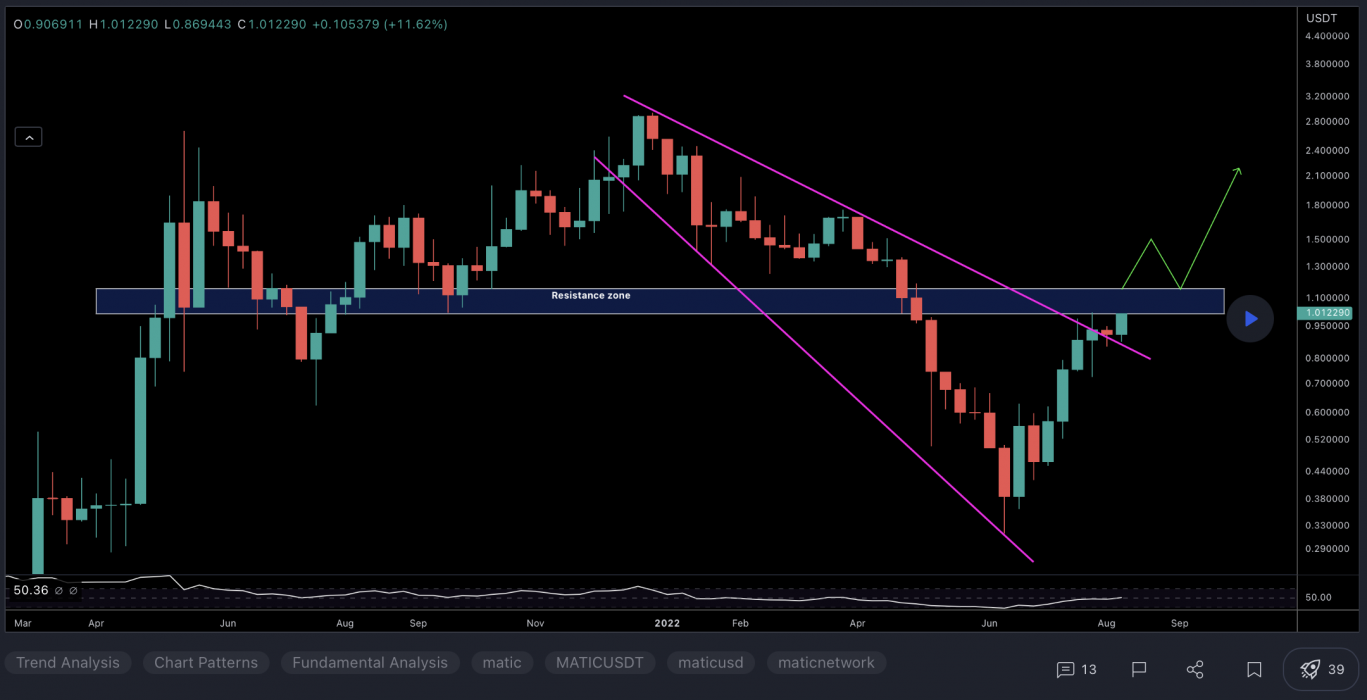
Since its Q2 highs, MATIC has been in a steady bearish trend, retracing nearly 78% and finding support near $0.4820, at the 65.8% retracement level.
Last week’s sharp impulse up might have marked the start of a new trend. If so, higher timeframes suggest that $0.9130, near the 45.8% retracement and the 9, 18 and 40 EMAs, may see interest from bulls. The price could reach lower, near $0.8520, and still find support.
Currently, the price is contesting a region between $0.8239 and $0.8025. Closes over this level could confirm it as new support, leading to a move higher.
However, bulls are contending with probable resistance near $1.15, while $1.25 is also likely to be sensitive with the nearest support and resistance this close together.
3. Kadena (KDA)
Kadena KDA is a proof-of-work blockchain that combines the PoW consensus mechanism from Bitcoin with directed acyclic graph (DAG) principles to offer a scalable version of Bitcoin. Kadena claims it can provide the security of Bitcoin while being able to offer unparalleled throughput that makes the blockchain usable to enterprises and entrepreneurs alike. Kadena’s unique infrastructure is decentralised and built for mass adoption because of its multi-chain approach.
KDA Price Analysis
At the time of writing, KDA is ranked the 104th cryptocurrency globally and the current price is US$2.14. Let’s take a look at the chart below for price analysis:
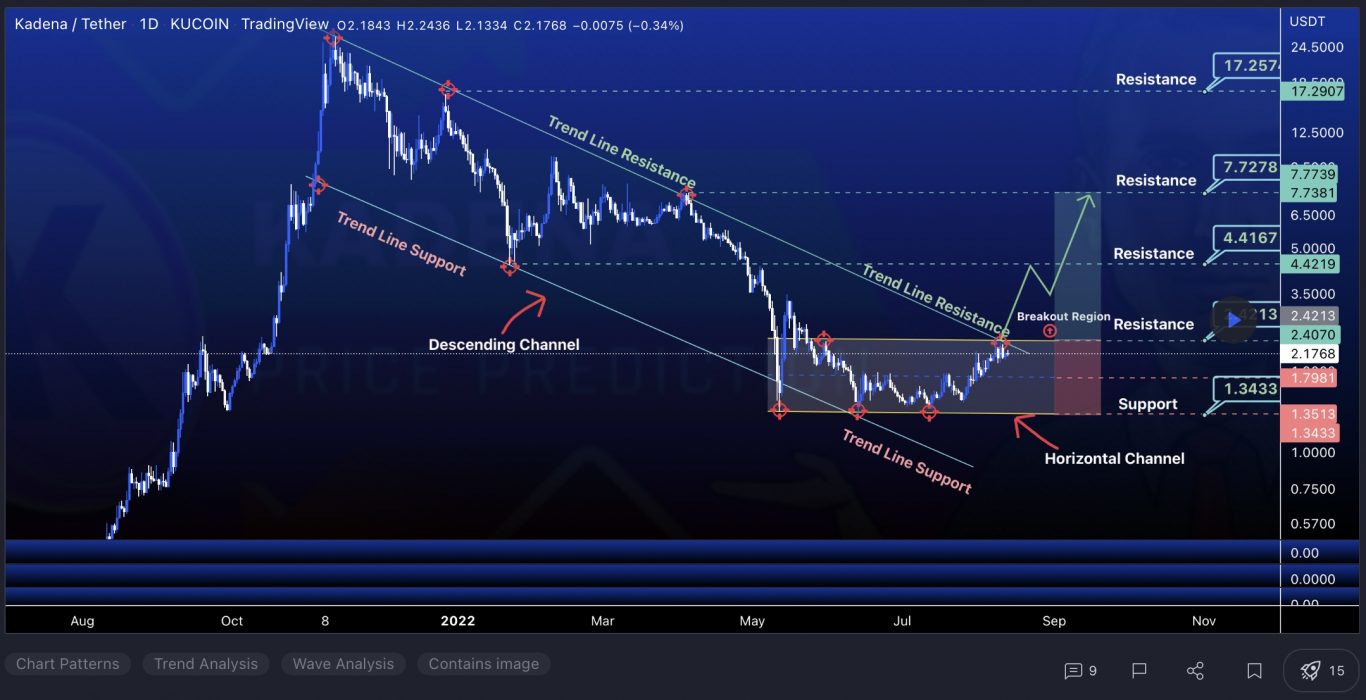
KDA climbed 60% from its mid-June low, creating a bullish market structure break on the daily chart.
Aggressive bulls might find the closest support near the August open, around $2.00. This level will likely show inefficient trading on the daily chart after Monday’s candle closes.
If this level breaks, the next support might be near $1.85. This level is near the 61.8% retracement. It’s also near the 9, 18 and 40 EMAs, and the high of accumulation on the weekly chart.
A dip lower could reach $1.78, where bulls rejected bears on the weekly. However, a move this low could go significantly lower. Bulls’ stops near $1.70 and a large area of inefficient trading on the weekly offer little support to stop a more significant drop.
The closest resistance is from $2.30 to $2.45, near the June monthly open. This area showed inefficient trading on the weekly chart. The price has passed through this zone multiple times, but it could provide some resistance again.
If the market’s rally does continue, $2.57 might offer the next resistance. This level shows inefficient trading on the daily chart. It’s also at the low end of inefficient trading on the weekly and monthly charts.
Learn How to Trade Live!
Join Dave and The Crypto Den Crew and they’ll show you live on a webinar how to take your crypto trading to the next level.

Where to Buy or Trade Altcoins?
These coins have high liquidity on Binance Exchange, so that could help with trading on AUD/USDT/BTC pairs. And if you’re looking at buying and HODLing cryptos, then Swyftx Exchange is an easy-to-use popular choice in Australia.


