Categories
Crypto News Gala Market Analysis MyNeighborAlice Oasis Network Trading

Top 3 Coins to Watch Today: ALICE, ROSE, GALA – August 1 Trading Analysis

Let’s take a closer look at today’s altcoins showing breakout signals. We’ll explain what the coin is, then dive into the trading charts and provide some analysis to help you decide.

1. MyNeighborAlice (ALICE)

ALICE is a multiplayer builder game where anyone can buy and own virtual islands, collect and build exciting items, and meet new friends. Inspired by successful games such as Animal Crossing, the game combines the best of the two worlds – a fun narrative for regular players who want to enjoy the gameplay experience, as well as an ecosystem for players who want to collect and trade non-fungible tokens (NFTs).

ALICE Price Analysis

At the time of writing, ALICE is ranked the 279th cryptocurrency globally and the current price is US$3.00. Let’s take a look at the chart below for price analysis:

Source: TradingView

ALICE dropped almost 80% from its Q2 highs. Since this drop, the price has consolidated in a tight range between approximately $3.40 and $2.38.

Support might have formed near $2.87. This area shows inefficient trading on the daily chart. It also overlaps June 15’s swing high and contains the 9 and 18 EMAs.

If this level breaks, the price might also find support at a small distance below, near $2.69. Here, the weekly chart shows that bulls rejected bears.

The 40 EMA is currently providing some resistance. Yet the price may be seeking the next resistance near $3.20. This level is near the top of the range, contains relative equal highs, and is just below the June monthly open. 

A break through this level might reach the next resistance near $3.36. This level is just above relative equal highs and the June monthly open. It also shows inefficient trading on the weekly chart and overlaps with the June 2021 swing low’s wick.

If the rally continues, $3.70 could provide the next resistance. This level shows inefficient trading on the weekly and monthly charts. It also overlaps with June 2021’s weekly and monthly swing low candle body boundaries.

The overall market is still bearish, so bulls should be cautious. There is no historical price action to suggest support below the current price. The local range’s 50% extension suggests that $2.25 to $2.00 could be the next longer-term downside target.

2. Oasis Network (ROSE)

The Oasis Network ROSE is the first privacy-enabled blockchain platform for open finance and a responsible data economy. Combined with its high throughput and secure architecture, the Oasis Network is able to power private, scalable DeFi, revolutionising Open Finance and expanding it beyond traders and early adopters to a mass market. Its unique privacy features can not only redefine DeFi but also create a new type of digital asset called Tokenised Data that can enable users to take control of the data they generate and earn rewards for staking it with applications – creating the first-ever responsible data economy.

ROSE Price Analysis

At the time of writing, ROSE is ranked the 89th cryptocurrency globally and the current price is US$0.08846. Let’s take a look at the chart below for price analysis:

Source: TradingView

ROSE climbed 42% from its Q1 low, then dropped nearly 73% into support last month.

The price is currently testing this resistance, near $0.09230. It may also provide support again and has confluence with the 61.8% and 78.6% retracements.

Resistance begins just above, at $0.09837. This inefficiently traded area, which reaches slightly beyond $0.1146, contains the previous monthly highs, a bearish market structure break on the daily chart, and the 9, 18 and 40 EMAs. 

These confluences often provide strong resistance. Since this resistance is close to the $0.1230 support, the price may enter consolidation before breaking out to the next move.

If the price breaks this resistance, bulls could eye an area of old rejection, near $0.1310, as their next target. Continuation through this level may target another area of bearish rejection on the weekly chart, near the 27% extension from $0.1329 to $0.1357.

A more significant bearish turn in the market may reach for bulls’ stops under the Q2 lows, down to an area of old support in an inefficiently traded area between $0.08341 and $0.07217.

3. Gala (GALA)

GALA aims to take the gaming industry in a different direction by giving players back control over their games. Gala Games’ mission is to make “blockchain games you’ll actually want to play”. The project wants to change how players can spend hundreds of dollars on in-game assets and countless hours playing the game, all of which could be taken away from them with the click of a button. It plans to reintroduce creative thinking by giving players control of their games and in-game assets with the help of blockchain technology.

GALA Price Analysis

At the time of writing, GALA is ranked the 94th cryptocurrency globally and the current price is US$0.05995. Let’s take a look at the chart below for price analysis:

Source: TradingView

After setting a low last week, GALA turned into a recovery trend to make the new monthly highs.

The following 75% plummet found support near $0.05029, sweeping under the 40 EMA into the 60.8% retracement level before bouncing to resistance beginning at $0.06420.

This area could continue to provide resistance, possibly causing a retracement to the 9 EMA and 18 EMA near $0.06812, where aggressive bulls might begin bidding. The level near $0.07325, which has confluence with the 40 EMA, may see more interest from bulls loading up for an attempt on probable resistance beginning near $0.08475. 

However, if Bitcoin continues its sideways trend, much lower prices could be seen. The old support near $0.04720 could provide at least a short-term bounce. If this level fails, the old highs near $0.03835 might also give support and see the start of a new bullish cycle after retesting these support levels.

Learn How to Trade Live!

Join Dave and The Crypto Den Crew and they’ll show you live on a webinar how to take your crypto trading to the next level.

Where to Buy or Trade Altcoins?

These coins have high liquidity on Binance Exchange, so that could help with trading on AUD/USDT/BTC pairs. And if you’re looking at buying and HODLing cryptos, then Swyftx Exchange is an easy-to-use popular choice in Australia.

Categories
Algorand Crypto News Market Analysis SKALE Network THORChain Trading

Top 3 Coins to Watch Today: SKL, ALGO, RUNE – July 29 Trading Analysis

Let’s take a closer look at today’s altcoins showing breakout signals. We’ll explain what the coin is, then dive into the trading charts and provide some analysis to help you decide.

1. SKALE Network (SKL)

Skale SKL is described as an elastic network designed to bring scalability to Ethereum. As well as boosting transaction capacity, the decentralised project aims to reduce latency and ensure that payments can be made as cheaply as possible. SKALE Network is geared towards improving both the security and decentralisation of Ethereum-based apps. Token holders on the network are incentivised and earn rewards by helping to improve the scalability and security of the platform by serving as validators.

SKL Price Analysis

At the time of writing, SKL is ranked the 140th cryptocurrency globally and the current price is US$0.05502. Let’s take a look at the chart below for price analysis:

Source: TradingView

Since the beginning of Q2, SKL has been in a gentle downtrend. The future likely holds more stop runs and erratic volatility until the chart forms more substantial high-timeframe levels.

A retracement might uncover support near $0.04920, which is the daily high of the last swing low. The high of the wick beginning near $0.04571 may also provide support. However, bulls will likely remain wary of the current downtrend, making the low at $0.04230 the probable next bearish target.

Just above, the daily gap beginning near $0.06088 may provide resistance to bulls, possibly marking a future range high. A push through this level is likely to target the swing high near $0.06493 – perhaps running to probable resistance near $0.07044. Strength above this level may signal the start of a bullish trend, encouraging bulls to “buy the dip”.

2. Algorand (ALGO)

The Algorand ALGO blockchain is a permissionless, pure proof-of-stake blockchain protocol. Unlike proof-of-work (PoW) blockchains, where the root block must be validated by randomly selected validators (using computing power), in the pure proof-of-stake approach all of the validators are known to one another and only have to agree on the next block in order to create a new block. Algorand was invented to speed up transactions and improve efficiency in response to the slow transaction times of Bitcoin and other blockchains.

ALGO Price Analysis

At the time of writing, ALGO is ranked the 30th cryptocurrency globally and the current price is US$0.3411. Let’s take a look at the chart below for price analysis:

Source: TradingView

After creating a second equal low during last month, ALGO gained nearly 25% into resistance that starts near $0.4322.

Swing traders looking for a continuation to the nearest cluster of relatively equal highs around $0.5012 might look for bids near $0.5536. More significant resistance rests above, near $0.6025. A group of significant swing highs at $0.6410 and $0.6618 provide possible targets if this resistance breaks.

A stop run on the recent low at $0.2835 into possible support beginning near $0.2530 might see stronger bidding. This area also has a confluence with the recent monthly lows.

3. THORChain (RUNE)

ThorChain RUNE is a decentralised liquidity protocol that allows users to easily exchange cryptocurrency assets across a range of networks without losing full custody of their assets in the process. The native utility token of the THORChain platform is RUNE. This is used as the base currency in the THORChain ecosystem and is also used for platform governance and security as part of THORChain’s Sybil resistance mechanisms – since THORChain nodes must commit a minimum of 1 million RUNE to participate in its rotating consensus process.

RUNE Price Analysis

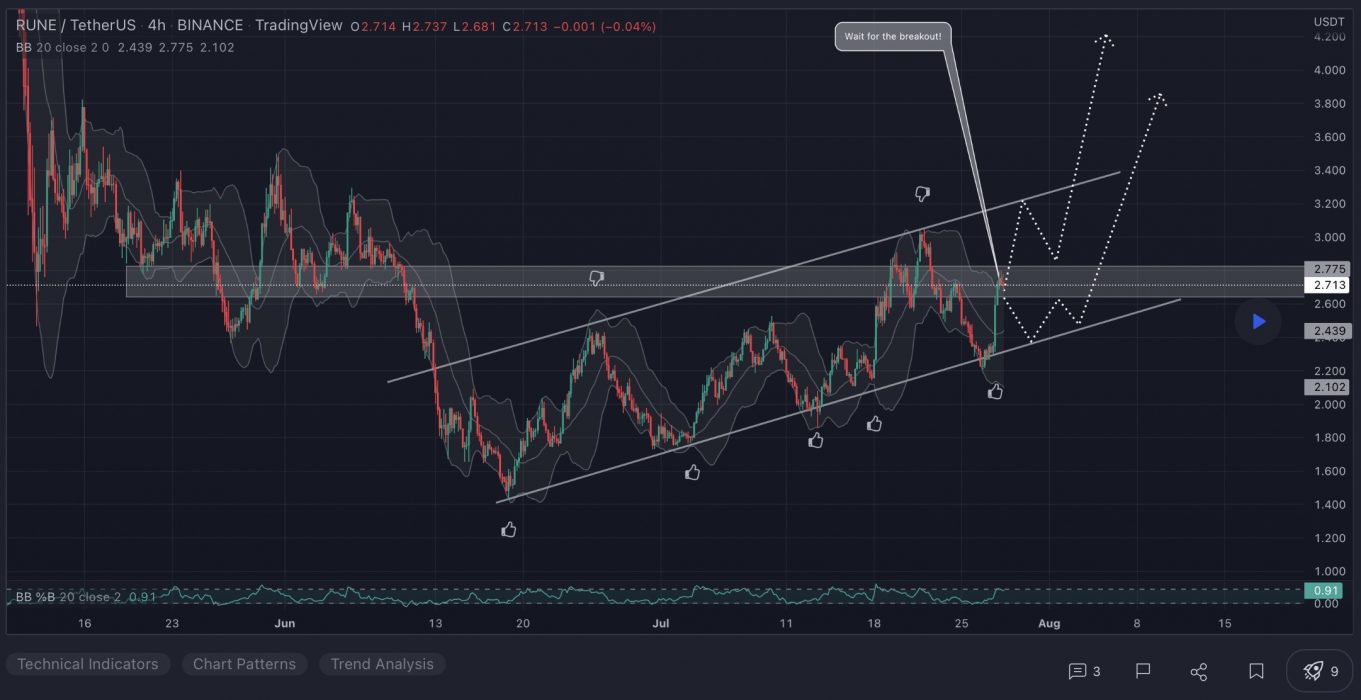
At the time of writing, RUNE is ranked the 53rd cryptocurrency globally and the current price is US$2.88. Let’s take a look at the chart below for price analysis:

Source: TradingView

RUNE has dropped 85% from its early Q2 high. It’s currently breaking down from its consolidation range formed in May and early June.

The price might find its closest resistance in an inefficiently traded area on the daily chart between $2.99 and $3.10. This level has confluence with the past week’s swing high.

The price may be forming a triple-sweep (three lower lows) before returning into its consolidation range. If so, an inefficiently traded area near $3.25 could provide another resistance. This level also shows distribution on the weekly chart near the 18 EMA.

A more extended rally could reach an inefficiently traded area on the monthly chart between $3.42 and $3.90. Yet this is less likely to happen soon, given the current bearish market conditions.

Below, $2.65 could offer support. This level is an area of inefficient trading below a daily swing low from June. It also shows accumulation on the weekly.

The following daily swing low, near $2.35, could offer the next bearish target. This level shows inefficient trading on the daily and weekly charts.

Learn How to Trade Live!

Join Dave and The Crypto Den Crew and they’ll show you live on a webinar how to take your crypto trading to the next level.

Where to Buy or Trade Altcoins?

These coins have high liquidity on Binance Exchange, so that could help with trading on AUD/USDT/BTC pairs. And if you’re looking at buying and HODLing cryptos, then Swyftx Exchange is an easy-to-use popular choice in Australia.

Categories
Crypto News Dash Market Analysis SushiSwap Trading Tranchess

Top 3 Coins to Watch Today: DASH, CHESS, SUSHI – July 28 Trading Analysis

Let’s take a closer look at today’s altcoins showing breakout signals. We’ll explain what the coin is, then dive into the trading charts and provide some analysis to help you decide.

1. Dash (DASH)

Dash is an open-source blockchain and cryptocurrency focused on offering a fast, cheap and decentralised global payments network. According to the project’s white paper, Dash seeks to improve on Bitcoin by providing stronger privacy and faster transactions. Dash’s governance system, or treasury, distributes 10% of the block rewards for the development of the project in a competitive and decentralised way.

DASH Price Analysis

At the time of writing, DASH is ranked the 76th cryptocurrency globally and the current price is US$44.57. Let’s take a look at the chart below for price analysis:

Source: TradingView

During Q2, DASH retraced over 70% before finding support near $43.10. Consolidation above this level has created a series of relatively equal lows, which are likely to be swept before any longer-term bullish trend begins. 

In the shorter term, the price might establish support near $40.25 before running the swing high at $49.88. If this bullish move occurs, the price could reach resistance near the weekly open around $54.12, and may even sweep the swing high near $58.22.

Some support might exist at the daily gap near $43.12. A move this low would also fill the monthly gap and set the stage for a possible bullish reversal.

2. Tranchess (CHESS)

Tranchess CHESS is a yield-enhancing asset tracker with varied risk-return solutions. Tranchess provides a different risk/return matrix out of a single main fund that tracks a specific underlying asset. The name Tranchess was inspired by the game of chess, as well as the French word “Tranche”, which is often associated with tranche funds that cater to a different class of investors with varying risk appetite. Tranchess was launched on June 24, 2021. The project leverages on smart contracts, making it transparent and automated across processes.

CHESS Price Analysis

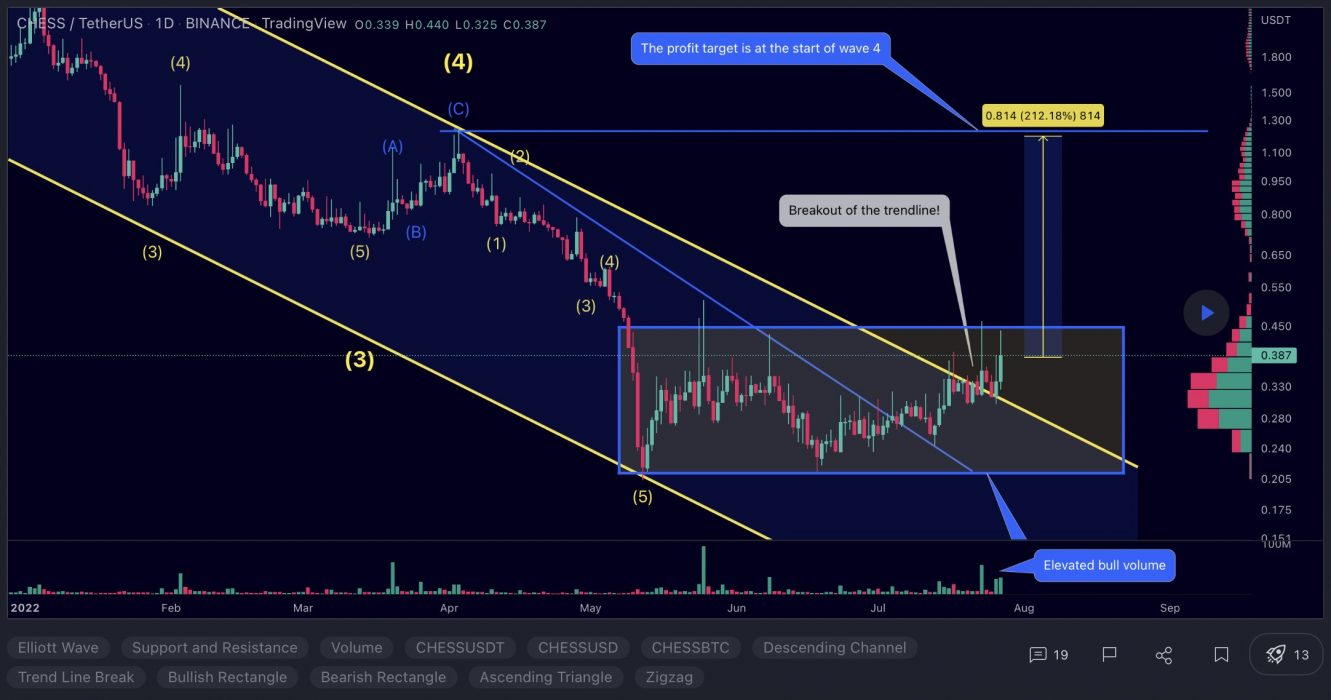
At the time of writing, CHESS is ranked the 504th cryptocurrency globally and the current price is US$0.3555. Let’s take a look at the chart below for price analysis:

Source: TradingView

CHESS dropped 80% from its early Q2 highs before beginning a consolidation range in June. Most trading occurred between the June monthly open and $0.3150. Here, relatively equal lows have formed under the oldest historical low, around $0.2870.

These lows might serve as a magnet for a stop run reaching near the last swing low, between $0.2562 and $0.2470. A continued move down could run more bulls’ stops below May’s low at $0.2140.

No historical price action exists under May’s low to pinpoint possible support. Round numbers suggest that $0.1935 could offer some support on an initial stop run under May’s low. 

Below this level, the 50% and 100% extensions (projected from two swings in the current range) overlap near $0.1840. This confluence could offer a weak hint at another possible support. Bulls should be highly cautious given the bearish chart and market conditions.

3. SushiSwap (SUSHI)

SushiSwap SUSHI is an example of an automated market maker (AMM). An increasingly popular tool among cryptocurrency users, AMMs are decentralised exchanges that use smart contracts to create markets for any given pair of tokens. SushiSwap aims to diversify the AMM market and also add features not previously present on Uniswap, such as increased rewards for network participants via its in-house token, SUSHI.

SUSHI Price Analysis

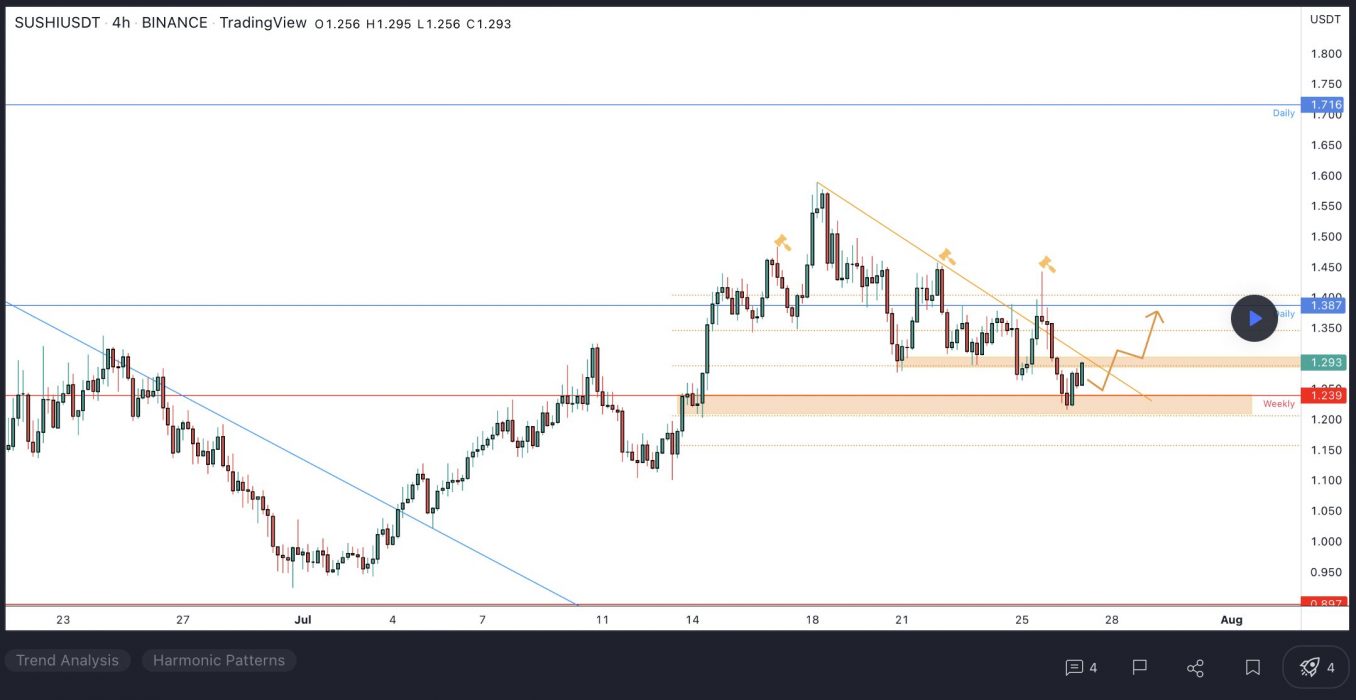
At the time of writing, SUSHI is ranked the 148th cryptocurrency globally and the current price is US$1.27. Let’s take a look at the chart below for price analysis:

Source: TradingView

After retracing nearly 80% from its Q2 highs, SUSHI set a low near $0.9410 as it formed its current range.

Last week, the price swept highs near $1.48, which now also marks the previous monthly high. Relatively equal daily highs near $1.50 provide a reasonable target, although resistance beginning near $1.56 could cap the move. A break of this resistance is likely to target the swing high near $1.66 into higher-timeframe resistance beginning near $1.74.

The current area near $1.19 could provide support, although bulls may be more likely to buy around the price fractal near $1.12 if a retracement reaches this level. A break of this area could continue down to sweep the low near $1.00 into possible support beginning near $0.9012.

Learn How to Trade Live!

Join Dave and The Crypto Den Crew and they’ll show you live on a webinar how to take your crypto trading to the next level.

Where to Buy or Trade Altcoins?

These coins have high liquidity on Binance Exchange, so that could help with trading on AUD/USDT/BTC pairs. And if you’re looking at buying and HODLing cryptos, then Swyftx Exchange is an easy-to-use popular choice in Australia.

Categories
Crypto News Dogecoin Enjin Coin Market Analysis Trading Uniswap

Top 3 Coins to Watch Today: UNI, DOGE, ENJ – July 27 Trading Analysis

Let’s take a closer look at today’s altcoins showing breakout signals. We’ll explain what the coin is, then dive into the trading charts and provide some analysis to help you decide.

1. Uniswap (UNI)

Uniswap UNI is a popular decentralised trading protocol known for its role in facilitating the automated trading of decentralised finance (DeFi) tokens. Uniswap aims to keep token trading automated and completely open to anyone who holds tokens while improving the efficiency of trading versus that on traditional exchanges. Uniswap creates more efficiency by solving liquidity issues with automated solutions, avoiding the problems that plagued the first decentralised exchanges.

UNI Price Analysis

At the time of writing, UNI is ranked the 19th cryptocurrency globally and the current price is US$6.41. Let’s take a look at the chart below for price analysis:

Source: TradingView

UNI‘s 70% retracement from its Q2 highs set a low near $3.80 during its consolidation that began in early June.

Relatively equal highs near $6.80 could be the current target if the price breaks through resistance beginning near $6.97. Bullish continuation might reach through the next significant swing high near $7.20 into the daily gap near $7.50.

If bullish strength continues, the zones just below the monthly open near $7.88 and $8.23 could halt any retracement. 

A bearish shift in the market might seek the relatively equal lows near $5.90 into possible support near $5.62. If this down move occurs, the swing low near $5.32 and possible support near $4.93 may be the primary objective.

2. Dogecoin (DOGE)

Dogecoin DOGE is based on the popular “Doge” internet meme and features a Shiba Inu as its logo. The open-source digital currency was created by Billy Markus from Portland, Oregon, and Jackson Palmer from Sydney, Australia, and was forked from Litecoin in December 2013. Dogecoin’s creators envisaged it as a fun, light-hearted cryptocurrency that would have greater appeal beyond the core Bitcoin audience since it was based on a dog meme.

DOGE Price Analysis

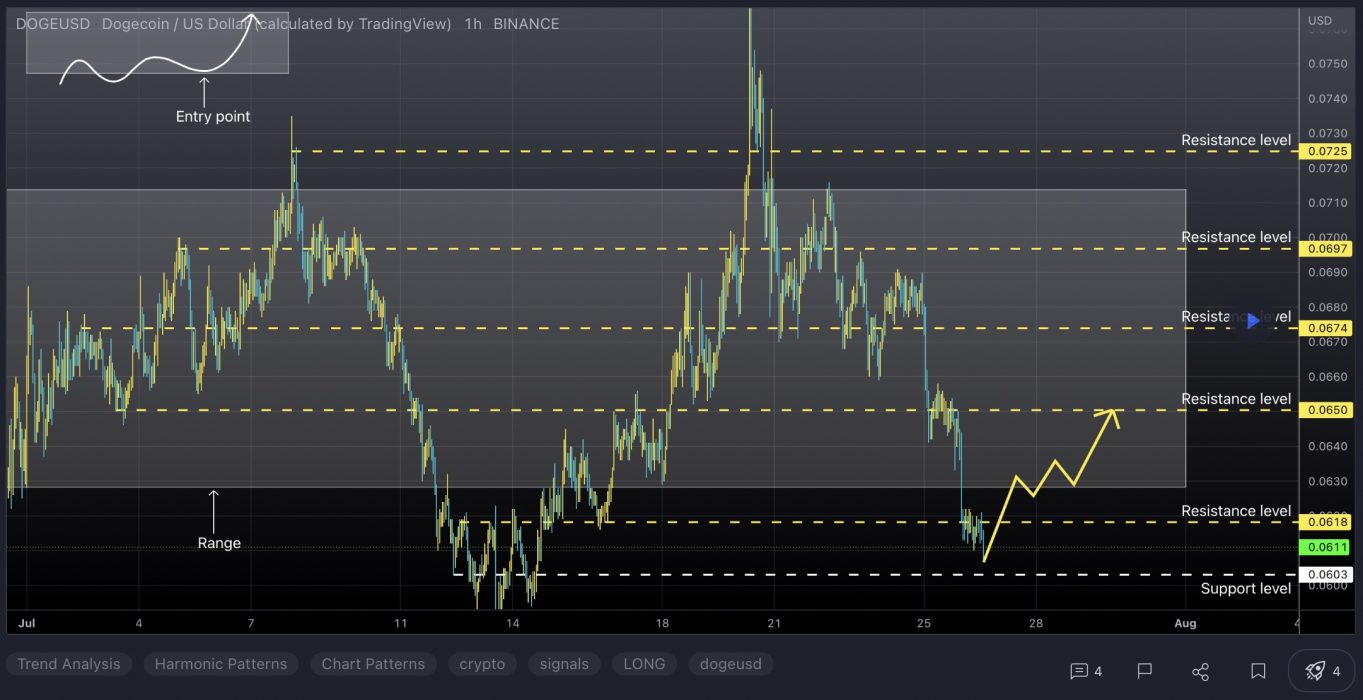
At the time of writing, DOGE is ranked the 10th cryptocurrency globally and the current price is US$0.06089. Let’s take a look at the chart below for price analysis:

Source: TradingView

DOGE marines continue holding the price, printing nearly 29% gains during June.

The consolidation near $0.06015 is likely to provide support as the price continues exploring new highs. However, a set of relatively equal lows near $0.05829 provides a tempting target for a stop run into probable support near $0.05460.

A decidedly bearish shift in the market could reach probable support near $0.05098, near the monthly open.

Almost no resistance lies overhead, although low-timeframe traders can use the resistance below recent highs near $0.06384 as a first target. Beyond this level, extensions near $0.06723, $0.07354 and $0.08169 give reasonable higher-timeframe targets.

3. Enjin Coin (ENJ)

Enjin Coin ENJ is a project of Enjin, a company that provides an ecosystem of interconnected, blockchain-based gaming products. Enjin’s flagship offering is the Enjin Network, a social gaming platform through which users can create websites and clans, chat, and host virtual item stores. Enjin Coin is a digital store of value used to back the value of blockchain assets such as non-fungible tokens (NFTs).

ENJ Price Analysis

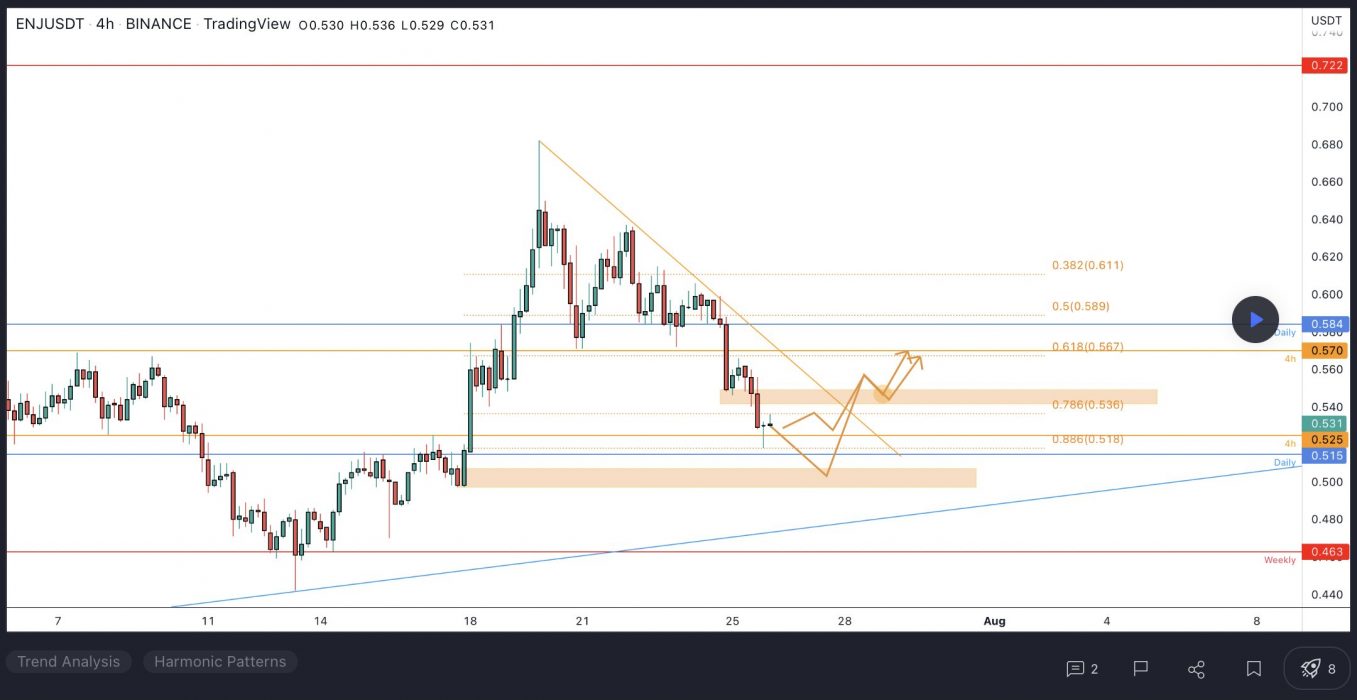
At the time of writing, ENJ is ranked the 70th cryptocurrency globally and the current price is US$0.5357. Let’s take a look at the chart below for price analysis:

Source: TradingView

ENJ spent Q2 ranging between 30% over and 20% below. The price is currently consolidating between adjacent resistance and support at $0.5145 with no clear higher-timeframe trend. A strong move over the monthly open could signal a run to resistance beginning near $0.6395. 

This move would likely target the swing high at $0.6512 and relatively equal highs near $0.7049. A sustained bullish trend could reach up to the monthly high near $0.7432.

Bulls may see a sweep of the relatively equal lows near $0.4832 as a chance to buy at a discount. If this level fails to hold, the next significant area for the price to find buyers is likely near the consolidation around $0.4435 and $0.4050.

Learn How to Trade Live!

Join Dave and The Crypto Den Crew and they’ll show you live on a webinar how to take your crypto trading to the next level.

Where to Buy or Trade Altcoins?

These coins have high liquidity on Binance Exchange, so that could help with trading on AUD/USDT/BTC pairs. And if you’re looking at buying and HODLing cryptos, then Swyftx Exchange is an easy-to-use popular choice in Australia.

Categories
COTI Crypto News DeFiChain Market Analysis Perpetual Protocol Trading

Top 3 Coins to Watch Today: COTI, DFI, PERP – July 26 Trading Analysis

Let’s take a closer look at today’s altcoins showing breakout signals. We’ll explain what the coin is, then dive into the trading charts and provide some analysis to help you decide.

1. Coti (COTI)

COTI markets itself as the first enterprise-grade fintech platform that empowers organisations to build their own payment solutions, as well as digitise any currency to save time as well as money. COTI is one of the world’s first blockchain protocols optimised for decentralised payments and designed for use by merchants, governments, payment DApps, and stablecoin issuers. The ecosystem has a DAG-based blockchain, proof-of-trust consensus algorithm, multiDAG, GTS (Global Trust System), a universal payment solution, and a payment gateway.

COTI Price Analysis

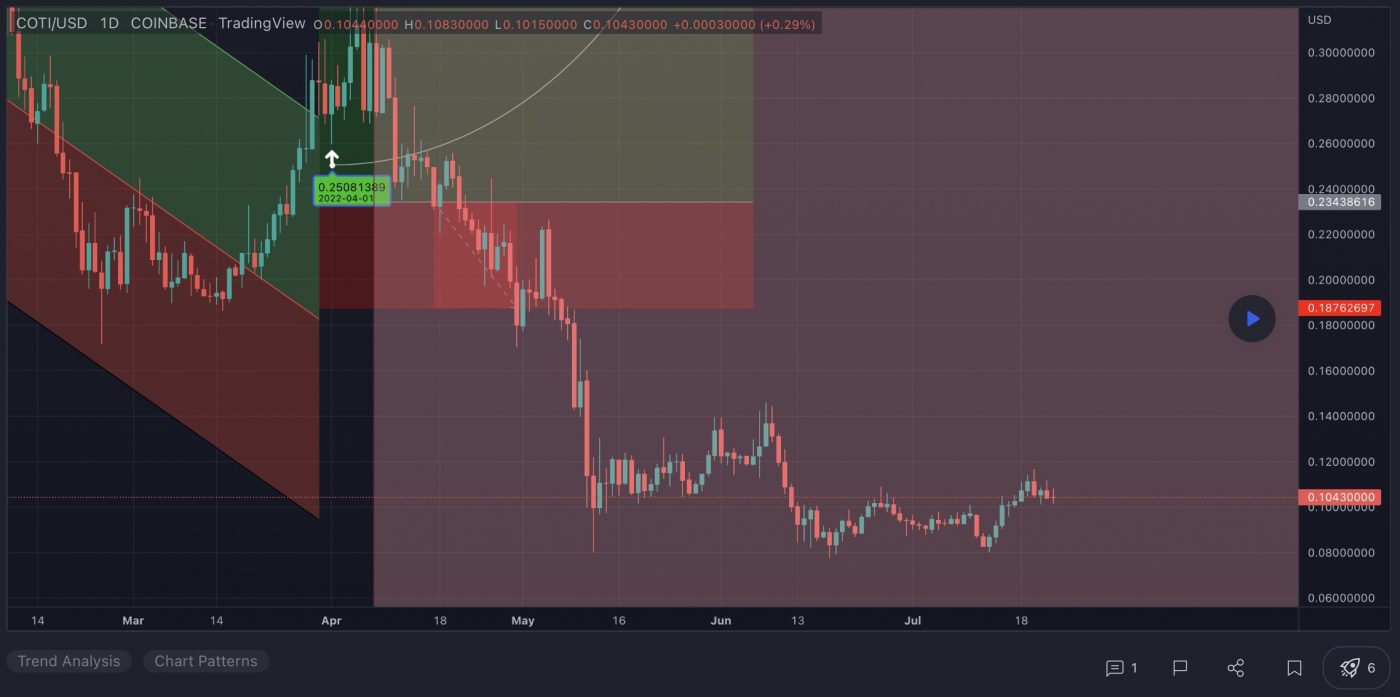
At the time of writing, COTI is ranked the 185th cryptocurrency globally and the current price is US$0.1003. Let’s take a look at the chart below for price analysis:

Source: TradingView

COTI has been ranging since its swift collapse in early May. Bulls and bears are battling between adjacent support and resistance surrounding $0.1036. This proximity may cause more consolidation until a strong move shows the next direction.

The area of resistance showed inefficient trading on the weekly chart. Price has rebalanced this area, so bears are free to take the price lower. Meanwhile, the upper part of accumulation on the weekly and the 9, 18 and 40 EMAs form support below.

A break lower might reach for inefficient trading on the daily chart near $0.0941. This level saw accumulation before mid-July’s run on bulls’ stops. It’s also under the July monthly open and the high of previous inefficient trading on the weekly chart.

If the price breaks higher, an area near $0.1315 could provide the next significant resistance. A move to this level would rebalance early June’s fast drop. It’s also near the June monthly open.

Bulls’ stops under relative equal lows, near $0.07689, might be the next bearish target if the downtrend resumes. This level still shows inefficient trading on the monthly and weekly charts.

2. DeFiChain (DFI)

DeFiChain DFI is a blockchain platform built with the mission of maximising the full potential of DeFi within the Bitcoin (BTC) ecosystem. The software platform is supported by a distributed network of computers and is designed to facilitate fast and transparent transactions. The development team positions DeFiChain as an innovative blockchain project and offers solutions to problems like scalability, security, and decentralisation.

DFI Price Analysis

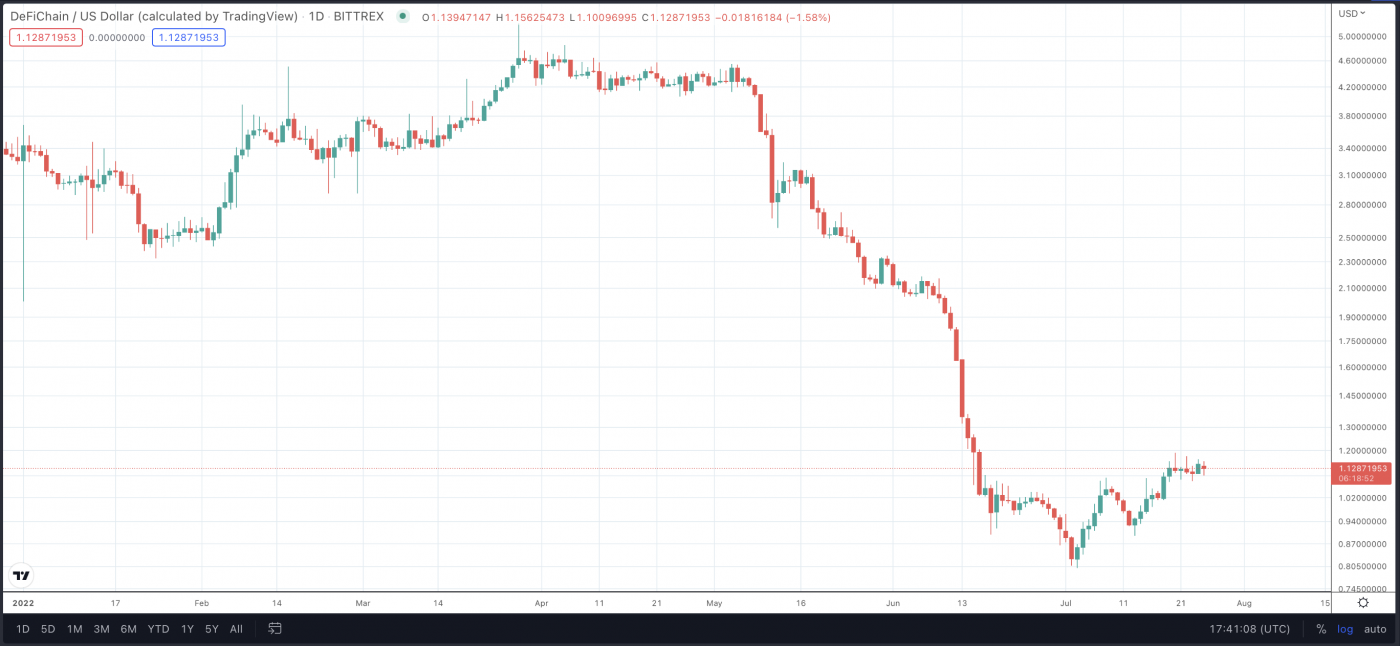
At the time of writing, DFI is ranked the 214th cryptocurrency globally and the current price is US$1.10. Let’s take a look at the chart below for price analysis:

Source: TradingView

DFI collapsed 84% from its April high before beginning an uptrend in early July.

Bulls broke the market structure to the upside on July 7. This break resulted in a 73% climb ending with a large spike on July 22. Inside this spike, $1.2568 could provide the first resistance. It overlaps with a small area of inefficient trading in mid-June and is near the 40 EMA.

A move higher might retest July 22’s high, near $1.3922. This area shows inefficient trading on the daily and weekly charts. It’s also near the top of inefficient trading on the monthly chart. 

If the rally continues, bulls should find support near $1.0852. A narrow pocket under this level, from $1.0690 to $1.050, could provide more sensitivity. This pocket shows inefficient trading on the daily and overlaps with old highs. It’s also near the 9 and 18 EMAs.

If the downtrend resumes, a wide area from $0.7233 to $0.4132 might spawn the following bullish setup. This zone shows inefficient trading on the monthly chart.

Near its midpoint, around $0.5387, is the bottom of inefficient trading on the weekly chart. This level could provide sensitivity and be a target for bears.

3. Perpetual Protocol (PERP)

Perpetual Protocol PERP is a decentralised exchange (DEX) for futures on Ethereum and xDai. Traders can go long or short with up to 10X leverage on a growing number of assets such as BTC, ETH, DOT, and others. Trading is non-custodial, meaning traders always retain possession of their assets and on-chain. Perpetual Protocol utilises a virtual automated market maker (vAMM), which provides on-chain liquidity with predictable pricing set by constant product curves. Furthermore, Perpetual Protocol designed its vAMMs to be market-neutral and fully collateralised.

PERP Price Analysis

At the time of writing, PERP is ranked the 319th cryptocurrency globally and the current price is US$0.7525. Let’s take a look at the chart below for price analysis:

Source: TradingView

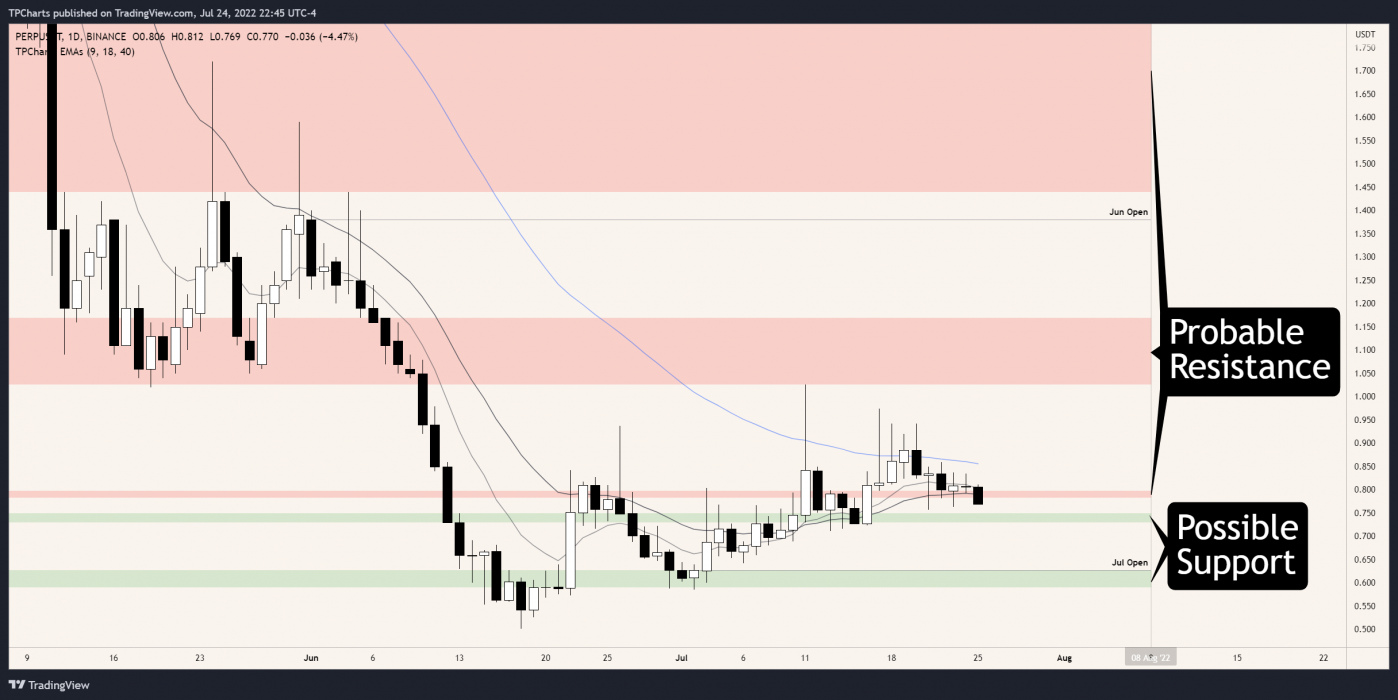
PERP has been in a downtrend for almost a year. In June, it set its all-time low.

Currently, the price is consolidating. The weekly accumulation high near $0.750 should support the price if bulls are buying. This retest would allow more buying as the price runs other bulls’ trailed stops under $0.757.

Yet, the closest resistance is nearby, at $0.783. This level is near the 9 and 18 EMAs, and also showed inefficient trading on the daily chart. This old inefficient trading may cause it to begin offering resistance. 

If the closest support breaks, higher timeframes suggest that $0.628 might be the next support. This level is under the July open near the origin of the rally. Bulls rejected bears here in mid-June.

A drop to this level should make bulls cautious. It could mean that swing lows near $0.586 and $0.502 are the bearish targets.

If bulls do find support, they may be targeting a wide area from $1.026 to $1.170. This range shows inefficient trading on the weekly chart that the price may need to fill. It would also sweep bears’ stops over early July’s swing high into an old distribution area.

Learn How to Trade Live!

Join Dave and The Crypto Den Crew and they’ll show you live on a webinar how to take your crypto trading to the next level.

Where to Buy or Trade Altcoins?

These coins have high liquidity on Binance Exchange, so that could help with trading on AUD/USDT/BTC pairs. And if you’re looking at buying and HODLing cryptos, then Swyftx Exchange is an easy-to-use popular choice in Australia.
Categories
Axie Infinity Binance Crypto News Litecoin Market Analysis Trading

Top 3 Coins to Watch Today: BNB, LTC, AXS – July 25 Trading Analysis

Let’s take a closer look at today’s altcoins showing breakout signals. We’ll explain what the coin is, then dive into the trading charts and provide some analysis to help you decide.

1. Binance Coin (BNB)

Binance BNB is the biggest cryptocurrency exchange globally, based on daily trading volume. Binance aims to bring cryptocurrency exchanges to the forefront of world financial activity. Aside from being the largest cryptocurrency exchange, Binance has launched a whole ecosystem of functionalities for its users. The Binance network includes the Binance Chain, Binance Smart Chain, Binance Academy, Trust Wallet, and Research projects, which all employ the powers of blockchain technology to bring new-age finance to the world. Binance Coin is an integral part of the successful functioning of many of the Binance sub-projects.

BNB Price Analysis

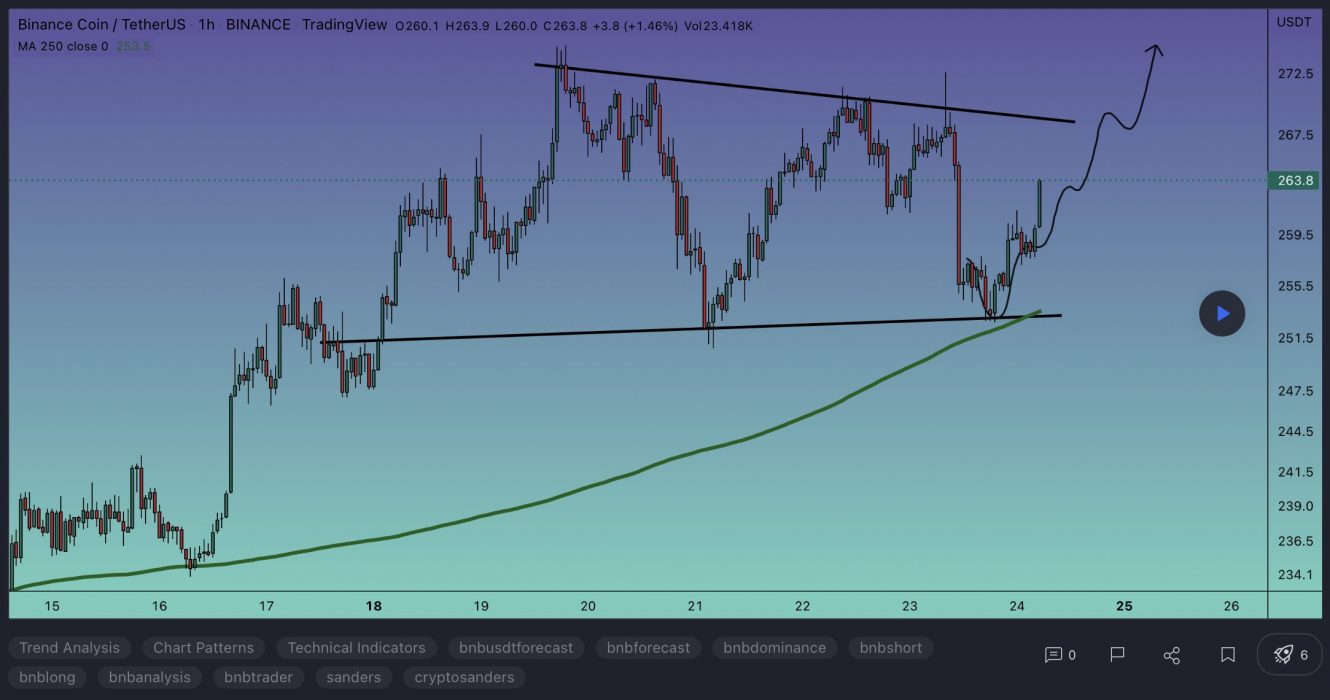
At the time of writing, BNB is ranked the 5th cryptocurrency globally and the current price is US$263.18. Let’s take a look at the chart below for price analysis:

Source: TradingView

After a 55% decline from Q2, BNB has ranged between $198 and $270. The recent price recovery was approaching probable resistance near $296 but could be aiming for stops above the relatively equal highs near $326. Continuation of the trend could target the daily gap near $354.

Aggressive bulls might add to positions near $260 and $254. Price action near $240 – if it gets there – may be more likely to provide support during any retracements.

Relatively equal lows clustered around $235 seem likely to be swept if the bearish trend resumes. If this move occurs, the price might find support at the significant higher-timeframe level near $219.

2. Litecoin (LTC)

Litecoin LTC is a cryptocurrency designed to provide fast, secure, and low-cost payments by leveraging the unique properties of blockchain technology. The cryptocurrency was created based on the Bitcoin protocol but it differs in terms of the hashing algorithm used, hard cap, block transaction times, and a few other factors. Litecoin has a block time of just 2.5 minutes and extremely low transaction fees, making it suitable for micro-transactions and point-of-sale payments.

LTC Price Analysis

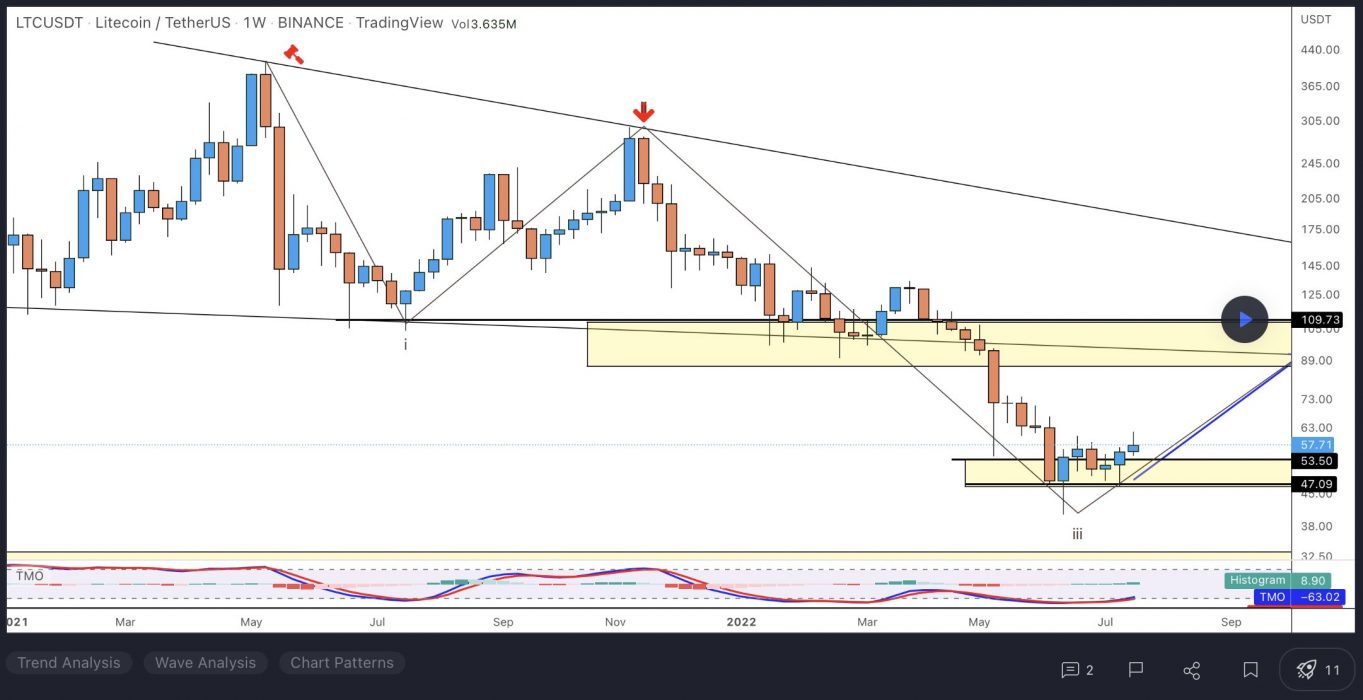
At the time of writing, LTC is ranked the 20th cryptocurrency globally and the current price is US$58.90. Let’s take a look at the chart below for price analysis:

Source: TradingView

After setting a low last week, LTC kicked off a with recovery trend to break the weekly highs. The following 75% plummet found support near $42.36, sweeping under the 40 EMA into the 63.8% retracement level before bouncing to resistance beginning at $60.73.

This area could continue to provide resistance, possibly causing a retracement to the 9 EMA and 18 EMA near $64.12, where aggressive bulls might begin bidding. The level near $70.18, which has confluence with the 40 EMA, may see more interest from bulls loading up for an attempt on probable resistance beginning near $78.13. 

However, if Bitcoin continues its sideways trend, much lower prices could be seen. The old support near $50.18 could provide at least a short-term bounce. If this level fails, the old monthly lows near $43.65 may also give support and see the start of a new bullish cycle after retesting these support levels.

3. Axie Infinity (AXS)

Axie Infinity AXS is a blockchain-based trading and battling game that is partially owned and operated by its players. The Axie Infinity ecosystem has its own unique governance token, known as Axie Infinity Shards AXS. These are used to participate in key governance votes and give holders a say in how funds in the Axie Community Treasury are spent.

AXS Price Analysis

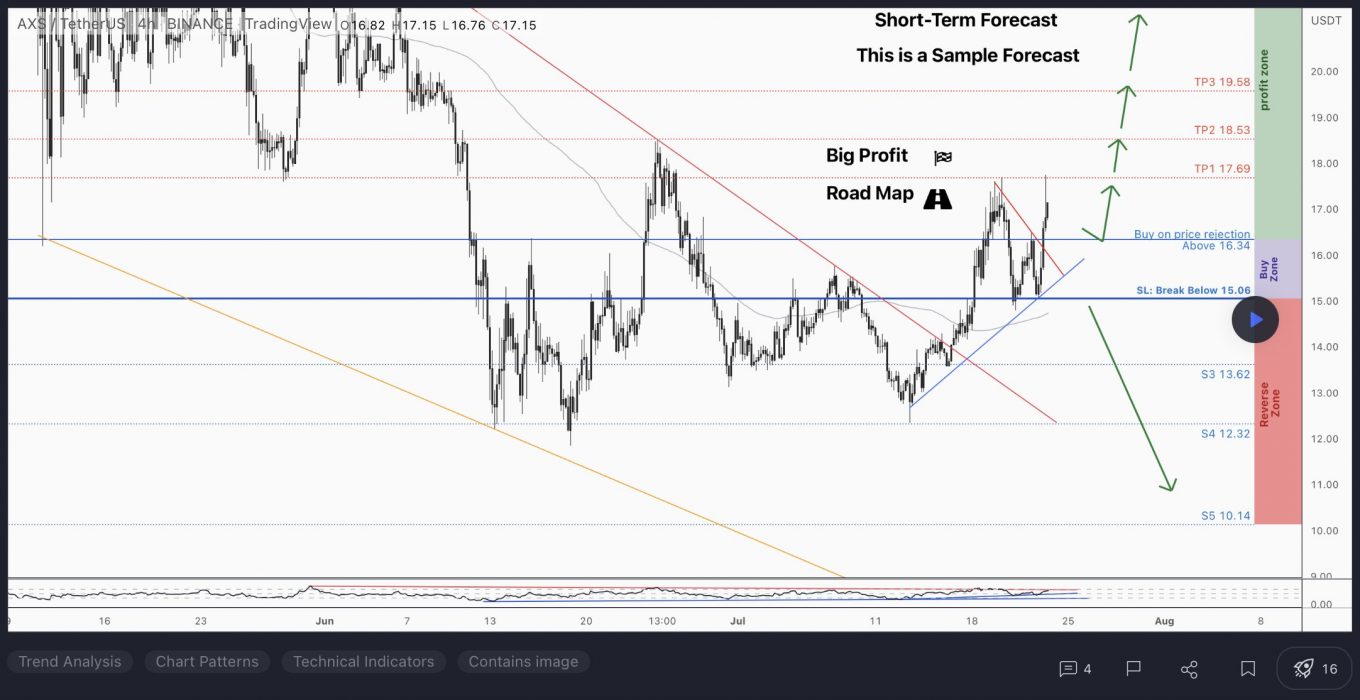
At the time of writing, AXS is ranked the 39th cryptocurrency globally and the current price is US$17.30. Let’s take a look at the chart below for price analysis:

Source: TradingView

AXS‘s relatively small 23% range could suggest that a recovery is setting up in July.

Aggressive bulls could look for entries at the most recent area of support formed near $15.34. However, equal lows near $14.32 make a tempting target for a stop run into this support. This move could reach support near $12.90. 

A decisive move to the downside could run stops below the second set of relatively equal lows near $11.80, possibly reaching support at an old swing high and a daily gap near $11.00.

A recent level near $19.84 provided resistance and caused a swing high to form near $21.88, offering first targets. A move through this high may arrive at new monthly high levels near $23.40 and $25.13.

Learn How to Trade Live!

Join Dave and The Crypto Den Crew and they’ll show you live on a webinar how to take your crypto trading to the next level.

Where to Buy or Trade Altcoins?

These coins have high liquidity on Binance Exchange, so that could help with trading on AUD/USDT/BTC pairs. And if you’re looking at buying and HODLing cryptos, then Swyftx Exchange is an easy-to-use popular choice in Australia.
Categories
Chromia Crypto News Curve DAO Token Hedera Market Analysis Trading

Top 3 Coins to Watch Today: HBAR, CRV, CHR – July 22 Trading Analysis

Let’s take a closer look at today’s altcoins showing breakout signals. We’ll explain what the coin is, then dive into the trading charts and provide some analysis to help you decide.

1. Hedera (HBAR)

Hedera Hashgraph HBAR is a public network that allows individuals and businesses to create powerful decentralised applications (DApps). It is designed to be a fairer, more efficient system that eliminates some of the limitations older blockchain-based platforms face, such as slow performance and instability. The HBAR token has a dual role within the Hedera public network.

HBAR Price Analysis

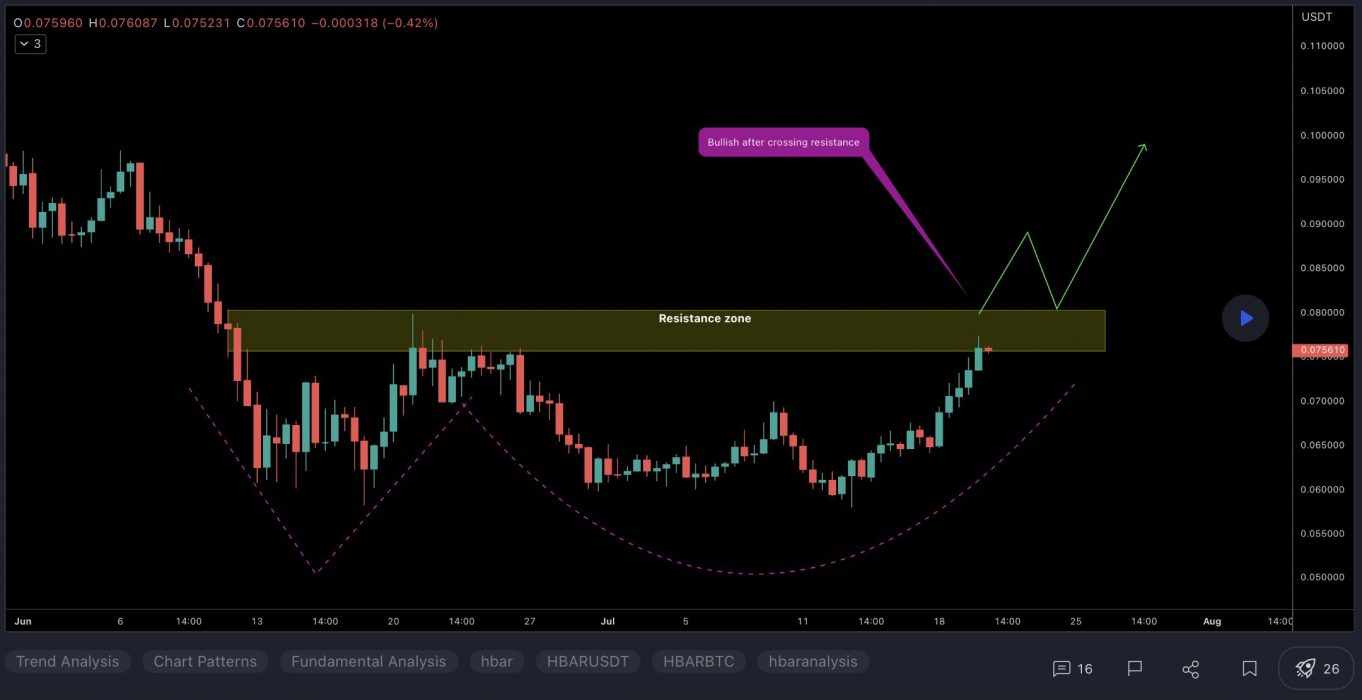
At the time of writing, HBAR is ranked the 38th cryptocurrency globally and the current price is US$0.07122. Let’s take a look at the chart below for price analysis:

Source: TradingView

HBAR‘s 60% Q1 run retraced almost to its origin, narrowly missing probable support near $0.5980 before bears swatted down the bounce near resistance around $0.07689.

With the daily gap between $0.06312 and $0.06054 almost filled in a single wick, the price may not need to revisit areas below this level. However, the safer entry is still in probable support between $0.05923 and $0.05573, which would also sweep the lows of last week’s bounce.

The relatively equal highs near $0.07824 provide a likely first target on lower timeframes. However, the resistance beginning at $0.08215 may initially suppress a further move up.

A clean break through this resistance will need to contend with the next resistance near $0.08692, under the last swing high. This swing high at $0.08950 gives a reasonable take-profit area before a possible move to the 1.0 extension near $0.09546.

2. Curve DAO Token (CRV)

Curve CRV is a decentralised exchange for stablecoins that uses an automated market maker (AMM) to manage liquidity. Curve has gained considerable attention by following its remit as an AMM specifically for stablecoin trading. The launch of the DAO and CRV token brought in further profitability, given CRV’s use for governance, as it is awarded to users based on liquidity commitment and length of ownership. The explosion in DeFi trading has ensured Curve’s longevity, with AMMs turning over huge amounts of liquidity and associated user profits.

CRV Price Analysis

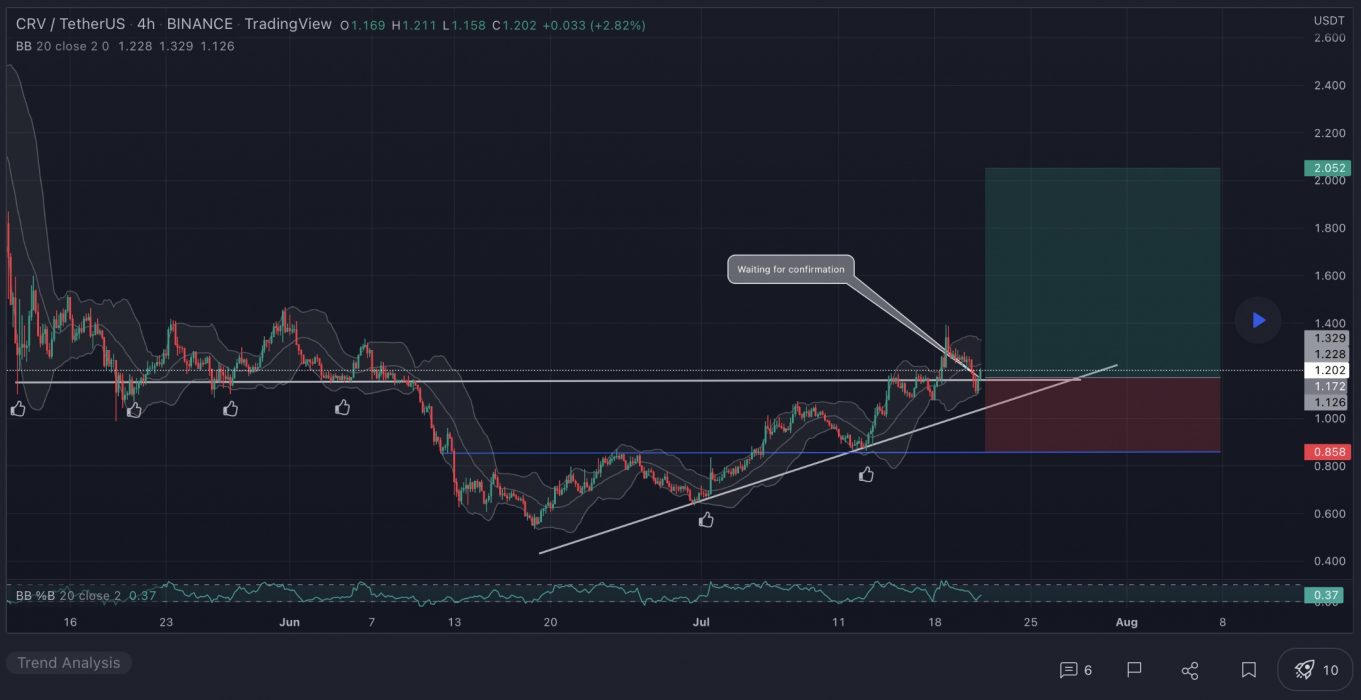
At the time of writing, CRV is ranked the 63rd cryptocurrency globally and the current price is US$1.36. Let’s take a look at the chart below for price analysis:

Source: TradingView

This month, traders enjoyed 28% gains at CRV‘s peak before the price confirmed stiff resistance beginning at $1.40.

The 4-Hour chart shows that support may be forming between $1.25 and $1.15, near the weekly open. Aggressive bulls could enter in this area, although safer entries may be found much further below near $1.12 and $1.02 after a sweep of the current consolidation’s swing lows.

The last swing high near $1.50 provides a likely first target if the price does bounce from this region. Beyond this swing high, the 1.0 extension near $1.60 and the 2.0 extension near $1.75 and $1.83 may provide the next major targets.

3. Chromia (CHR)

Chromia CHR is an open-source public blockchain conceived by Swedish company Chromaway AB. The Chroma token CHR was launched in May 2019. The technology behind the Chromia blockchain is adapted from an earlier technology called ‘Postchain’, a solution provided by Chromaway AB for enterprise clients. Chromia is a standalone Layer-1 blockchain and EVM compatible Layer-2 enhancement for Binance Smart Chain and Ethereum. It is designed to enhance existing dApps and allow for the creation of next-generation dApps by providing scalability, improved data handling, and customisable fee structures.

CHR Price Analysis

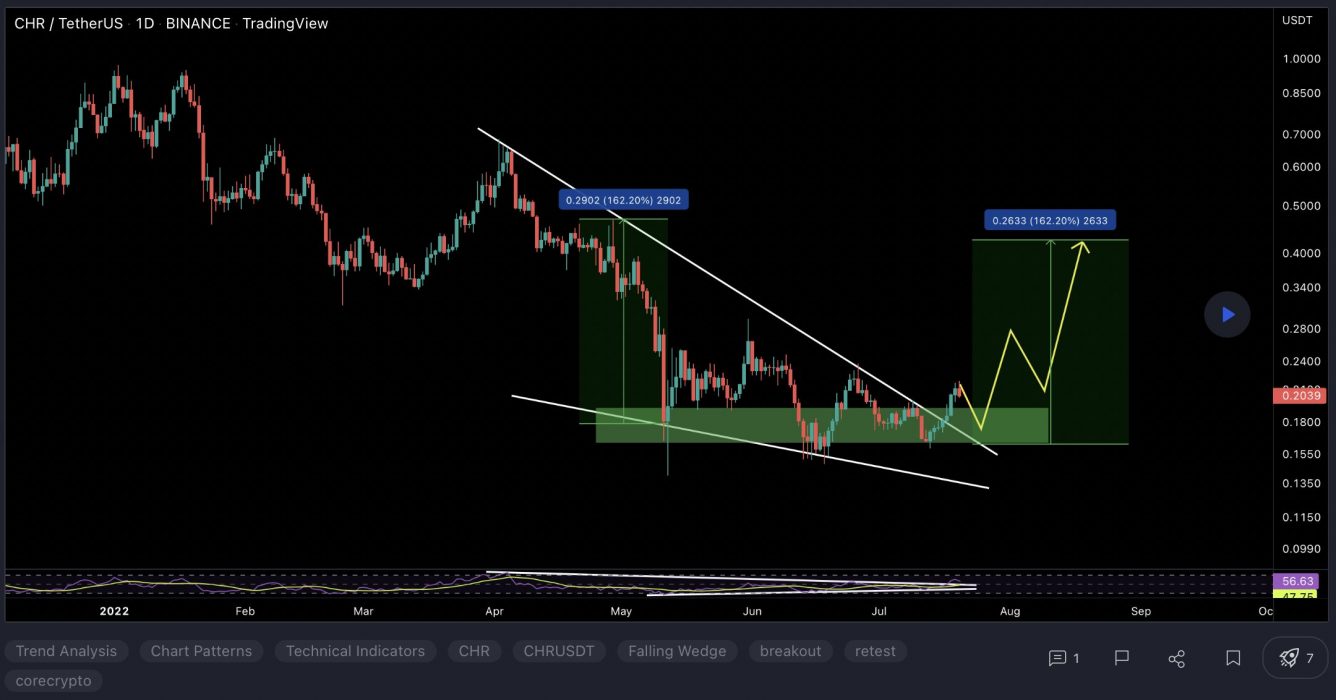
At the time of writing, CHR is ranked the 178th cryptocurrency globally and the current price is US$0.2143. Let’s take a look at the chart below for price analysis:

Source: TradingView

CHR‘s chart paints a different picture than those of many other altcoins, with the Q2 high leading to a massive range before setting a low near $0.1544 in June.

The beginning of July makes immediate bids questionable. However, the price may be finding support near $0.1962 and possibly near $0.1721. Since the price swept the impulse’s high at $0.2459, bulls might be waiting to enter near the swing low and gap near $0.1645, or slightly lower near $0.1598.

Little resistance lies overhead, although there may be some between $0.2573 and approximately $0.2622, just above the current price. A sweep and rejection of the high near $0.3057 would make most areas of possible support highly suspect and could mark the end of the bullish trend.

Learn How to Trade Live!

Join Dave and The Crypto Den Crew and they’ll show you live on a webinar how to take your crypto trading to the next level.

Where to Buy or Trade Altcoins?

These coins have high liquidity on Binance Exchange, so that could help with trading on AUD/USDT/BTC pairs. And if you’re looking at buying and HODLing cryptos, then Swyftx Exchange is an easy-to-use popular choice in Australia.

Categories
Crypto News EOS Market Analysis Polkadot The Graph Trading

Top 3 Coins to Watch Today: DOT, GRT, EOS – July 21 Trading Analysis

Let’s take a closer look at today’s altcoins showing breakout signals. We’ll explain what the coin is, then dive into the trading charts and provide some analysis to help you decide.

1. Polkadot (DOT)

Polkadot DOT is an open-source sharding multichain protocol that facilitates the cross-chain transfer of any data or asset types, not just tokens, thereby making a wide range of blockchains interoperable with each other. Polkadot’s native DOT token serves three clear purposes: providing network governance and operations, and creating parachains by bonding. The Polkadot protocol connects public and private chains, permissionless networks, oracles and future technologies, allowing these independent blockchains to trustlessly share information and transactions through the Polkadot relay chain.

DOT Price Analysis

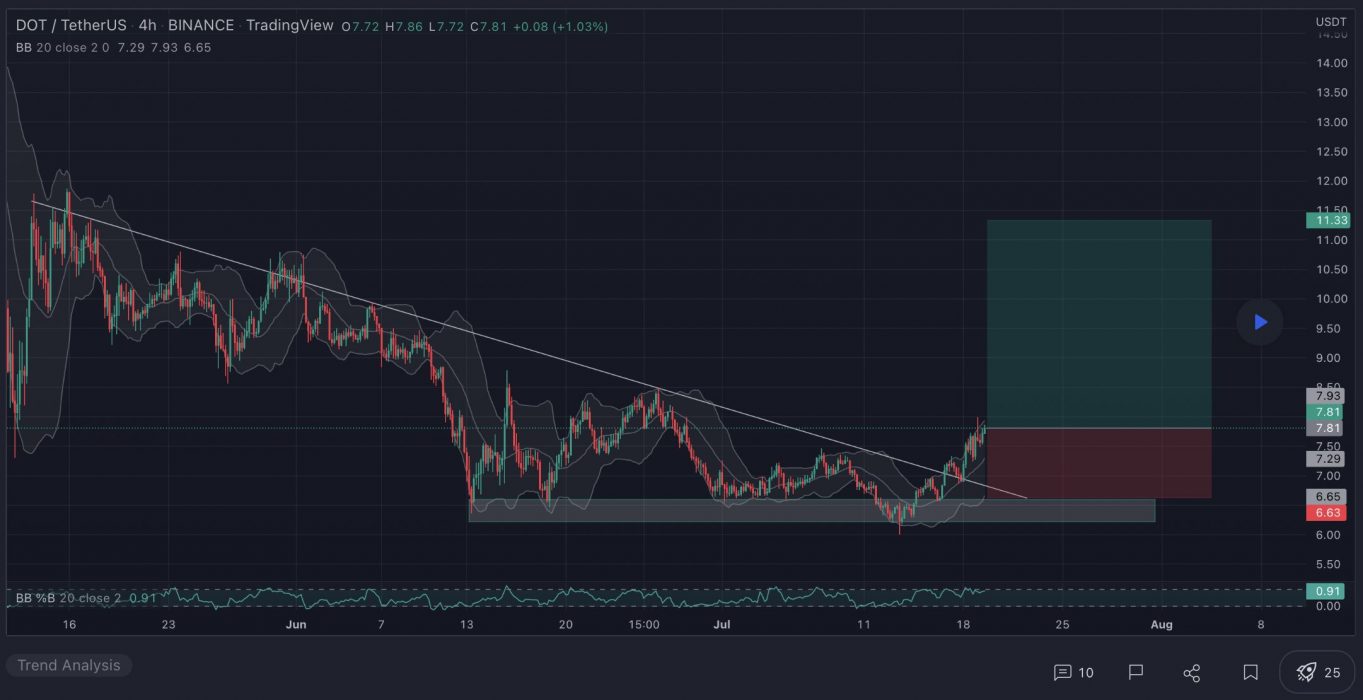
At the time of writing, DOT is ranked the 11th cryptocurrency globally and the current price is US$7.72. Let’s take a look at the chart below for price analysis:

Source: TradingView

DOT has retraced nearly 75% after Q2, showing little sign of interest from buyers.

June’s consolidation at possible support from $9.65 to $7.12 broke down with the rest of the market last month, turning this into likely resistance on future retests. This area now has confluence with the 9 and 18 EMAs.

If market conditions turn and this resistance breaks, an area near the midpoint of Q2 consolidation range, near $8.70, and the monthly high near $10.18 may see profit-taking from bulls.

The first test of possible support near $7.04 has showed some sensitivity. Still, continued bearishness in the market will likely cause a break of this level.

A break of this support might continue to drop to the next possible support near $6.85, running stops under the Q3 2021 swing low. If this level gives support and begins a consolidation forming a bottom, bulls might wait for a wick below to possible support from $6.35 to $6.00.

2. The Graph (GRT)

The Graph GRT is an indexing protocol for querying data for networks like Ethereum and IPFS, powering many applications in both DeFi and the broader Web3 ecosystem. Anyone can build and publish open APIs, called subgraphs, that applications can query using GraphQL to retrieve blockchain data. GRT is a work token that is locked up by Indexers, Curators and Delegators in order to provide indexing and curating services to the network.

GRT Price Analysis

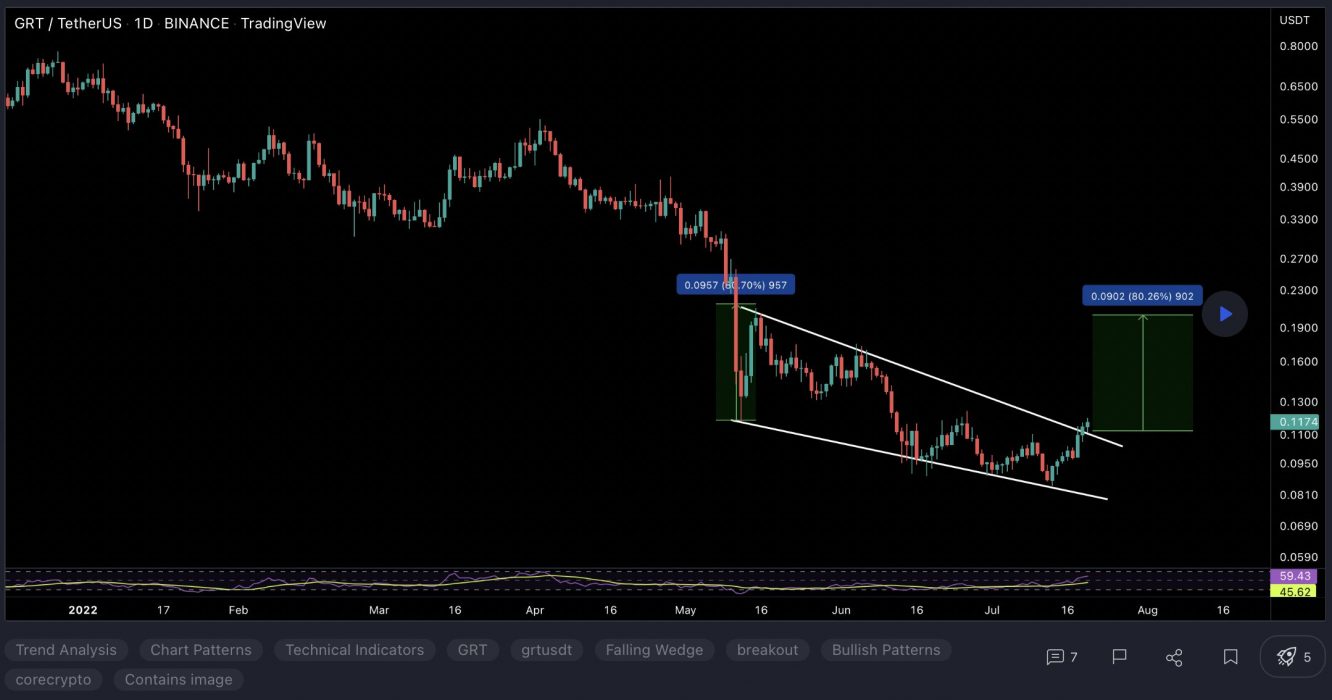
At the time of writing, GRT is ranked the 60th cryptocurrency globally and the current price is US$0.1109. Let’s take a look at the chart below for price analysis:

Source: TradingView

GRT‘s 80% retracement during Q2 set a low near $0.08747 during its consolidation that began in early June.

Relatively equal highs near $0.1435 could be the current target if the price breaks through resistance beginning near $0.1658. Bullish continuation may reach through the next significant swing high near $0.1838 into the daily gap near $0.2173.

If bullish strength continues, the zones just below the previous monthly highs near $0.2343 and $0.2512 could halt any retracement.

A bearish shift in the market might seek the relatively equal lows near $0.1036 into possible support near $0.09872. If this down move occurs, the swing low near $0.09042 and possible support near $0.08624 may be the primary objective.

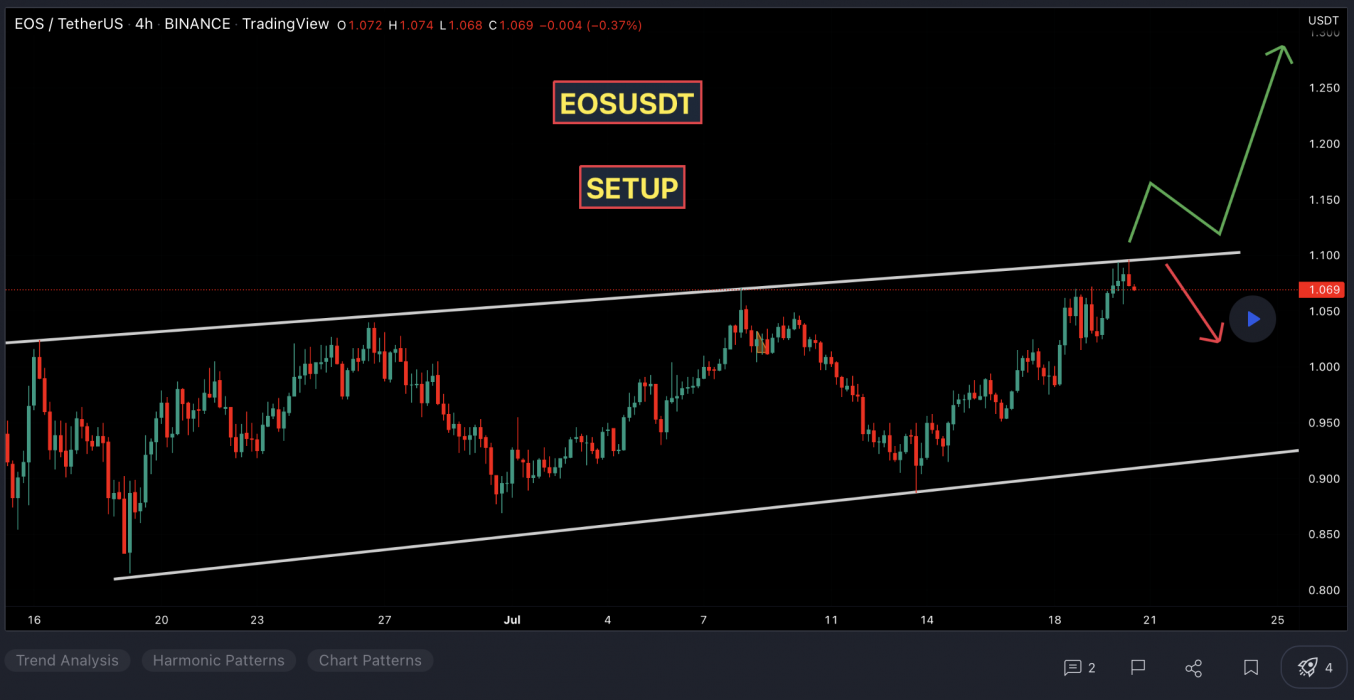
3. Eos (EOS)

EOS is a platform designed to allow developers to build decentralised apps. The project’s goal is relatively simple: to make it as straightforward as possible for programmers to embrace blockchain technology and ensure the network is easier to use than rivals. As a result, tools and a range of educational resources are provided to support developers who want to build functional apps quickly. EOS also aims to improve the experience for users and businesses. While the project tries to deliver greater security and less friction for consumers, it also vies to unlock flexibility and compliance for enterprises.

EOS Price Analysis

At the time of writing, EOS is ranked the 48th cryptocurrency globally and the current price is US$1.07. Let’s take a look at the chart below for price analysis:

Source: TradingView

EOS has plummeted nearly 70% from its April 2022 highs and almost 95% from its May 2021 all-time high.

The closest resistance overlaps with the 8 EMA near $1.25, where the daily chart shows inefficient trading. This level rejected the price’s first retest on May 13.

Slightly higher, $1.41 offers the next noteworthy resistance. This area was inefficiently traded and overlaps with the last significant swing low in mid-March.

Last week, the price bounced from support near $1.00, which could provide support again. This level shows inefficient trading on the monthly chart and is near the midpoint of September 2017’s accumulation.

If this support breaks, bulls could find support near $0.8239. This level is at the bottom of an inefficiently traded area on the monthly and weekly charts. It’s also the high point of October 2017’s accumulation range. However, eager bidders should be cautious as a move this low may be targeting bulls’ stops under the swing low at $0.7430.

Learn How to Trade Live!

Join Dave and The Crypto Den Crew and they’ll show you live on a webinar how to take your crypto trading to the next level.

Where to Buy or Trade Altcoins?

These coins have high liquidity on Binance Exchange, so that could help with trading on AUD/USDT/BTC pairs. And if you’re looking at buying and HODLing cryptos, then Swyftx Exchange is an easy-to-use popular choice in Australia.
Categories
Cardano Crypto News Market Analysis PancakeSwap Solana Trading

Top 3 Coins to Watch Today: ADA, CAKE, SOL – July 20 Trading Analysis

Let’s take a closer look at today’s altcoins showing breakout signals. We’ll explain what the coin is, then dive into the trading charts and provide some analysis to help you decide.

1. Cardano (ADA)

Cardano ADA is a proof-of-stake blockchain platform whose stated goal is to allow “changemakers, innovators, and visionaries” to bring about positive global change. The open-source project also aims to “redistribute power from unaccountable structures to the margins to individuals”, helping to create a society that is more secure, transparent, and fair. Cardano is used by agricultural companies to track fresh produce from field to fork, while other products built on the platform allow educational credentials to be stored in a tamper-proof way, and retailers to clamp down on counterfeit goods.

ADA Price Analysis

At the time of writing, ADA is ranked the 8th cryptocurrency globally and the current price is US$0.5085. Let’s take a look at the chart below for price analysis:

Source: TradingView

From its Q2 high, ADA dropped nearly 75% before finding support near $0.4269. The price has been consolidating since it set this low and is currently testing support near $0.4629. This level has held as support despite the larger market’s sharp downturn since mid-June.

It’s reasonable to expect the price to briefly drop through this level to run bulls’ stops below the swing lows at $0.4006 and $0.3950 before any potential rally. If so, an old accumulation and inefficiently traded area on the weekly chart near $0.3772 could provide support.

If this region holds as support, bulls might find the first resistance near $0.5710. Here, the 40 EMA and an inefficiently traded area converge in the upper half of the local range. 

A break of this resistance may retest resistance just above the June monthly open, near $0.6590. This level holds many bears’ stops, is near old broken support, and is inefficiently traded on the monthly and daily charts.

However, bulls should be cautious of the bearish market conditions and a potential hardfork delay. A break of the two closest support levels could lead to a much more significant drop near $0.3588. This level, near the 2021 yearly open, is inefficiently traded on the monthly and weekly charts.

2. PancakeSwap (CAKE)

PancakeSwap CAKE is an automated market maker (AMM) – a decentralised finance (DeFi) application that allows users to exchange tokens, providing liquidity via farming and earning fees in return. PancakeSwap uses an automated market maker model where users trade against a liquidity pool. These pools are filled by users who deposit their funds into the pool and receive liquidity provider (LP) tokens in return. PancakeSwap allows users to trade BEP20 tokens, provide liquidity to the exchange and earn fees, stake LP tokens to earn CAKE, stake CAKE to earn more CAKE, and stake CAKE to earn tokens of other projects.

CAKE Price Analysis

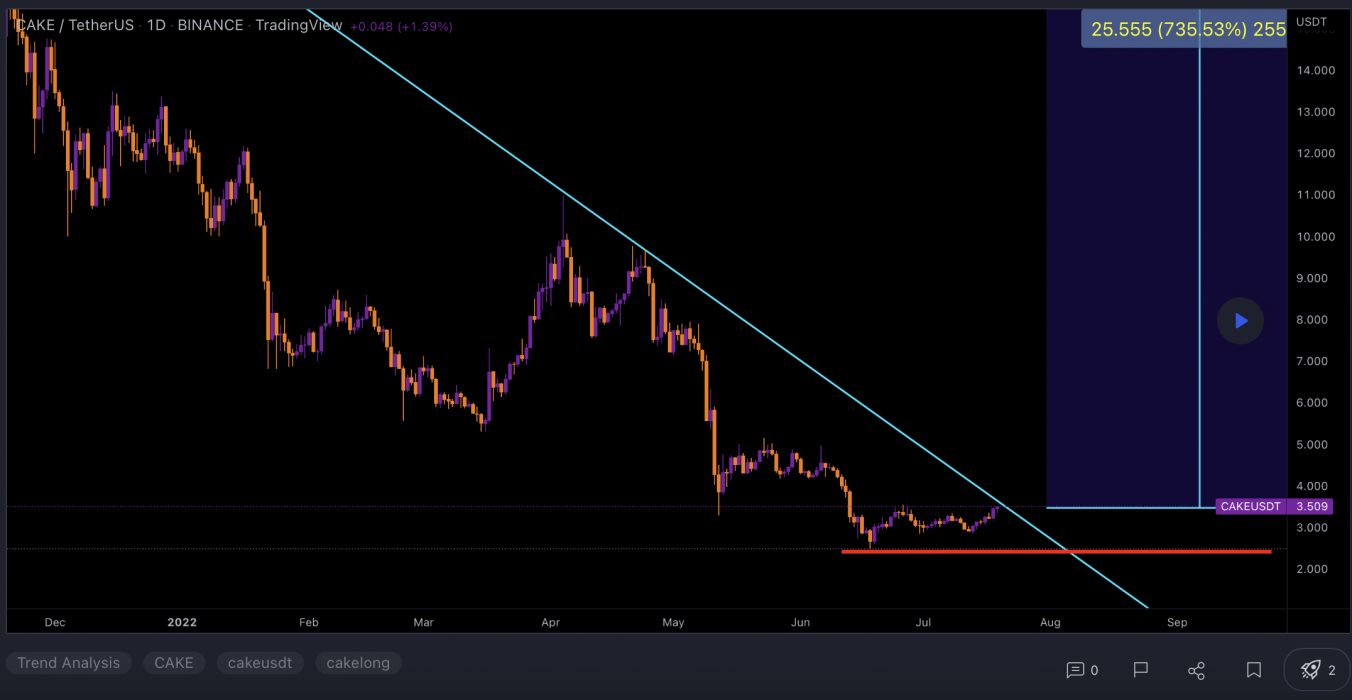
At the time of writing, CAKE is ranked the 78th cryptocurrency globally and the current price is US$3.54. Let’s take a look at the chart below for price analysis:

Source: TradingView

CAKE‘s 79% decline after Q1 created relatively equal lows near $2.96 before bouncing over the local range’s midpoint near $3.60. A bullish altcoin market could help CAKE bulls regain a stronger bullish trend.

Aggressive bulls could look for entries in the daily gap starting near $3.36. The monthly open aligns with more probable support near $3.28. 

A stop run below the monthly open near $3.10 might provide a more favourable entry. A more substantial bearish move – perhaps from a sharp drop in Bitcoin’s price – could challenge support near $2.90, just above the equal lows.

Resistance rests just above, with the zone from $3.95 to $4.27 likely to provide a short-term ceiling. A break through this level might target resistance just under the cluster of relatively equal highs near $4.77. 

Beyond these highs, resistance near $4.98 provides a final challenge before attacking an old daily swing high near $5.42.

3. Solana (SOL)

Solana SOL is a highly functional open-source project that banks on blockchain technology’s permissionless nature to provide decentralised finance (DeFi) solutions. The Solana protocol is designed to facilitate decentralised app (DApp) creation. It aims to improve scalability by introducing a proof-of-history (PoH) consensus combined with the underlying proof-of-stake (PoS) consensus of the blockchain.

SOL Price Analysis

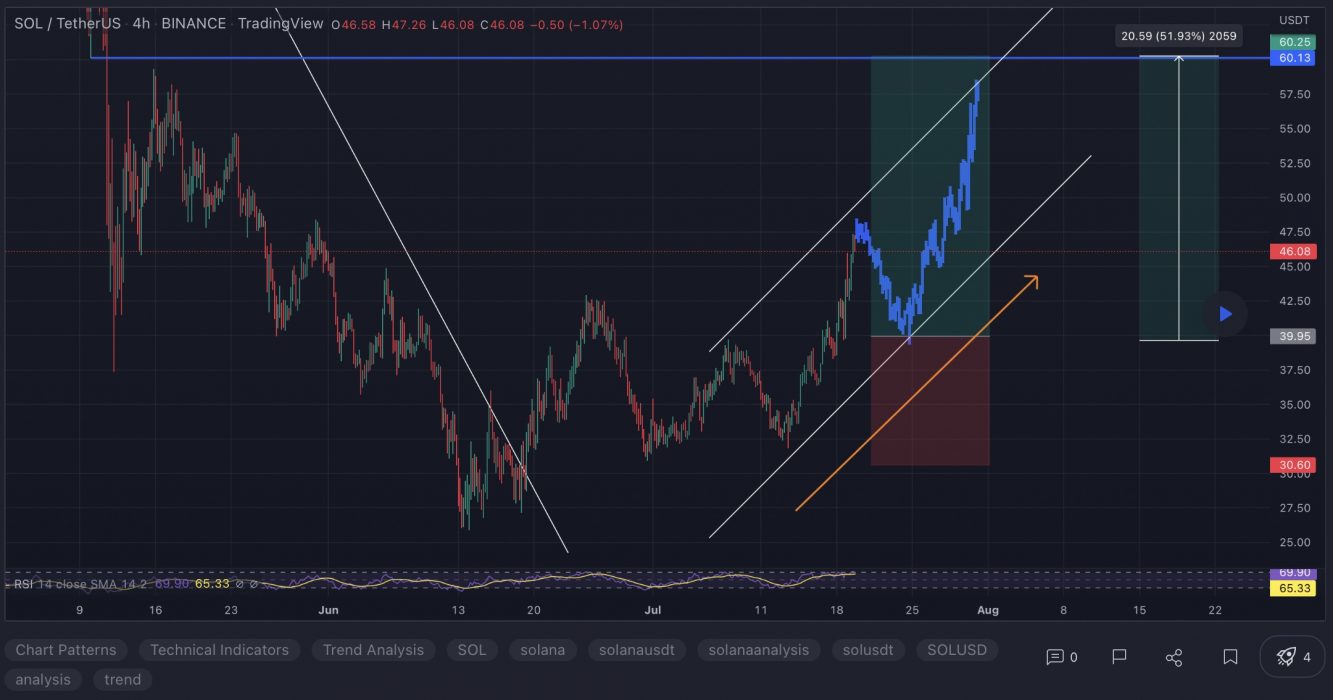
At the time of writing, SOL is ranked the 9th cryptocurrency globally and the current price is US$46.57. Let’s take a look at the chart below for price analysis:

Source: TradingView

SOL has retraced 89% from its Q2 highs and reached possible support last month near $27.34. Resistance might begin near $49.64, which has confluence with the 9 and 18 EMAs.

A more substantial rally might reach near the swing high at $58.23 and the 40 EMA. This high is less likely to break if bears plan to continue the downtrend without a lengthier consolidation.

While not highly probable in the current market conditions, a more animated move upward could reach a wide resistance area between $63.42 and $66.94. This zone is where the last movement down accumulated positions before breaking down. 

Possible support rests near $41.34, which showed sensitivity on the last test. While it could provide support again, the higher-timeframe bearish trend is more likely to propel the price into an inefficient area between $37.10 and $33.54. If the price reaches this zone, the Q1 2021 swing high near $29.12 may mark a more sensitive level.

Learn How to Trade Live!

Join Dave and The Crypto Den Crew and they’ll show you live on a webinar how to take your crypto trading to the next level.

Where to Buy or Trade Altcoins?

These coins have high liquidity on Binance Exchange, so that could help with trading on AUD/USDT/BTC pairs. And if you’re looking at buying and HODLing cryptos, then Swyftx Exchange is an easy-to-use popular choice in Australia.
Categories
Crypto News Decentraland Market Analysis MetisDAO Siacoin Trading

Top 3 Coins to Watch Today: MANA, METIS, SC – July 19 Trading Analysis

Let’s take a closer look at today’s altcoins showing breakout signals. We’ll explain what the coin is, then dive into the trading charts and provide some analysis to help you decide.

1. Decentraland (MANA)

Decentraland MANA defines itself as a virtual reality platform powered by the Ethereum blockchain that allows users to create, experience, and monetise content and applications. In this virtual world, users purchase plots of land that they can later navigate, build on and monetise. Decentraland uses two tokens: MANA and LAND. MANA is an ERC-20 token that must be burned to acquire non-fungible ERC-721 LAND tokens. MANA tokens can also be used to pay for a range of avatars, wearables, names and more on the Decentraland marketplace.

MANA Price Analysis

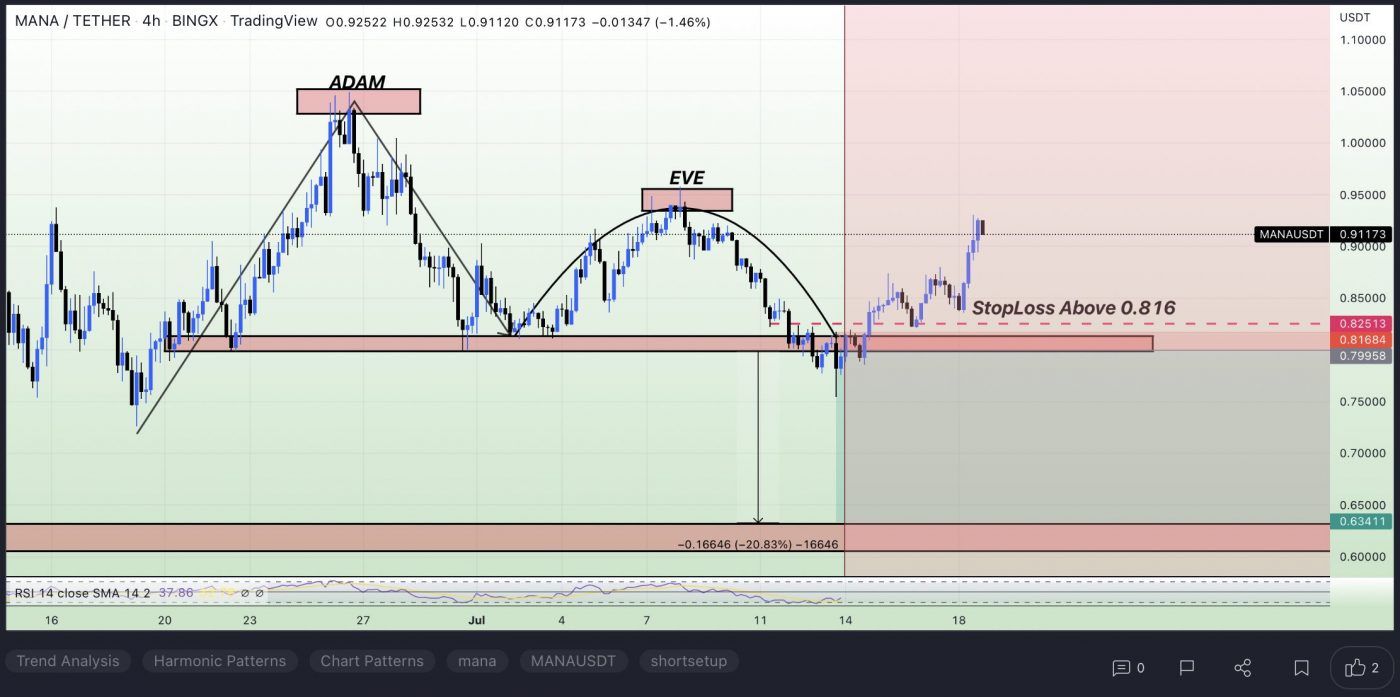
At the time of writing, MANA is ranked the 35th cryptocurrency globally and the current price is US$0.9145. Let’s take a look at the chart below for price analysis:

Source: TradingView

MANA dropped 80% since March 1 and made a low near $0.5800. It has consolidated above this low since May 12.

The price might find support between $0.8808 and $0.8537. This level saw accumulation on July 17, contains the 9 and 18 EMAs, and borders the July monthly open.

A deeper retracement could reach near $0.8290. A drop to this level would rebalance more inefficient trading on the daily chart. It could also run bulls’ stops below today’s opening price and July 16’s swing low.

The price is testing the closest resistance, at $0.8962. Bears entered shorts here before last week’s drop. It’s also near the 40 EMA.

If this resistance breaks, $0.9346 to $0.9923 may provide the next resistance. This area is between the 61.8% and 78.6% retracement of the last month’s downtrend. Bulls also rejected bulls here in late June on the weekly chart.

A more significant rally might reach an area of inefficient trading on the monthly chart from $1.0932 to $1.3375. This move would sweep most bears’ trailed stops above relative equal highs up to this level. Yet, bulls aiming for this level may want to be cautious since the overall trend is still bearish. 

If the downtrend continues, $0.7255 may offer the next support. A drop to this level would run bulls’ stops under the June 18 and July 13 swing lows. It’s an area where bulls have rejected bears many times since September 2021.

Under this level, support might be near the last downswing’s 50% extension, from $0.6290 to $0.5800. Bulls rejected bears here in Q2 2021 on the monthly and weekly charts. Near this level, stops near early May’s and last September’s swing lows give bears an attractive target.

2. MetisDAO (METIS)

METIS is based on the spirit of Optimistic Rollup, building an easy-to-use, highly scalable, low-cost and fully functional Layer 2 framework (Metis Rollup) to fully support the application and business migration from Web 2.0 to Web 3.0. Its scalable protocol supports a wide range of use cases, including NFT platforms, decentralised Reddit-like social platforms, open-source developer communities, influencer communities, gaming communities, freelancer communities, crowdfunding, yield farming, DEX trading, and much more.

METIS Price Analysis

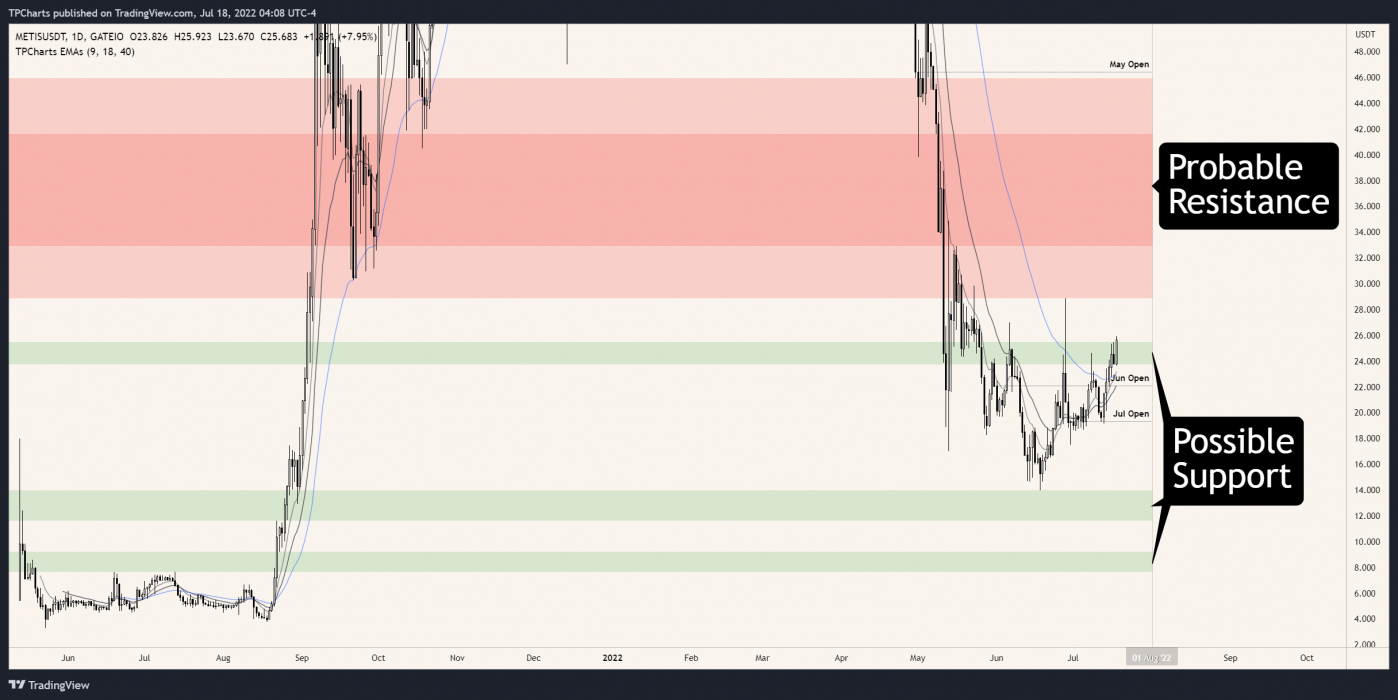
At the time of writing, METIS is ranked the 238th cryptocurrency globally and the current price is US$29.60. Let’s take a look at the chart below for price analysis:

Source: TradingView

METIS plummeted 91% from the end of March to mid-June. Since then, it has consolidated while creeping upwards. This upward movement accelerated last week.

An area between $25.518 and $23.746 should provide the closest support if the bullish rally continues. This level is near the top of early June’s accumulation on the weekly chart. It will also soon contain the 9 EMA.

The closest resistance may be at $28.90. Reaching this level would sweep bears’ stops above June 28’s swing high. Many swing highs above this level could continue attracting the price upward.

An area of inefficient trading on the weekly chart, between $32.955 and $41.634, may be the primary goal for bulls. The top of this range, above $39.518, also shows inefficient trading on the daily chart. It gives bulls a logical place to take profits if the price can reach this far.

Suppose the price resumes the downtrend without reaching significantly higher. In that case, higher timeframes suggest that $14.00 might be the next possible support level. This area, down to $11.641, shows inefficient trading on the monthly and weekly charts. It’s also under the June 18 swing low, giving bears an attractive target for hunting bulls’ stops.

A continued decline might reach a zone between $9.211 and $7.690. This area shows inefficient trading on the monthly and weekly charts. It also borders the July 2021 accumulation zone’s high.

3. Siacoin (SC)

Siacoin SC is the native utility token of Sia, a blockchain-based distributed, decentralised cloud storage platform. Sia acts as a secure, trustless marketplace for cloud storage in which users can lease access to their unused storage space. Agreements and transactions are enforced with smart contracts, and Siacoin is the medium of exchange for paying for storage on the network. The main goal of the project is to become the “backbone storage layer of the internet”.

SC Price Analysis

At the time of writing, SC is ranked the 129th cryptocurrency globally and the current price is US$0.004232. Let’s take a look at the chart below for price analysis:

Source: TradingView

SC crashed 79% from its April high and set a low at $0.003129 in mid-June before beginning a consolidation.

The current price, near $0.004143, could support the next upward move. This level is at the high of late June’s consolidation.

Above, an area near $0.004350 may offer the first resistance. This level is at the bottom of inefficient trading on the weekly and daily charts. It’s also a place where bulls rejected bears in early May.

A move to this level might reach slightly higher. An area of inefficient trading on the weekly chart, between $0.004560 and $0.005242, could prompt a reversal. This area contains the 61.8% retracement and pockets of inefficient trading on the daily chart.

If the rally continues, $0.005963 offers the next logical target for bulls. Moving to this level would sweep bears’ stops above relative equal highs into inefficient trading on the monthly and weekly charts.

Should the downtrend resume, $0.003449 may offer the closest higher-timeframe support. Bulls and bears have taken turns rejecting each other near this level on higher-timeframe charts. It also saw accumulation in December 2020 before a parabolic rally. Reaching this level would sweep bulls’ stops under July 1’s swing low.

A drop to this level could easily reach $0.003140. A move to this level would sweep bulls’ stops under June’s low into the upper half of October 2020’s accumulation.

Learn How to Trade Live!

Join Dave and The Crypto Den Crew and they’ll show you live on a webinar how to take your crypto trading to the next level.

Where to Buy or Trade Altcoins?

These coins have high liquidity on Binance Exchange, so that could help with trading on AUD/USDT/BTC pairs. And if you’re looking at buying and HODLing cryptos, then Swyftx Exchange is an easy-to-use popular choice in Australia.