Categories
Crypto News Market Analysis Tezos Trading Uniswap VeChain

Top 3 Coins to Watch Today: UNI, XTZ, VET – June 20 Trading Analysis

Let’s take a closer look at today’s altcoins showing breakout signals. We’ll explain what the coin is, then dive into the trading charts and provide some analysis to help you decide.

1. Uniswap (UNI)

Uniswap UNI is a popular decentralised trading protocol known for its role in facilitating the automated trading of decentralised finance (DeFi) tokens. Uniswap aims to keep token trading automated and completely open to anyone who holds tokens while improving the efficiency of trading versus that on traditional exchanges. Uniswap creates more efficiency by solving liquidity issues with automated solutions, avoiding the problems that plagued the first decentralised exchanges.

UNI Price Analysis

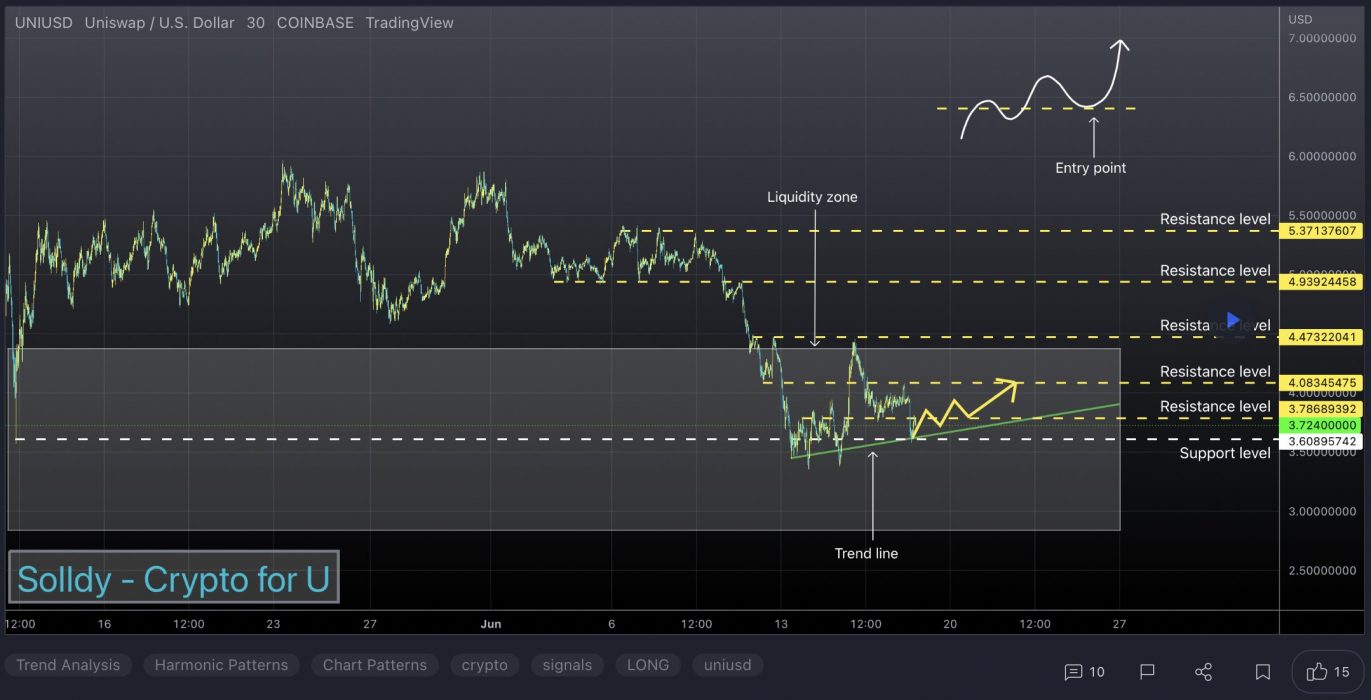
At the time of writing, UNI is ranked the 21st cryptocurrency globally and the current price is US$4.00. Let’s take a look at the chart below for price analysis:
Source: TradingView

UNI‘s 70% retracement from its April highs set a low near $3.65 during its consolidation that began in early May.

Relatively equal highs near $4.46 could be the current target if the price breaks through resistance beginning near $4.97. Bullish continuation might reach through the next significant swing high near $5.26 into the daily gap near $5.47.

If bullish strength continues, the zones just below the monthly open near $5.88 and $6.11 could halt any retracement. 

A bearish shift in the market might seek the relatively equal lows near $3.90 into possible support near $3.62. If this down move occurs, the swing low near $3.43 and possible support near $3.12 may be the primary objective.

2. Tezos (XTZ)

Tezos XTZ is a blockchain network that’s based on smart contracts in a way that’s not too dissimilar to Ethereum. However, there’s a big difference: Tezos aims to offer infrastructure that is more advanced – meaning it can evolve and improve over time without any danger of a hard fork. This is something both Bitcoin and Ethereum have suffered since they were created. People who hold XTZ can vote on proposals for protocol upgrades that have been put forward by Tezos developers.

XTZ Price Analysis

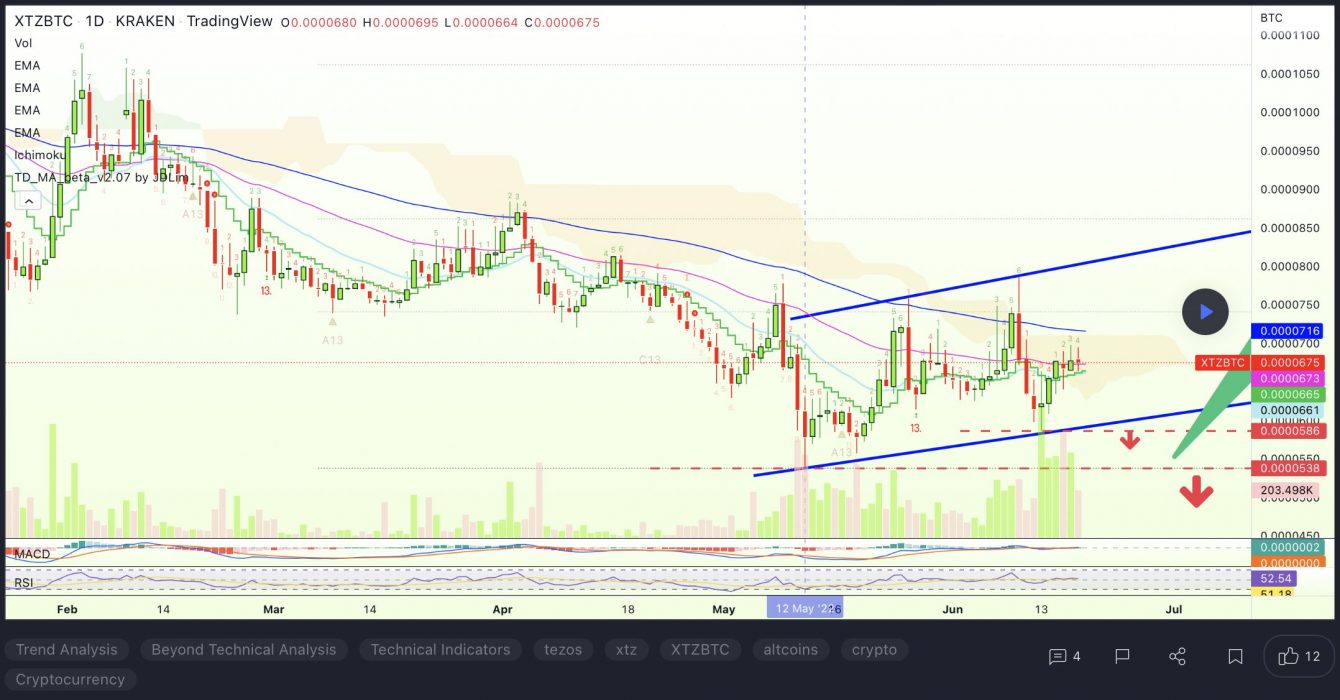
At the time of writing, XTZ is ranked the 38th cryptocurrency globally and the current price is US$1.32. Let’s take a look at the chart below for price analysis:
Source: TradingView

XTZ‘s 70% drop since April saw a second leg after last month’s market-wide drop ran the previous consolidation’s stops.

The level near $2.10 is providing some resistance. However, continuation through the monthly high at $2.18 is not out of the question. Aggressive bulls might bid in the current region near $1.40. 

If the price runs the recent swing low, bulls might bid in the gap near $1.20. A deeper retracement could reach near the early monthly level and a gap near $1.00. The region near $0.93 and $0.84 may also provide some support during a deeper retracement.

3. VeChain (VET)

VeChain VET is a blockchain-powered supply chain platform. VeChain aims to use distributed governance and Internet of Things (IoT) technology to create an ecosystem that solves some of the major problems with supply chain management. The platform uses two in-house tokens, VET and VTHO, to manage and create value based on its VeChainThor public blockchain. The idea is to boost the efficiency, traceability and transparency of supply chains while reducing costs and placing more control in the hands of individual users.

VET Price Analysis

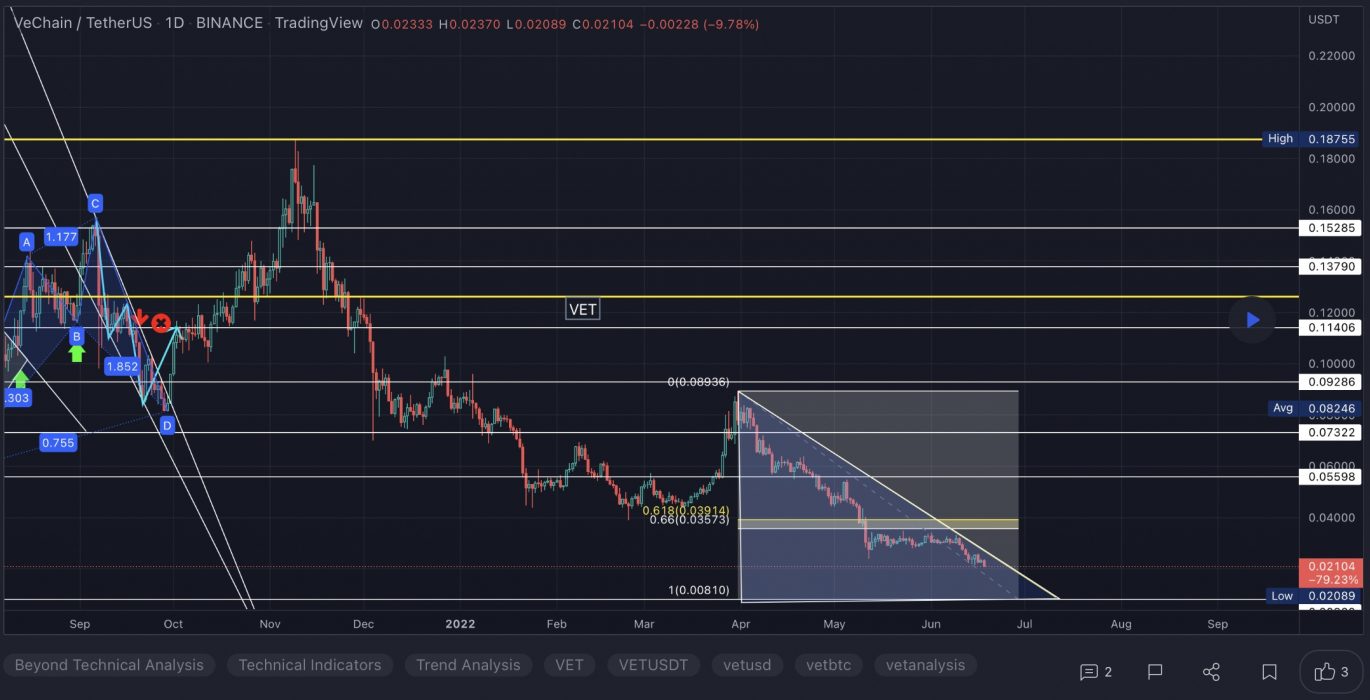
At the time of writing, VET is ranked the 31st cryptocurrency globally and the current price is US$0.02281. Let’s take a look at the chart below for price analysis:
Source: TradingView

VET‘s 50% move during late Q1 ran into resistance near $0.08120, at the 35% extension of the Q1 swing.

An old high and the 18 EMA have provided support near $0.02283 and may give support again on a retest. This area also has confluence with the 55% and 68.9% retracements of November’s swing.

Just below, near $0.02043, the 50.8% retracement of the current Q1 swing might also mark an area of support. 

If the market turns bearish, $0.01742 is unlikely to be revisited but could see interest from bulls during any deeper retracement.

An area near $0.02948, at the 50% extension of the last week swing, could see some profit-taking if bulls break the current resistance near $0.03478. Above, old consolidations near $0.03825 and $0.04372 may also provide some resistance before another round of price discovery.

Learn How to Trade Live!

Join Dave and The Crypto Den Crew and they’ll show you live on a webinar how to take your crypto trading to the next level.

Where to Buy or Trade Altcoins?

These coins have high liquidity on Binance Exchange, so that could help with trading on AUD/USDT/BTC pairs. And if you’re looking at buying and HODLing cryptos, then Swyftx Exchange is an easy-to-use popular choice in Australia.

Categories
Avalanche Crypto News Litecoin Market Analysis Ripple Trading

Top 3 Coins to Watch Today: LTC, AVAX, XRP – June 17 Trading Analysis

Let’s take a closer look at today’s altcoins showing breakout signals. We’ll explain what the coin is, then dive into the trading charts and provide some analysis to help you decide.

1. Litecoin (LTC)

Litecoin LTC is a cryptocurrency designed to provide fast, secure and low-cost payments by leveraging the unique properties of blockchain technology. The cryptocurrency was created based on the Bitcoin protocol but it differs in terms of the hashing algorithm used, hard cap, block transaction times, and a few other factors. Litecoin has a block time of just 2.5 minutes and extremely low transaction fees, making it suitable for micro-transactions and point-of-sale payments.

LTC Price Analysis

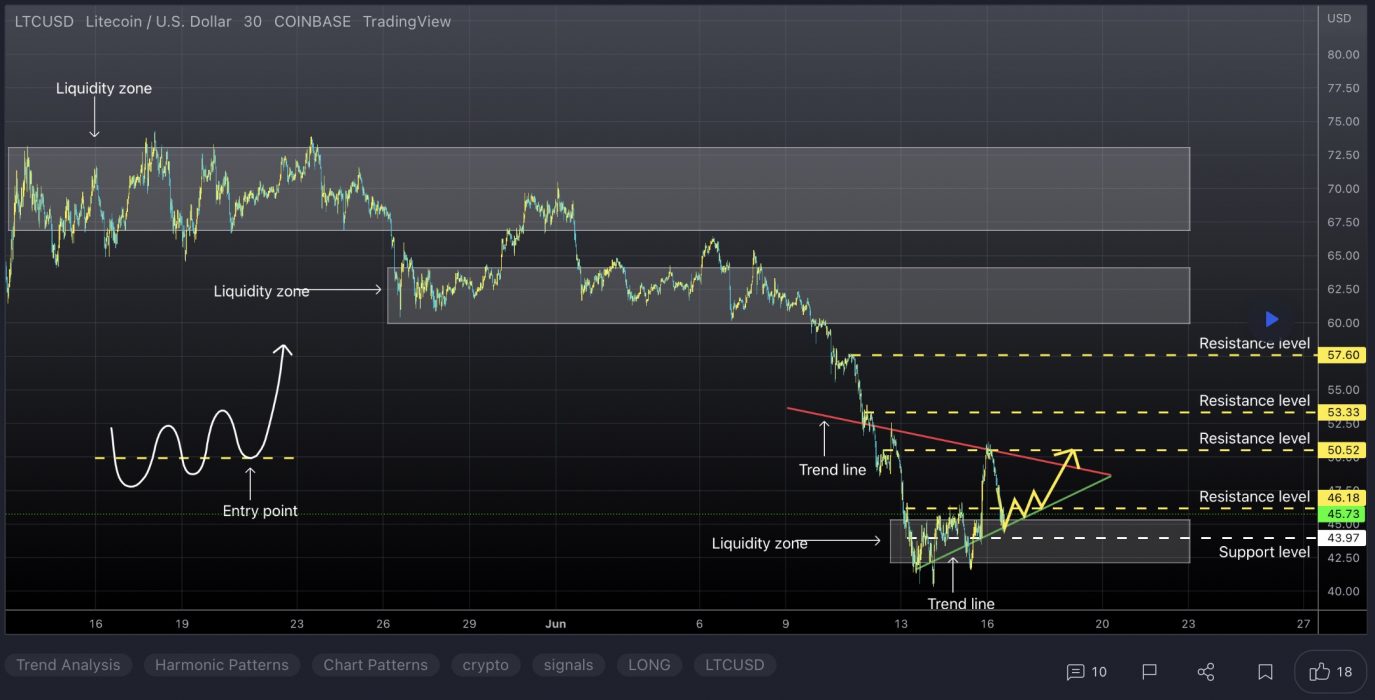
At the time of writing, LTC is ranked the 18th cryptocurrency globally and the current price is US$45.81. Let’s take a look at the chart below for price analysis:

Source: TradingView

After setting a low last week, LTC kicked off a with recovery trend to break the weekly highs.

The following 70% plummet found support near $40.36, sweeping under the 40 EMA into the 61.8% retracement level before bouncing to resistance beginning at $52.73.

This area could continue to provide resistance, possibly causing a retracement to the 9 EMA and 18 EMA near $60.12, where aggressive bulls might begin bidding. The level near $69.18, which has confluence with the 40 EMA, may see more interest from bulls loading up for an attempt on probable resistance beginning near $75.13. 

However, if Bitcoin continues its sideways trend, much lower prices could be seen. The old support near $40.18 could provide at least a short-term bounce. If this level fails, the old monthly lows near $37.23 may also give support and see the start of a new bullish cycle after retesting these support levels.

2. Avalanche (AVAX)

Avalanche AVAX is the fastest smart contracts platform in the blockchain industry, as measured by time-to-finality, and has the most validators securing its activity of any proof-of-stake protocol. Avalanche is also low-cost, and green. Any smart contract-enabled application can outperform its competition on Avalanche. AVAX is the native token of Avalanche. It is a hard-capped, scarce asset that is used to pay for fees, secure the platform through staking, and provide a basic unit of account between the multiple subnets created on Avalanche.

AVAX Price Analysis

At the time of writing, AVAX is ranked the 16th cryptocurrency globally and the current price is US$16.27. Let’s take a look at the chart below for price analysis:

Source: TradingView

AVAX‘s gains in Q2 ended with an almost 71% retracement as the rest of the altcoin market dropped from early this month. Bulls stepped in near the 62.8% retracement of Q2’s move, creating a consolidation that ended with the bullish impulse to resistance near $34.35.

With the 9, 18 and 40 EMAs stacked bullish and a bullish higher-timeframe trend, it’s reasonable to anticipate retracement to possible support before further bullish expansion. 

Near the 40 EMA, a broad zone from $19.15 to $17.45 could see interest from bulls before further expansion. Bears might capitalise on any sharp moves down in Bitcoin, aiming for possible support near the 75% retracement, at $16.70, and potentially lower to a higher-timeframe support zone between $14.42 and $13.80.

If the higher-timeframe recovery trend resumes and the current resistance near $22.35 breaks, the wicks near $26.84 and the new monthly highs may see profit-taking.

3. Ripple (XRP)

Ripple XRP is the currency that runs on a digital payment platform called RippleNet, on top of a distributed ledger database called XRP Ledger. While RippleNet is run by a company called Ripple, the XRP Ledger is open-source and not based on a blockchain, but rather the aforementioned distributed ledger database.

XRP Price Analysis

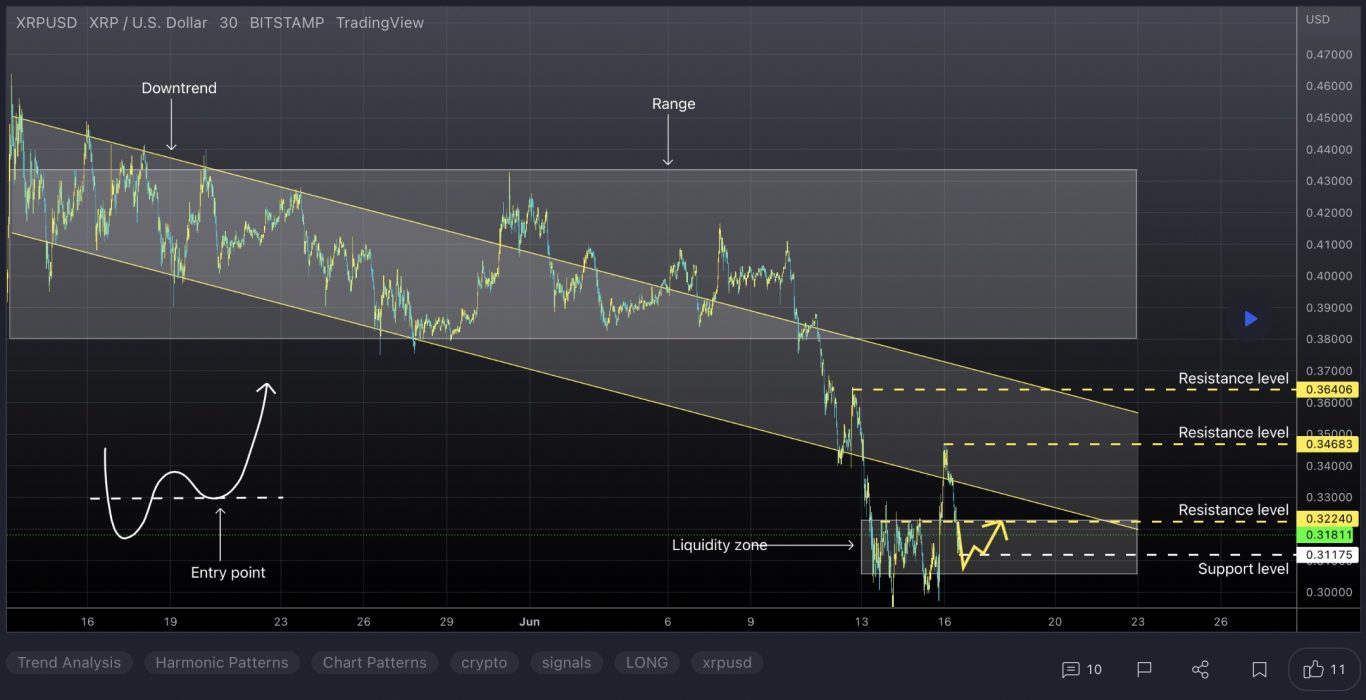
At the time of writing, XRP is ranked the 8th cryptocurrency globally and the current price is US$0.3199. Let’s take a look at the chart below for price analysis:

Source: TradingView

XRP printed some gains during Q1 and Q2 after moving sideways for the past few weeks. The price is in a downtrend, with the 9, 18 and 40 EMAs providing resistance on each attempt to rally.

However, bulls are showing some interest at the 80.6% retracement, near $0.3472. If this level breaks, a move into possible support – just below the lows near $0.2952 – seems likely.

If the price does rally through the swing high at $0.3855 – perhaps triggered by a sudden surge in Bitcoin – bulls might find some resistance at the 61.8% retracement level near $0.4150. 

Overlapping swing highs and lows near $0.4526 might provide the next target, where bears immediately forced the price down in late December.

More bullish market conditions could shift targets up near the midpoint of Q1’s consolidation, near $0.5017, where higher timeframes show an inefficiently traded zone.

Learn How to Trade Live!

Join Dave and The Crypto Den Crew and they’ll show you live on a webinar how to take your crypto trading to the next level.

Where to Buy or Trade Altcoins?

These coins have high liquidity on Binance Exchange, so that could help with trading on AUD/USDT/BTC pairs. And if you’re looking at buying and HODLing cryptos, then Swyftx Exchange is an easy-to-use popular choice in Australia.

Categories
Crypto News Fantom Market Analysis Polygon The Sandbox Trading

Top 3 Coins to Watch Today: MATIC, FTM, SAND – June 16 Trading Analysis

Let’s take a closer look at today’s altcoins showing breakout signals. We’ll explain what the coin is, then dive into the trading charts and provide some analysis to help you decide.

1. Polygon (MATIC)

Polygon MATIC is the first well-structured, easy-to-use platform for Ethereum scaling and infrastructure development. Its core component is Polygon SDK, a modular, flexible framework that supports building multiple types of applications. The MATIC token will continue to exist and will play an increasingly important role in securing the system and enabling governance.

MATIC Price Analysis

At the time of writing, MATIC is ranked the 20th cryptocurrency globally and the current price is US$0.3749. Let’s take a look at the chart below for price analysis:

Source: TradingView

Since its Q1 highs, MATIC has been in a steady bearish trend, retracing nearly 75%. The price found support near $0.3520, at the 65.8% retracement level.

Last week’s sharp impulse up might have marked the start of a new trend. If so, higher timeframes suggest that $0.3639, near the 65.8% retracement and the 9, 18 and 40 EMAs, may see interest from bulls. The price could reach lower, near $0.3320, and still find support.

Currently, the price is contesting a region between $0.3039 and $0.3135. Closes over this level could confirm it as new support, leading to a move higher.

However, bulls are contending with probable resistance near $0.4631, while $0.5470 is also likely to be sensitive with the nearest support and resistance this close together.

2. Fantom (FTM)

Fantom FTM is a directed acyclic graph (DAG) smart contract platform providing decentralised finance (DeFi) services to developers using its own bespoke consensus algorithm. Together with its in-house token FTM, Fantom aims to solve problems associated with smart-contract platforms – specifically transaction speed, which developers say they have reduced to under two seconds.

FTM Price Analysis

At the time of writing, FTM is ranked the 64th cryptocurrency globally and the current price is US$0.2189. Let’s take a look at the chart below for price analysis:

Source: TradingView

FTM‘s bounce during Q2 ran into resistance near the old monthly highs. This rejection created a set of relatively equal highs near $0.4267, possibly forming the next bullish leg’s target.

Currently, the price is testing possible support near the weekly open, around $0.2061. This level also has confluence with the 80.6% retracement of the current local range and the 18 and 40 EMAs. 

If this level fails to provide support, a zone from $0.1834 to $0.1730 might mark a possible swing low or consolidation area. This zone is between the 65.8% and 78.6% retracement of August 2021’s swing.

A more bearish tone in the market could propel the price lower. The lows, near $0.1530, may mark an area of possible support as well as a bearish target.

3. The Sandbox (SAND)

The Sandbox SAND is a blockchain-based virtual world allowing users to create, build, buy and sell digital assets in the form of a game. By combining the powers of decentralised autonomous organisations (DAOs) and non-fungible tokens (NFTs), the Sandbox creates a decentralised platform for a thriving gaming community. The Sandbox employs the powers of blockchain technology by introducing the SAND utility token, which facilitates transactions on the platform.

SAND Price Analysis

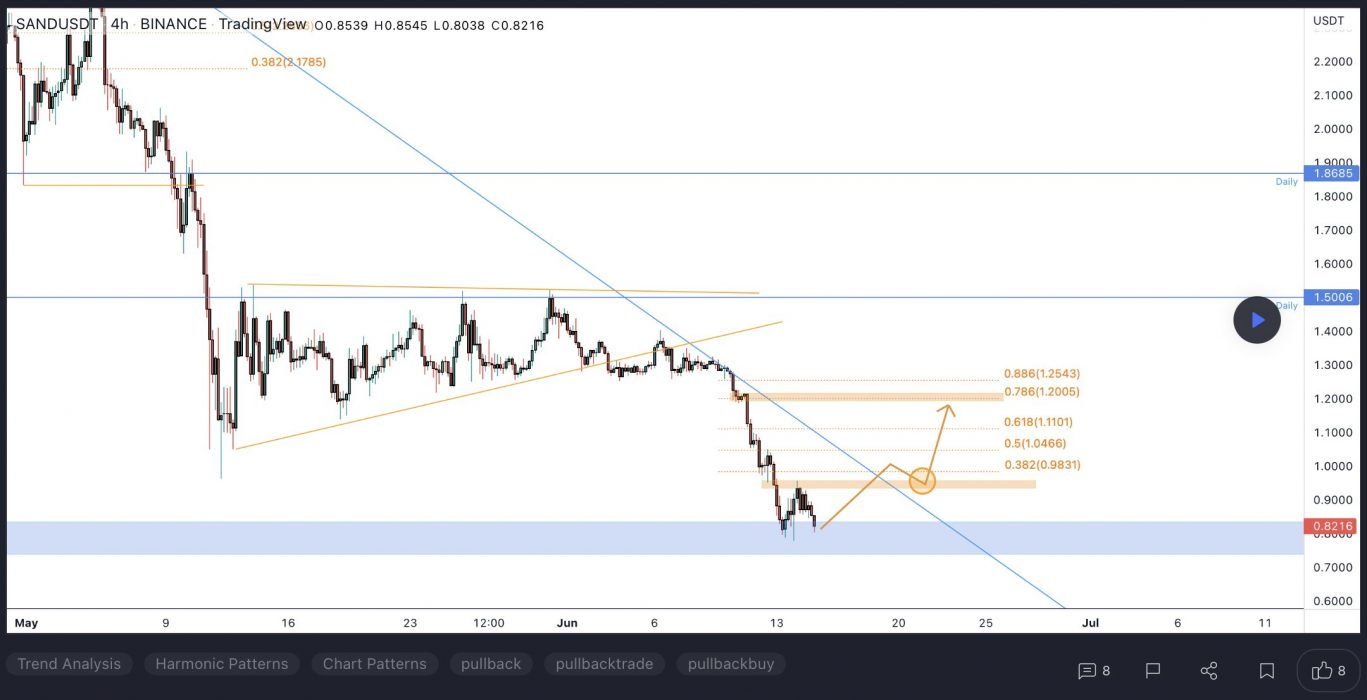
At the time of writing, SAND is ranked the 42nd cryptocurrency globally and the current price is US$0.8427. Let’s take a look at the chart below for price analysis:

Source: TradingView

SAND‘s impressive gains during Q1 halted at $2.38 before retracing 80% of the move. This price action created several areas of possible higher-timeframe resistance in the process.

The price found resistance on its last swing upward near $1.15 – an area that could provide resistance again. If this swing high breaks, the price might find resistance near $1.26. If this area does provide resistance, it would suggest the formation of a higher-timeframe consolidation.

The fast move up left little higher-timeframe support. However, a vast zone between $0.8890 and $0.8146 has provided support before and could give support again on a retest. This zone is between the 71.8%-to-88.6% retracement levels of 2021 Q4’s parabolic move.

Continuation downward through this level, especially if the overall market remains bearish, could retrace most of Q2’s move to the next higher-timeframe support near $0.7055.

Learn How to Trade Live!

Join Dave and The Crypto Den Crew and they’ll show you live on a webinar how to take your crypto trading to the next level.

Where to Buy or Trade Altcoins?

These coins have high liquidity on Binance Exchange, so that could help with trading on AUD/USDT/BTC pairs. And if you’re looking at buying and HODLing cryptos, then Swyftx Exchange is an easy-to-use popular choice in Australia.

Categories
Axie Infinity Cardano Crypto News Market Analysis Solana Trading

Top 3 Coins to Watch Today: SOL, ADA, AXS – June 15 Trading Analysis

Let’s take a closer look at today’s altcoins showing breakout signals. We’ll explain what the coin is, then dive into the trading charts and provide some analysis to help you decide.

1. Solana (SOL)

Solana SOL is a highly functional open-source project that banks on blockchain technology’s permissionless nature to provide decentralised finance (DeFi) solutions. The Solana protocol is designed to facilitate decentralised app (DApp) creation. It aims to improve scalability by introducing a proof-of-history (PoH) consensus combined with the underlying proof-of-stake (PoS) consensus of the blockchain.

SOL Price Analysis

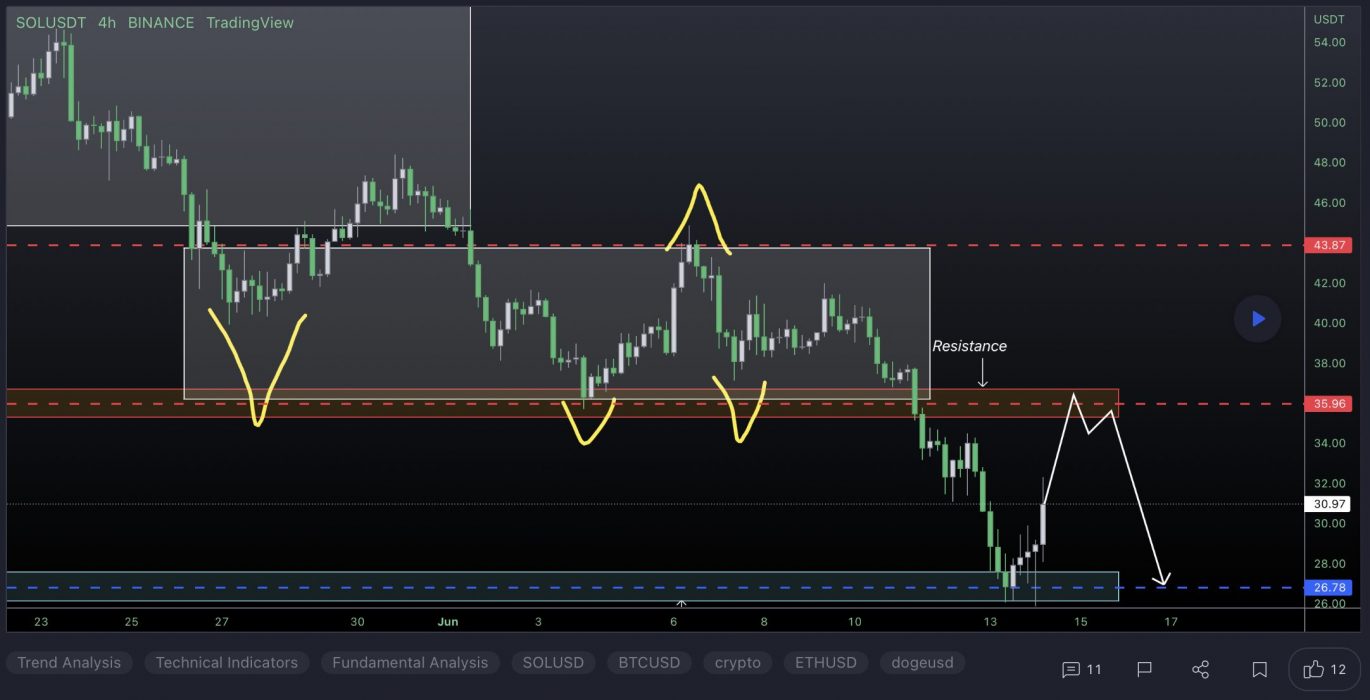
At the time of writing, SOL is ranked the 9th cryptocurrency globally and the current price is US$30.10. Let’s take a look at the chart below for price analysis:

Source: TradingView

SOL has retraced 87% from its Q2 highs and reached possible support last week near $26.34. Resistance might begin near $33.64, which has confluence with the 9 and 18 EMAs.

A more substantial rally might reach near the swing high at $37.23 and the 40 EMA. This high is less likely to break if bears plan to continue the downtrend without a lengthier consolidation.

While not highly probable in the current market conditions, a more animated move upward could reach a wide resistance area between $40.42 and $45.94. This zone is where the last movement down accumulated positions before breaking down. 

Possible support rests near $25.34, which showed sensitivity on the last test. While it could provide support again, the higher-timeframe bearish trend is more likely to propel the price into an inefficient area between $23.10 and $20.54. If the price reaches this zone, the Q1 2021 swing high near $17.12 might mark a more sensitive level.

2. Cardano (ADA)

Cardano ADA is a proof-of-stake blockchain platform whose stated goal is to allow “changemakers, innovators, and visionaries” to bring about positive global change. The open-source project also aims to “redistribute power from unaccountable structures to the margins to individuals”, helping to create a society that is more secure, transparent, and fair. Cardano is used by agricultural companies to track fresh produce from field to fork, while other products built on the platform allow educational credentials to be stored in a tamper-proof way, and retailers to clamp down on counterfeit goods.

ADA Price Analysis

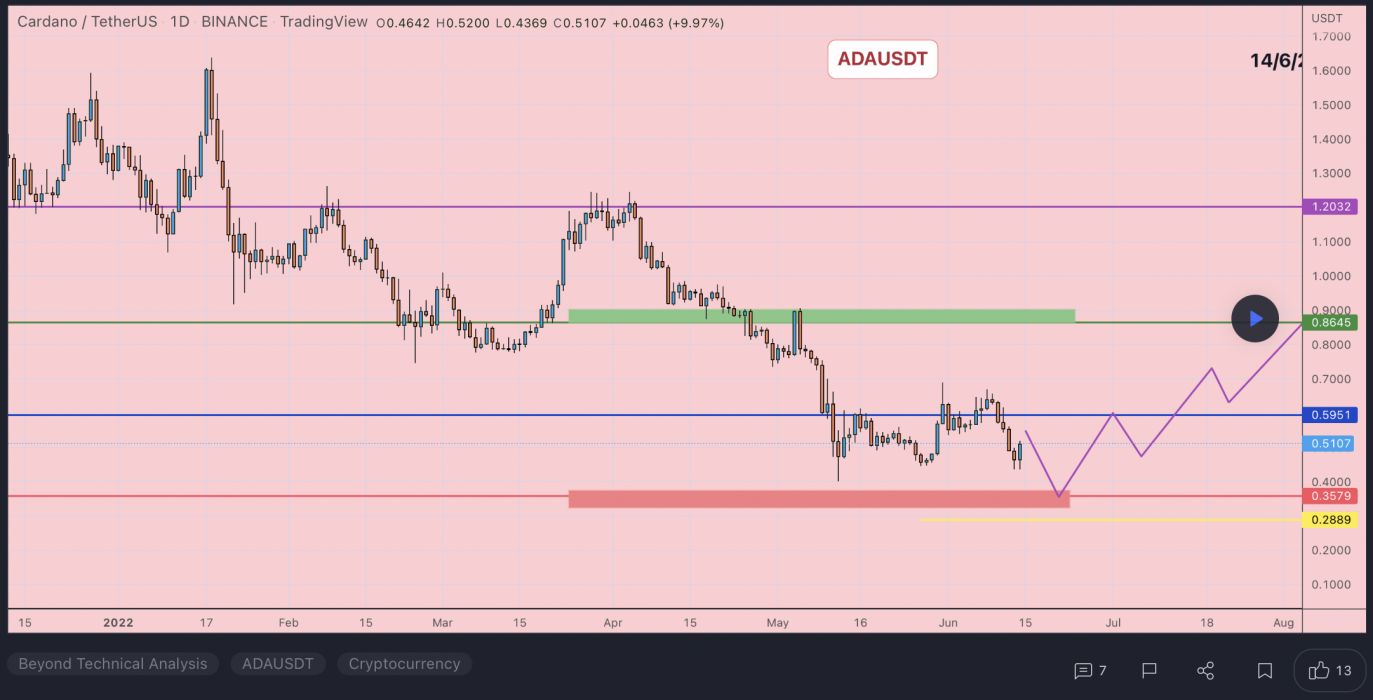
At the time of writing, ADA is ranked the 7th cryptocurrency globally and the current price is US$0.4951. Let’s take a look at the chart below for price analysis:

Source: TradingView

ADA‘s near 60% drop during Q2 found a low near $0.4335 during early June before closing over a short-term high.

This daily close over the high could signal a shift in market structure that may reach probable resistance near $0.5915. A sustained bullish move may target the swing high at $0.6322. If this stop run occurs, a run beyond the high into probable resistance near $0.7210 and $0.7719 is possible.

Bulls could buy a retracement to possible support near $0.4570, just above the weekly open. A bearish turn in the marketplace may propel the price toward possible support near $0.4325. 

However, relatively equal lows near $0.4057 and $0.3922 provide an attractive target for bears if the market resumes its bearish trend. A run on these lows might find support between $0.3647 and $0.3552.

3. Axie Infinity (AXS)

Axie Infinity AXS is a blockchain-based trading and battling game that is partially owned and operated by its players. The Axie Infinity ecosystem has its own unique governance token, known as Axie Infinity Shards AXS. These are used to participate in key governance votes and give holders a say in how funds in the Axie Community Treasury are spent.

AXS Price Analysis

At the time of writing, AXS is ranked the 49th cryptocurrency globally and the current price is US$14.05. Let’s take a look at the chart below for price analysis:

Source: TradingView

AXS‘s relatively small 20% range could suggest that a recovery is setting up in June.

Aggressive bulls could look for entries at the most recent area of support formed near $13.34. However, equal lows near $12.42 make a tempting target for a stop run into this support. This move could reach support near $11.90. 

A decisive move to the downside could run stops below the second set of relatively equal lows near $11.20, possibly reaching support at an old swing high and a daily gap near $10.58.

A recent level near $17.84 provided resistance and caused a swing high to form near $19.88, offering first targets. A move through this high may arrive at new monthly high levels near $20.31 and $23.50.

Learn How to Trade Live!

Join Dave and The Crypto Den Crew and they’ll show you live on a webinar how to take your crypto trading to the next level.

Where to Buy or Trade Altcoins?

These coins have high liquidity on Binance Exchange, so that could help with trading on AUD/USDT/BTC pairs. And if you’re looking at buying and HODLing cryptos, then Swyftx Exchange is an easy-to-use popular choice in Australia.
Categories
Crypto News Market Analysis Ocean Protocol THORChain Trading Tranchess

Top 3 Coins to Watch Today: OCEAN, RUNE, CHESS – June 14 Trading Analysis

Let’s take a closer look at today’s altcoins showing breakout signals. We’ll explain what the coin is, then dive into the trading charts and provide some analysis to help you decide.

1. Ocean Protocol (OCEAN)

Ocean Protocol OCEAN is a blockchain-based ecosystem that allows individuals and businesses to easily unlock the value of their data and monetise it through the use of ERC-20 based datatokens. OCEAN is a utility token that is used for community governance and staking on data, in addition to buying and selling data as the basic unit of exchange on the Ocean Market. The price of these datatokens is set by an OCEAN-datatoken AMM pool, which adjusts the price of the datatoken as it is bought and sold based on supply and demand.

OCEAN Price Analysis

At the time of writing, OCEAN is ranked the 153rd cryptocurrency globally and the current price is US$0.1984. Let’s take a look at the chart below for price analysis:

Source: TradingView

OCEAN dropped 75% from its March high before beginning a consolidation in mid-May.

Inefficient trading, the base of June 7’s rally, and the 9 and 18 EMAs could offer resistance just over the June monthly open, near $0.2317.

A rally higher might target the June 9 swing high near $0.3190. Bears’ stops above this high and the inefficiently traded area on the daily, weekly and monthly charts could serve as a target and resistance.

Bulls might find support near $0.1928. If this level supports the price, it will most likely be after a sweep of the relatively equal lows in this area. 

Longer-term, the bearish higher-timeframe trend and market conditions make it likely that the price will continue dropping and reach near $0.1530. Some weekly charts show inefficient trading in this area.

If this level fails, bulls might find more substantial support near $0.0867. This area is the last accumulation on the monthly chart before July 2020’s stunning rally. It’s also near the low end of a large, inefficiently traded area on the monthly chart.

2. THORChain (RUNE)

ThorChain RUNE is a decentralised liquidity protocol that allows users to easily exchange cryptocurrency assets across a range of networks without losing full custody of their assets in the process. The native utility token of the THORChain platform is RUNE. This is used as the base currency in the THORChain ecosystem and is also used for platform governance and security as part of THORChain’s Sybil resistance mechanisms – since THORChain nodes must commit a minimum of 1 million RUNE to participate in its rotating consensus process.

RUNE Price Analysis

At the time of writing, RUNE is ranked the 62nd cryptocurrency globally and the current price is US$1.90. Let’s take a look at the chart below for price analysis:

Source: TradingView

RUNE has dropped 84% from its March high. It’s currently breaking down from its consolidation range formed in May and early June.

The price might find its closest resistance in an inefficiently traded area on the daily chart between $2.426 and $2.244. This level has confluence with the May 27 swing low.

The price may be forming a triple-sweep (three lower lows) before returning into its consolidation range. If so, an inefficiently traded area near $2.657 could provide another resistance. This level also shows distribution on the weekly chart near the 18 EMA.

A more extended rally could reach an inefficiently traded area on the monthly chart between $3.295 and $3.998. Yet this is less likely to happen soon, given the current bearish market conditions.

Below, $1.554 could offer support. This level is an area of inefficient trading below a daily swing low from January 2021. It also shows accumulation on the weekly.

The following daily swing low, near $1.120, could offer the next bearish target. This level shows inefficient trading on the daily and weekly charts.

If the bearish trend continues, it may be targeting an area of old inefficient trading on the monthly chart between $0.761 and $0.630. The price might sweep under the low end of this range to remove bulls’ stops under the monthly swing low. Overall, this area shows accumulation on the monthly and could provide the base for a longer-term bullish shift.

3. Tranchess (CHESS)

Tranchess CHESS is a yield-enhancing asset tracker with varied risk-return solutions. Tranchess provides a different risk/return matrix out of a single main fund that tracks a specific underlying asset. The name Tranchess was inspired by the game of chess, as well as the French word “Tranche”, which is often associated with tranche funds that cater to a different class of investors with varying risk appetite. Tranchess was launched on June 24, 2021. The project leverages on smart contracts, making it transparent and automated across processes.

CHESS Price Analysis

At the time of writing, CHESS is ranked the 536th cryptocurrency globally and the current price is US$0.2716. Let’s take a look at the chart below for price analysis:

Source: TradingView

CHESS dropped 84% from its early April swing high before beginning a consolidation range in mid-May.

Most trading occurred between the June monthly open and $0.270. Here, relatively equal lows have formed under the oldest historical low, around $0.367.

These lows might serve as a magnet for a stop run reaching near the last swing low, between $0.256 and $0.230. Traders “selling the news” of June 16’s launch might push the price below these lows.

A continued move down could run more bulls’ stops below May’s low at $0.2040.

No historical price action exists under May’s low to pinpoint possible support. 

Round numbers suggest that $0.175 could offer some support on an initial stop run under May’s low. 

Below this level, the 50% and 100% extensions (projected from two swings in the current range) overlap near $0.050. This confluence could offer a weak hint at another possible support. Bulls should be highly cautious given the bearish chart and market conditions.

Learn How to Trade Live!

Join Dave and The Crypto Den Crew and they’ll show you live on a webinar how to take your crypto trading to the next level.

Where to Buy or Trade Altcoins?

These coins have high liquidity on Binance Exchange, so that could help with trading on AUD/USDT/BTC pairs. And if you’re looking at buying and HODLing cryptos, then Swyftx Exchange is an easy-to-use popular choice in Australia.

Categories
Crypto News Market Analysis NEO Shiba Inu Trading TRON

Top 3 Coins to Watch Today: TRX, NEO, SHIB – June 13 Trading Analysis

Let’s take a closer look at today’s altcoins showing breakout signals. We’ll explain what the coin is, then dive into the trading charts and provide some analysis to help you decide.

1. Tron (TRX)

Tron TRX is a blockchain-based operating system that aims to ensure this technology is suitable for daily use. Whereas Bitcoin can handle up to six transactions per second, and Ethereum up to 25, TRON claims that its network has a capacity for 2,000 TPS. This project is best described as a decentralised platform focused on content sharing and entertainment, and to this end, one of its biggest acquisitions was the file-sharing service BitTorrent in 2018. Overall, TRON has divided its goals into six phases. These include delivering simple distributed file sharing, and driving content creation through financial rewards.

TRX Price Analysis

At the time of writing, TRX is ranked the 13th cryptocurrency globally and the current price is US$0.07827. Let’s take a look at the chart below for price analysis:

Source: TradingView

TRX accompanied the rest of the market during the Q2 drop, falling nearly 45% from early May until it found a low last week.

Price action formed a weekly support level near $0.06654, which has so far held up the price. The most recent swing low inside this range, near $0.06249, might be the target for any future stop runs. After this low, the swing low near $0.05789 and the gap beginning near $0.05126 mark possible higher-timeframe support.

The price is currently battling with significant higher-timeframe resistance levels, with the closest probable resistance resting near $0.08892, just over the previous monthly open. A sweep of the relatively equal highs above this resistance might find sellers near $0.09535, but could reach as high as $0.1173.

2. Neo (NEO)

NEO bills itself as a “rapidly growing and developing” ecosystem with the goal of becoming the foundation for the next generation of the internet – a new economy where digitised payments, identities and assets come together. As well as drawing a worldwide community of developers who create new infrastructure for the network and lower barriers to entry, the team behind this project operates an EcoBoost initiative that’s designed to encourage people to build decentralised apps and smart contracts on its blockchain.

NEO Price Analysis

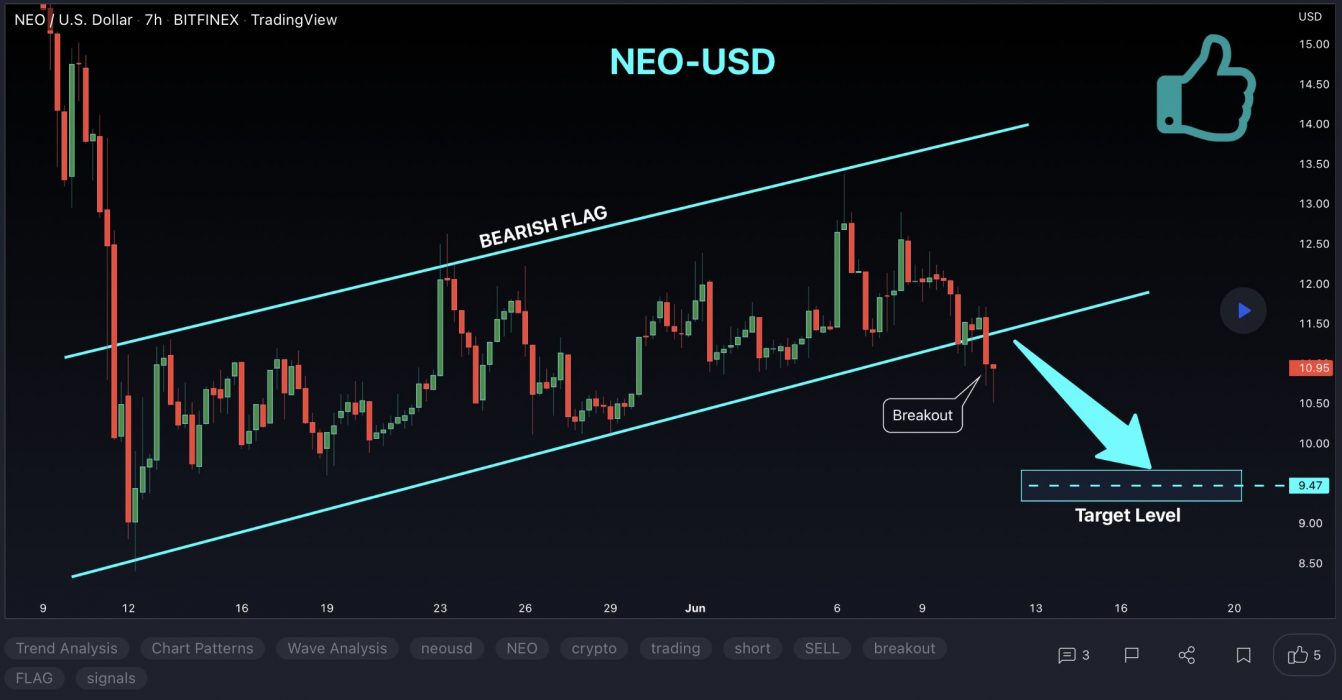
At the time of writing, NEO is ranked the 54th cryptocurrency globally and the current price is US$12.54. Let’s take a look at the chart below for price analysis:

Source: TradingView

After creating a second equal low during May, NEO has gained nearly 20% into resistance that starts near $13.24.

Aggressive bulls looking for a continuation to the nearest cluster of relatively equal highs around $14.33 might look for bids near $13.86. More significant resistance rests above, near $14.85. A group of significant swing highs at $15.36 and $17.29 give possible targets if this resistance breaks.

A stop run on the recent low at $12.09 into possible support beginning near $11.63 might see stronger bidding. This area also has a confluence with the previous monthly low.

A bearish market shift could reach the swing low at $10.30 into possible support beginning near $9.84.

3. Shiba Inu (SHIB)

Shiba Inu SHIB coin was created anonymously in August 2020 under the pseudonym “Ryoshi”. The meme coin quickly gained traction and value as a community of investors was drawn in by the cute charm of the coin, paired with headlines and tweets from personalities including Elon Musk and Vitalik Buterin.

SHIB Price Analysis

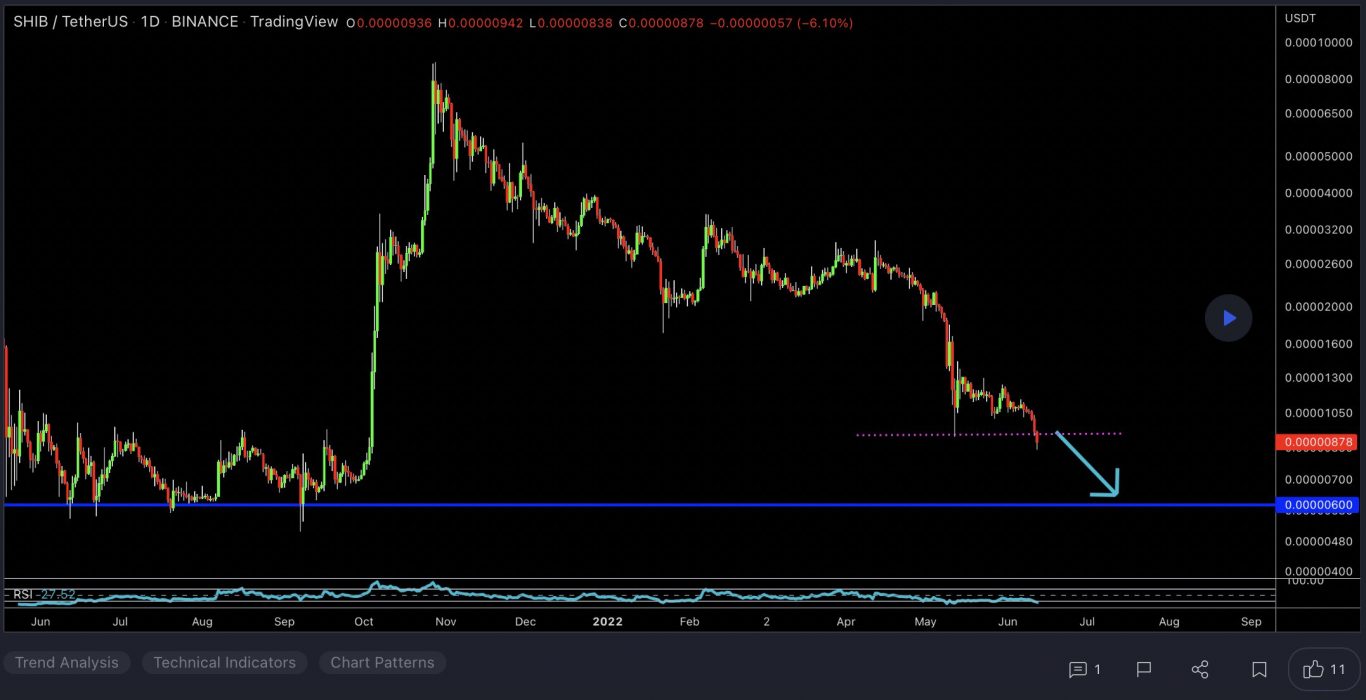
At the time of writing, SHIB is ranked the 17th cryptocurrency globally and the current price is US$0.000009129. Let’s take a look at the chart below for price analysis:

Source: TradingView

SHIB performed well during Q1, reaching over 45% from the first week of February into the resistance near $0.00002542.

For the past several days, the price has been moving in a falling wedge and appears to be flipping old support near $0.000009042 to resistance. If this level breaks – perhaps due to the tempting daily equal lows below – the next support begins near $0.000008329.

Bulls entering at these levels could set their first target near the previous resistance near $0.00001280. Beyond this level, probable targets include the new monthly highs near $0.00001324 and the resistance above near $0.00001452.

A break of this resistance later this month could continue to the new highs near $0.00001682 and $0.00001824.

Learn How to Trade Live!

Join Dave and The Crypto Den Crew and they’ll show you live on a webinar how to take your crypto trading to the next level.

Where to Buy or Trade Altcoins?

These coins have high liquidity on Binance Exchange, so that could help with trading on AUD/USDT/BTC pairs. And if you’re looking at buying and HODLing cryptos, then Swyftx Exchange is an easy-to-use popular choice in Australia.
Categories
Cosmos Crypto News Litentry Market Analysis Theta Network Trading

Top 3 Coins to Watch Today: THETA, LIT, ATOM – June 10 Trading Analysis

Let’s take a closer look at today’s altcoins showing breakout signals. We’ll explain what the coin is, then dive into the trading charts and provide some analysis to help you decide.

1. Theta Network (THETA)

Theta Network THETA is a blockchain-powered network purpose-built for video streaming. Launched in March 2019, the Theta mainnet operates as a decentralised network in which users share bandwidth and computing resources on a peer-to-peer (P2P) basis. Theta features its own native cryptocurrency token, THETA, which performs various governance tasks within the network, and counts Google, Binance, Blockchain Ventures, Gumi, Sony Europe and Samsung as Enterprise validators, along with a Guardian network of thousands of community-run guardian nodes.

THETA Price Analysis

At the time of writing, THETA is ranked the 40th cryptocurrency globally and the current price is US$1.44. Let’s take a look at the chart below for price analysis:

Source: TradingView

THETA has formed a clean range between $2.30 and $1.50. The price is likely to run these equal highs and lows before the next significant move.

The price is currently near the low end of the range. On the monthly chart, an old, inefficiently traded area down to $1.40 could provide support. This support might create a bounce back up to the old range highs.

If this level breaks, a broad zone between $1.33 and $1.18 could be the next support. This area shows inefficient trading on the monthly and weekly charts.

Shorter-term traders might frame a short near $1.70. Here, an inefficiently traded area on the daily chart could provide resistance. Just above, $1.88 might also provide resistance. This level is near the current consolidation range’s highs.

Current price action makes it unclear where bulls are most likely to find the current range’s next resistance. A bullish reversal will likely draw to the relatively equal highs at $1.95. Bears might stop the price first at an area of old bullish rejection on the monthly, near $2.13.

2. Litentry (LIT)

Litentry LIT is a decentralised identity authentication and user activity data management Infrastructure. Build on Substrate, Ready for Polkadot. Litentry is helping support change that is in favour of a user-centric network with the blockchain. Litentry includes an identity-based network and related tools, and features an identity matching and identity staking mechanism; as a whole, it consists of decentralised identity and user activity data management infrastructure.

Litentry Price Analysis

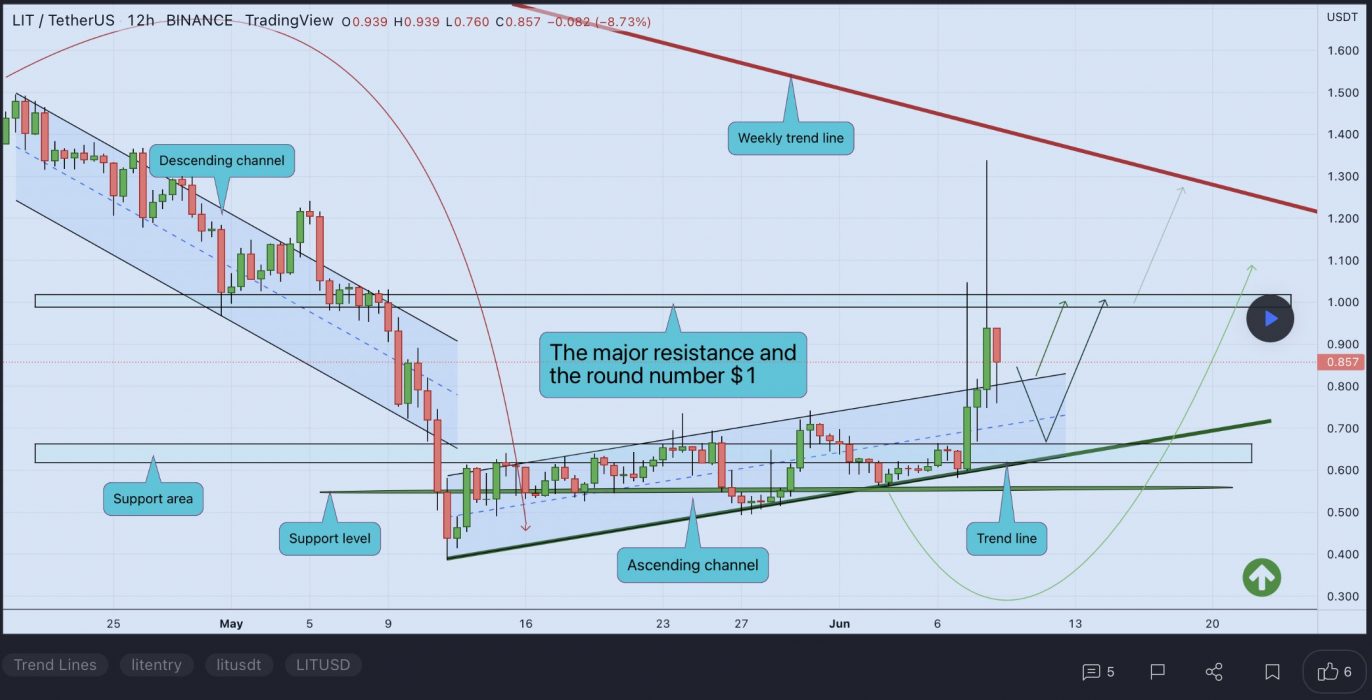
At the time of writing, LIT is ranked the 524th cryptocurrency globally and the current price is US$0.8241. Let’s take a look at the chart below for price analysis:

Source: TradingView

LIT has spent the first half of 2022 in a range. It spiked through this range’s high in late March before an aggressive move toward the range lows.

The price found support near $0.5034, near the origin of a recovery in early June, and created a week-long consolidation. However, the swing low near $0.7018, and is likely to provide resistance. It may cause further consolidation at the current area before a decisive break.

A break under the support near $0.6579 might target the swing lows and possible support near $0.6024. Below this level, there is little apparent higher-timeframe support.

If bulls appear, a break through the current resistance near the 9 EMA, around $0.9508, might find resistance from $1.12 to $1.27.

A sustained bullish shift in the market could propel the price through monthly open into probable resistance near the high at $2.35.

3. Cosmos (ATOM)

Cosmos ATOM bills itself as a project that solves some of the “hardest problems” facing the blockchain industry. It aims to offer an antidote to “slow, expensive, unscalable and environmentally harmful” proof-of-work protocols, like those used by Bitcoin, by offering an ecosystem of connected blockchains. ATOM tokens are earned through a hybrid proof-of-stake algorithm and they help to keep the Cosmos Hub, the project’s flagship blockchain, secure. This cryptocurrency also has a role in the network’s governance.

ATOM Price Analysis

At the time of writing, ATOM is ranked the 30th cryptocurrency globally and the current price is US$8.89. Let’s take a look at the chart below for price analysis:

Source: TradingView

ATOM has been consolidating in a range around Q1 2022’s high.

Q2 2022 saw the start of a smaller range inside this larger range. Near the current price, $10.38 or $11.00 could support at least a small move upward. This area is near the local range low, inefficiently traded, and the site of a stop run.

Just above the current price, the 9, 18, and 40 EMAs might provide resistance near $12.86. This level saw consolidation before last week’s downward move.

A move back toward the local range highs could reach possible resistance near $13.06, where bears rejected recent rally. This level is just above the May monthly open.

A more extended move by bulls might reach the larger range’s rejection area near $14.81. However, a move this far is less likely unless the overall market rallies.

Below the higher timeframe’s range, $8.15 to $7.80 could provide more substantial support to start a longer-term bullish trend. This level is near the 78.6% retracement of the July 2021 to September 2021 rally, shows inefficient trading on higher-timeframe charts, especially between $7.25 and $6.96, and provides a reasonable stop run target.

Learn How to Trade Live!

Join Dave and The Crypto Den Crew and they’ll show you live on a webinar how to take your crypto trading to the next level.

Where to Buy or Trade Altcoins?

These coins have high liquidity on Binance Exchange, so that could help with trading on AUD/USDT/BTC pairs. And if you’re looking at buying and HODLing cryptos, then Swyftx Exchange is an easy-to-use popular choice in Australia.

Categories
Band Protocol ChainLink Crypto News Kusama Market Analysis Trading

Top 3 Coins to Watch Today: KSM, LINK, BAND – June 9 Trading Analysis

Let’s take a closer look at today’s altcoins showing breakout signals. We’ll explain what the coin is, then dive into the trading charts and provide some analysis to help you decide.

1. Kusama (KSM)

Kusama KSM is an experimental blockchain platform designed to provide a massively interoperable and scalable framework for developers. Kusama is built on Substrate, a blockchain building kit developed by Parity Technologies. Kusama has almost the same codebase as Polkadot, one of the most successful interoperable blockchains.

KSM Price Analysis

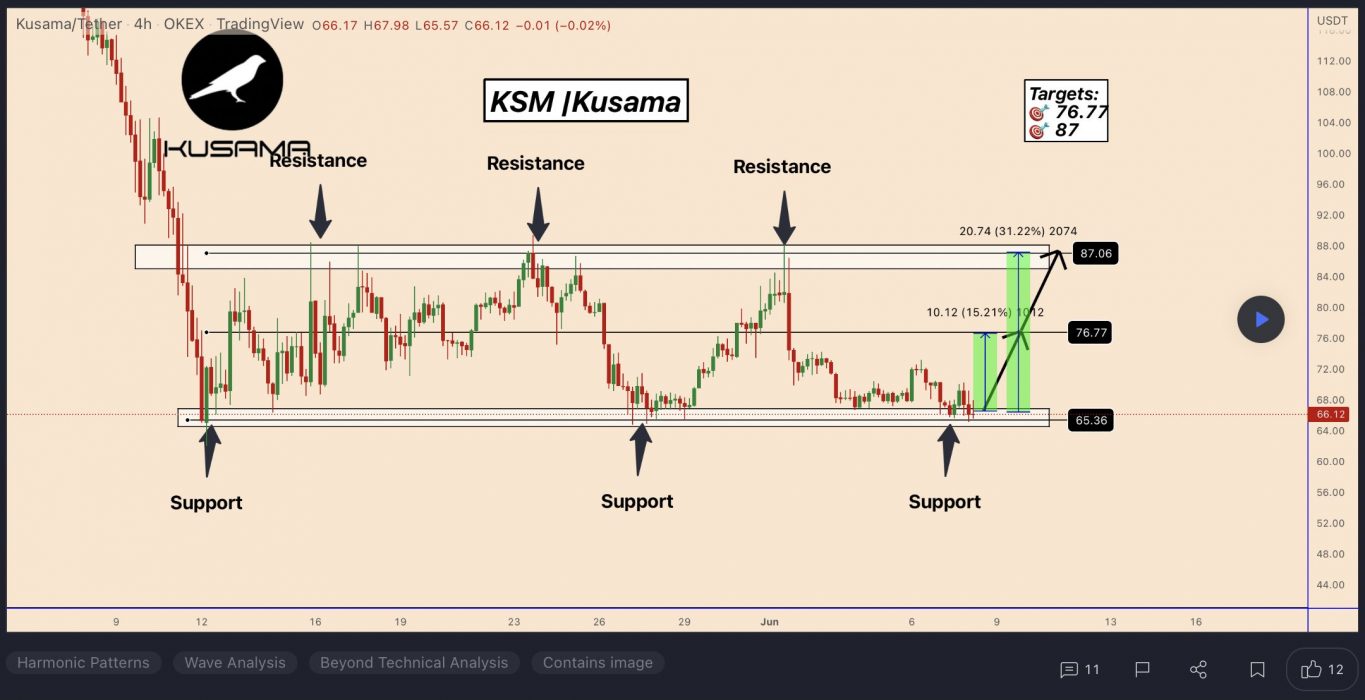
At the time of writing, KSM is ranked the 77th cryptocurrency globally and the current price is US$66.33. Let’s take a look at the chart below for price analysis:

Source: TradingView

After rallying over 40% from its Q1 lows, KSM is encountering resistance near $83.70. This resistance and the monthly open at $75.51 currently have the price trapped. The swing high and resistance near $97.83 provide a likely target before any major bearish market shift, with continuation through this resistance possibly reaching for shortstops and resistance near $110.46.

The daily gap at $60.71 could provide support, while the area beginning near $57.73 could see more substantial interest from the bulls. A longer-term bearish shift in the marketplace will likely reach the relatively equal lows near $50.77, possibly finding a floor at support beginning near $46.39.

The Chainlink Network LINK is driven by a large open-source community of data providers, node operators, smart contract developers, researchers, security auditors, and more. The company focuses on ensuring that decentralised participation is guaranteed for all node operators and users looking to contribute to the network. Chainlink allows blockchains to securely interact with external data feeds, events, and payment methods, providing the critical off-chain information needed by complex smart contracts to become the dominant form of digital agreement.

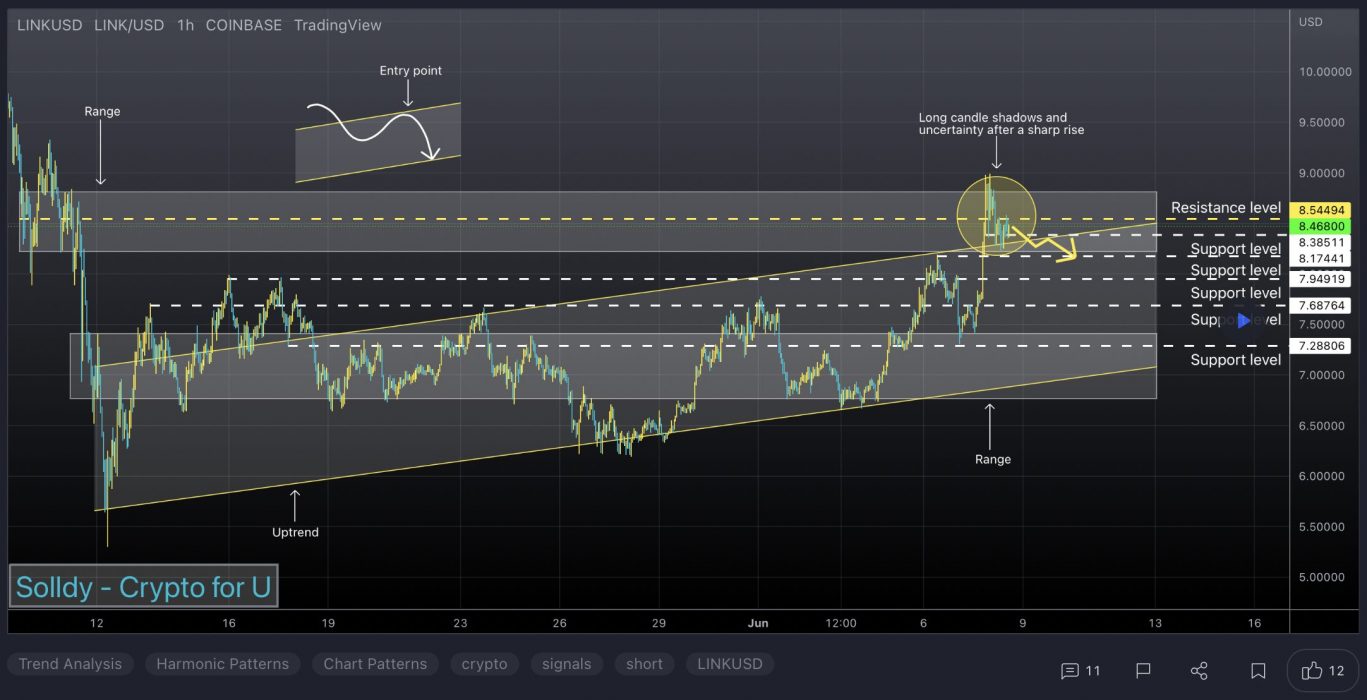
At the time of writing, LINK is ranked the 21st cryptocurrency globally and the current price is US$8.74. Let’s take a look at the chart below for price analysis:

Source: TradingView

LINK‘s early April trend retraced near $6.50 into the consolidation that began the impulse before bouncing to $7.80. 

This consolidation could provide support again, although bears would first have to push the price through possible support near $8.45. The market’s structure may be shifting bearish, with $8.90 likely to provide some resistance if this is the case. A sustained bearish move could reach the swing low near $7.89 before finding support near $7.50.

However, the bullish higher-timeframe trend might prevail, with relatively equal highs near $9.27 potentially giving an attractive target to lure the price over the monthly open. If so, the price could reach for the midpoint of the Q1 wick near $10.18.

3. Band Protocol (BAND)

Band Protocol BAND is a cross-chain data oracle platform that is able to take real-world data and supply it to on-chain applications, while also connecting APIs to smart contracts to facilitate the exchange of information between on-chain and off-chain data sources. BAND is the native token of the Band Protocol ecosystem and is used as collateral by validators involved in fulfilling data requests, as well as being the main medium of exchange on BandChain, used for paying for private data.

BAND Price Analysis

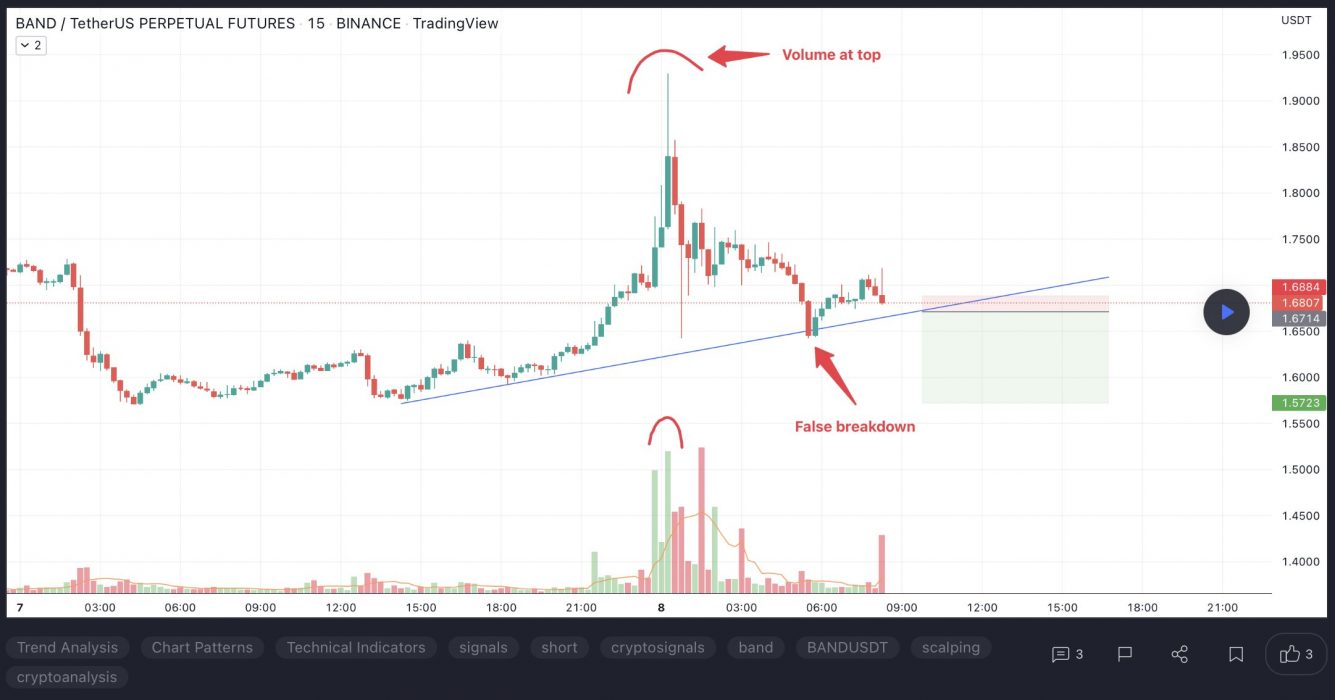
At the time of writing, BAND is ranked the 370th cryptocurrency globally and the current price is US$1.68. Let’s take a look at the chart below for price analysis:

Source: TradingView

Like many other altcoins, BAND set a high around April before retracing 85% to the low at $1.50 in early June.

Price broke through resistance near $1.60, which may mark an area of possible support on a retracement. If this support fails, bulls might also step in near $1.49. However, a drop this far increases the chances of a stop run to $1.34 and possibly into support near $1.29. For now, continuing bullish market conditions could help $1.40 become support.

The swing high around $1.89 gives bulls a reasonable first target, with $1.98 also likely to draw the price upward. Higher-timeframe resistance beginning near $2.18 or $2.30 could cap the move or trigger consolidations. If bullish market conditions continue, bulls might test probable resistance near $2.39.

Learn How to Trade Live!

Join Dave and The Crypto Den Crew and they’ll show you live on a webinar how to take your crypto trading to the next level.

Where to Buy or Trade Altcoins?

These coins have high liquidity on Binance Exchange, so that could help with trading on AUD/USDT/BTC pairs. And if you’re looking at buying and HODLing cryptos, then Swyftx Exchange is an easy-to-use popular choice in Australia.

Categories
Alpha Finance Lab Balancer Crypto News Gala Market Analysis Trading

Top 3 Coins to Watch Today: GALA, BAL, ALPHA – June 8 Trading Analysis

Let’s take a closer look at today’s altcoins showing breakout signals. We’ll explain what the coin is, then dive into the trading charts and provide some analysis to help you decide.

1. Gala (GALA)

GALA aims to take the gaming industry in a different direction by giving players back control over their games. Gala Games’ mission is to make “blockchain games you’ll actually want to play”. The project wants to change how players can spend hundreds of dollars on in-game assets and countless hours playing the game, all of which could be taken away from them with the click of a button. It plans to reintroduce creative thinking by giving players control of the games and in-game assets with the help of blockchain technology.

GALA Price Analysis

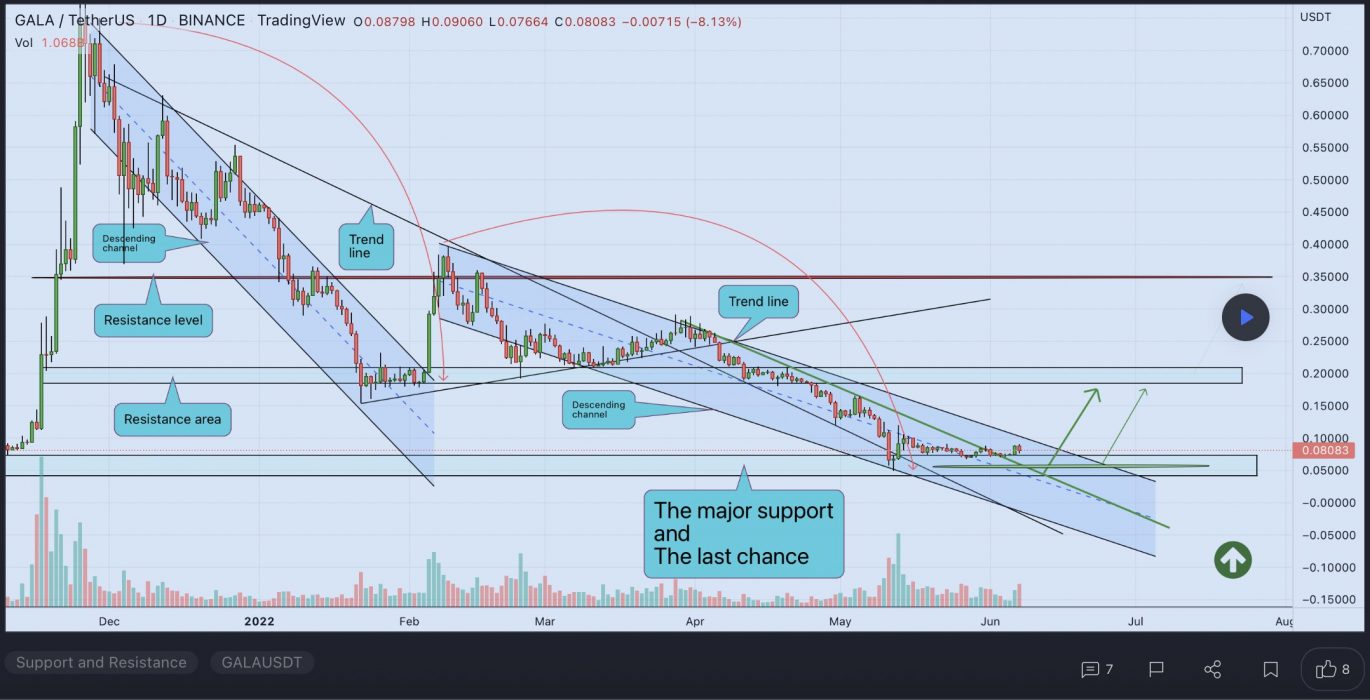
At the time of writing, GALA is ranked the 78th cryptocurrency globally and the current price is US$0.08352. Let’s take a look at the chart below for price analysis:

Source: TradingView

After setting a low last week, GALA turned into a recovery trend to make the new monthly highs.

The following 78% plummet found support near $0.06439, sweeping under the 40 EMA into the 60.8% retracement level before bouncing to resistance beginning at $0.07920.

This area could continue to provide resistance, possibly causing a retracement to the 9 EMA and 18 EMA near $0.08612, where aggressive bulls might begin bidding. The level near $0.09154, which has confluence with the 40 EMA, may see more interest from bulls loading up for an attempt on probable resistance beginning near $0.09985. 

However, if Bitcoin continues its sideways trend, much lower prices could be seen. The old support near $0.06380 could provide at least a short-term bounce. If this level fails, the old highs near $0.05835 might also give support and see the start of a new bullish cycle after retesting these support levels.

2. Balancer (BAL)

Balancer BAL is an automated market maker (AMM) that was developed on the Ethereum blockchain and launched in March 2020. It was able to raise a $3 million seed round by Placeholder and Accomplice. Balancer protocol functions as a self-balancing weighted portfolio, price sensor, and liquidity provider. It allows users to earn profits through its recently introduced token, BAL, by contributing to customisable liquidity pools.

BAL Price Analysis

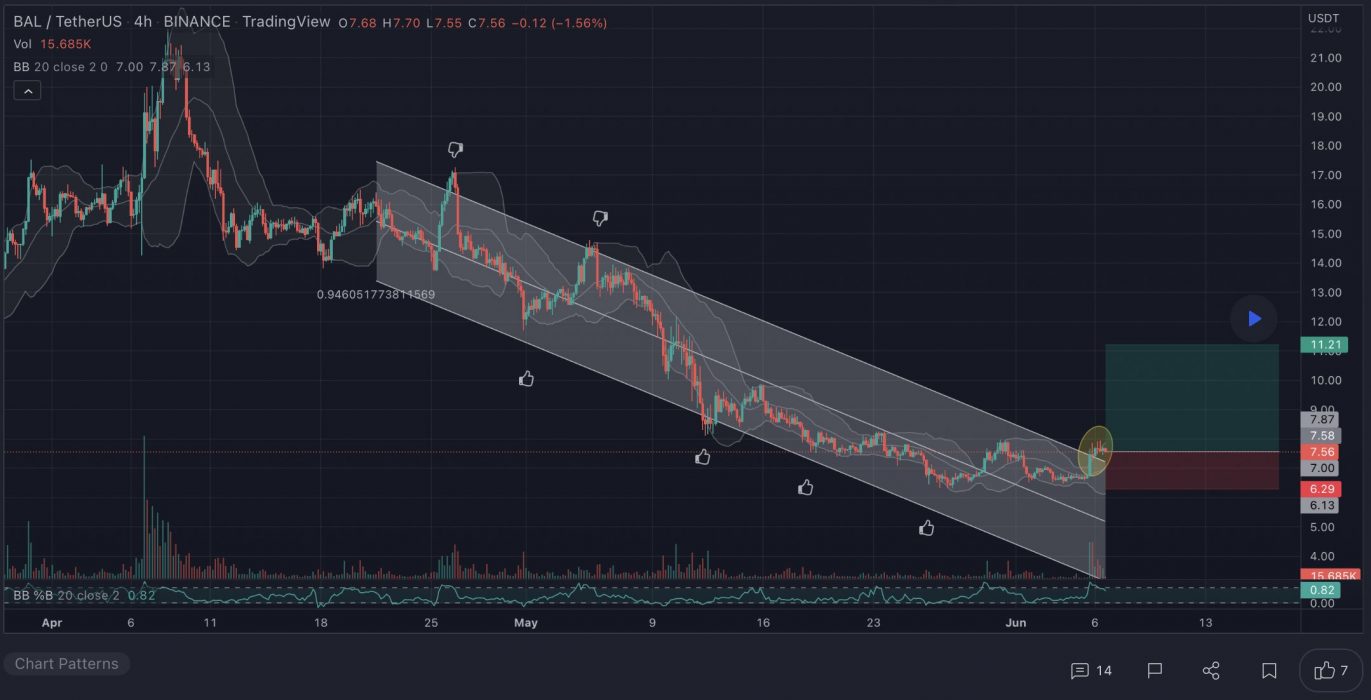
At the time of writing, BAL is ranked the 414th cryptocurrency globally and the current price is US$7.11. Let’s take a look at the chart below for price analysis:

Source: TradingView

Since the beginning of Q2, BAL has retraced 70% – a relatively high amount compared to many other altcoins. However, it continues to creep to monthly lows, suggesting that the consolidation period may be near its end.

Aggressive bulls could look for entries in new possible support between $6.90 and $6.78. A dip below this area might also find support near $6.70. However, a daily close near $7.25 brings bullish strength into question. 

A sudden drop in the market is likely to test possible support beginning near $7.00. This retracement would create extensions suggesting $6.55-$6.13 as a potential target for bulls. 

Currently, extensions indicate a reasonable take-profit zone near $7.36 to $7.63, with $7.95 having the most confluence. If bulls can maintain strength, confluent extensions point to $8.32-$9.00 as a reasonable next target.

3. Alpha Finance (ALPHA)

Alpha Finance Lab ALPHA is a cross-chain DeFi platform that looks to bring Alpha to users across a variety of different blockchains, including Binance Smart Chain (BSC) and Ethereum. The platform aims to produce an ecosystem of DeFi products that address unmet needs in the industry while remaining simple to use and access. ALPHA is the native utility token of the platform. Token holders can earn a share of network fees by staking ALPHA tokens to cover any default loans. Other use cases for the token include liquidity mining and governance voting.

ALPHA Price Analysis

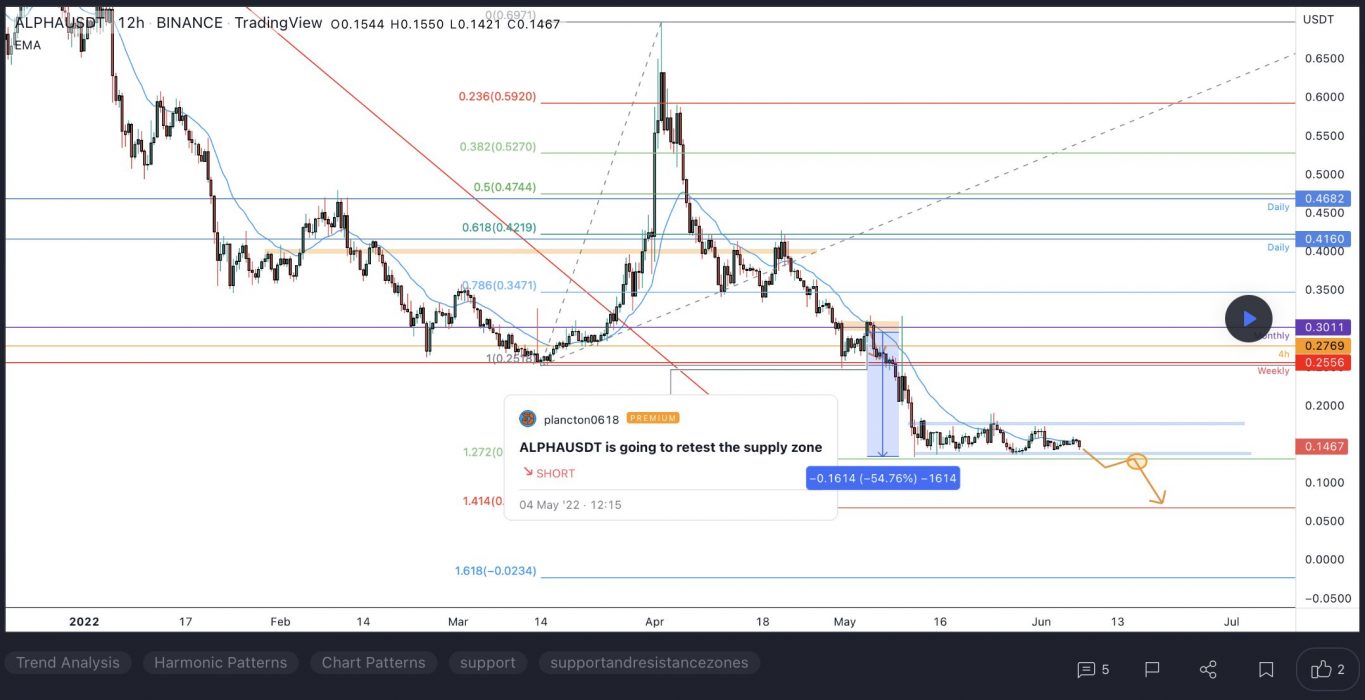
At the time of writing, ALPHA is ranked the 346th cryptocurrency globally and the current price is US$0.1522. Let’s take a look at the chart below for price analysis:

Source: TradingView

ALPHA‘s 65% rally from its Q1 lows met resistance near $0.5995, before creating a new range for Q2.

After a bearish flip of the 9, 18 and 40 EMAs, the price broke below $0.2110. This area, which has confluence with multiple swing lows and the May monthly open, may provide resistance on any future retest.

The price might find support near $0.1475 to $0.1408 if the overall market’s conditions turn more bullish. This zone has confluence with the 61.8% to 78.6% retracements and accumulation zone for Q1’s rally.

Suppose the price does rally through the probable resistance near the monthly open. In this case, the Q2 swing highs and above, near $0.2561, could provide resistance again. A shift back to more bullish market conditions could push the price to the 50% extension of the summer’s swing, near $0.2834.

Learn How to Trade Live!

Join Dave and The Crypto Den Crew and they’ll show you live on a webinar how to take your crypto trading to the next level.

Where to Buy or Trade Altcoins?

These coins have high liquidity on Binance Exchange, so that could help with trading on AUD/USDT/BTC pairs. And if you’re looking at buying and HODLing cryptos, then Swyftx Exchange is an easy-to-use popular choice in Australia.
Categories
Crypto News Ethereum Filecoin Market Analysis Monero Trading

Top 3 Coins to Watch Today: ETH, FIL, XMR – June 7 Trading Analysis

Let’s take a closer look at today’s altcoins showing breakout signals. We’ll explain what the coin is, then dive into the trading charts and provide some analysis to help you decide.

1. Ethereum (ETH)

Ethereum ETH is a decentralised open-source blockchain system that features its own cryptocurrency, Ether. ETH works as a platform for numerous other cryptocurrencies, as well as for the execution of decentralised smart contracts. Ethereum’s own purported goal is to become a global platform for decentralised applications, allowing users from all over the world to write and run software that is resistant to censorship, downtime and fraud.

ETH Price Analysis

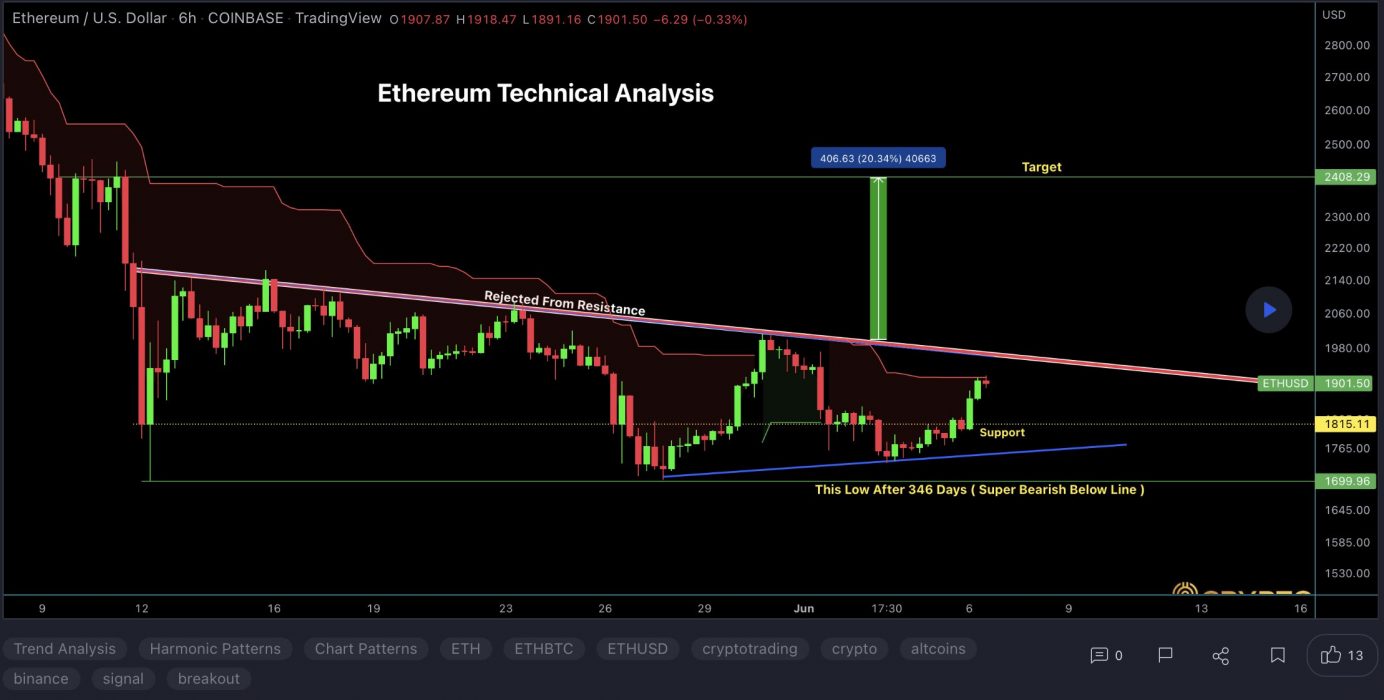
At the time of writing, ETH is ranked the 2nd cryptocurrency globally and the current price is US$1,858. Let’s take a look at the chart below for price analysis:

Source: TradingView

ETH has dropped 53% from its April highs and is now consolidating above many swing lows formed in summer 2021, near $1,700.

An inefficiently traded area could provide the closest near-term resistance. This area is between $1,852 and $1,924. 

If the price stays nearby, it’s more likely to serve resistance. This zone is near the June monthly open, contains the 18 EMA, and is above the 9 EMA.

A break through this level may target bears’ stops above the series of swing highs up to $2,164. The weekly chart shows inefficient trading in this area. It overlaps with swing lows from January and February 2022 and is near the 40 EMA.

If the price does rally this high, it could signal the start of a more significant bullish shift. This rally could reach as high as $2,458. March’s lows and inefficient trading on the weekly chart align with this level, yet the price has not indicated that it will go this high.

Many swing lows near $1,700 provide a tempting target for bears. Bulls will likely wait for a stop run below these lows before considering an entry. Inefficient trading on the daily chart from $1,687 to $1,616 could mark the sweep’s bottom.

Bulls should be cautious. A liquidation cascade and the current bearish conditions could cause a more significant drop. 

If bears do overpower bulls, the next higher-timeframe support might be near $1,292. This area shows inefficient trading on the weekly chart. It also overlaps with 2017’s cycle high and would sweep most bulls’ stops.

2. Filecoin (FIL)

Filecoin FIL is a decentralised storage system that aims to “store humanity’s most important information”. The project was first described back in 2014 as an incentive layer for the Interplanetary File System (IPFS), a peer-to-peer storage network. Filecoin is an open protocol backed by a blockchain that records commitments made by the network’s participants, with transactions using FIL, the blockchain’s native currency. The blockchain is based on both proof-of-replication and proof-of-spacetime.

FIL Price Analysis

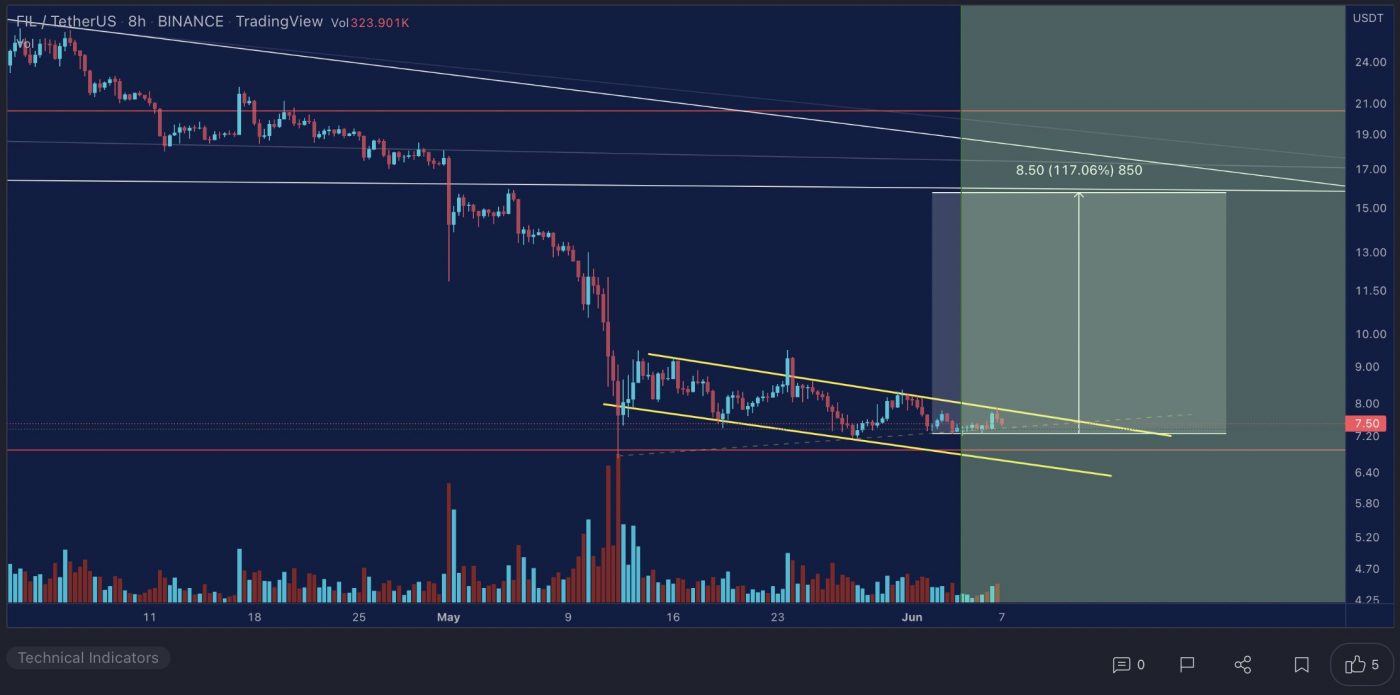
At the time of writing, FIL is ranked the 40th cryptocurrency globally and the current price is US$7.49. Let’s take a look at the chart below for price analysis:

Source: TradingView

FIL has dropped 77% from its April highs. It’s now 97% down from its March 2021 all-time high. 

The price is currently in a small consolidation range. This range’s lower lows suggest bearishness. 

A rally near $8.36 could set the stage for another move lower. This level would provide a run on bears’ stops above the last daily swing high and is above the June monthly open. 

A break through this level could reach between $9.47 and $10.58. This zone shows inefficient trading on the weekly and daily charts. It also contains the 40 EMA. Relatively equal highs at the bottom of this zone mark bears’ stops. These stops provide bulls with an attractive target.

Bulls should be careful, however. The price is trending lower, and the current market conditions are bearish. Yet a consolidation near $7.63 could provide at least short-term support. This consolidation followed the last drop lower.

Chaotic price action below this level makes precise levels impossible to determine. Still, bulls could look for support near old swing highs formed in late 2019 near $6.74. 

Slightly lower, an area near $5.48 could also cause the formation of a bullish setup. This area is around the midpoint of significant consolidation. It’s also near the origin of 2020’s rally.

3. Monero (XMR)

Monero XMR allows transactions to take place privately and with anonymity. Even though it’s commonly thought that BTC can conceal a person’s identity, it’s often easy to trace payments back to their original source because blockchains are transparent. On the other hand, XMR is designed to obscure senders and recipients alike through the use of advanced cryptography. The team behind Monero says privacy and security are their biggest priorities, with ease of use and efficiency coming second. It aims to provide protection to all users irrespective of how technologically competent they are.

XMR Price Analysis

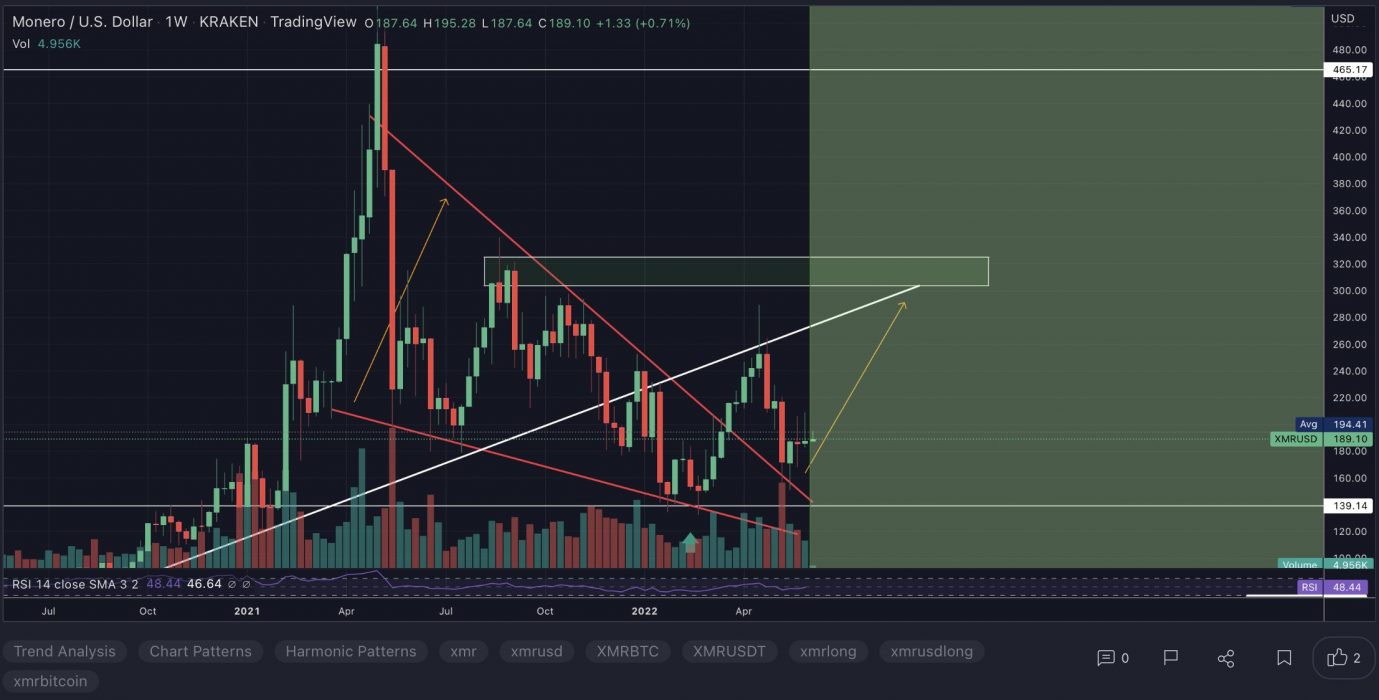
At the time of writing, XMR is ranked the 27th cryptocurrency globally and the current price is US$190.56. Let’s take a look at the chart below for price analysis:

Source: TradingView

XMR swept 2022’s range high in April, then dropped 60% to sweep its range low. The price is currently near the range’s midpoint.

Since the price is in the middle of its range, there is no clear direction for the next move. Wednesday’s event could generate volatility. This volatility may create better hints for the next significant move’s direction.

The June open, near $197.70, could provide resistance during a retest. This area saw distribution before last week’s downward move. It’s also near the low end of early May’s inefficient trading. 

Slightly higher, $212.00 may also provide resistance. Before May’s sharp drop, the price consolidated in this area. It also accumulated here in early April.

A strong rally might reach over early May’s consolidation to $229.80. This rally would run bears’ stops and cross over the 2022 yearly open. The weekly chart also shows an inefficiently traded area around this price.

The price is currently near possible support at $190.10. This area contains the 18 EMA and formed the base of late May’s rally. It should hold if a significant bullish move is next.

If this level breaks, bulls could look for possible support near $155.10. The price may want to run bulls’ stops below May’s swing low while staying above May 12’s swing low. This area saw significant buying in January and February.

Learn How to Trade Live!

Join Dave and The Crypto Den Crew and they’ll show you live on a webinar how to take your crypto trading to the next level.

Where to Buy or Trade Altcoins?

These coins have high liquidity on Binance Exchange, so that could help with trading on AUD/USDT/BTC pairs. And if you’re looking at buying and HODLing cryptos, then Swyftx Exchange is an easy-to-use popular choice in Australia.