Categories
Algorand Alpha Finance Lab Crypto News Litecoin Market Analysis Trading

Top 3 Coins to Watch Today: LTC, ALGO, ALPHA – May 5 Trading Analysis

Let’s take a closer look at today’s altcoins showing breakout signals. We’ll explain what the coin is, then dive into the trading charts and provide some analysis to help you decide.

1. Litecoin (LTC)

Litecoin LTC is a cryptocurrency designed to provide fast, secure and low-cost payments by leveraging the unique properties of blockchain technology. The cryptocurrency was created based on the Bitcoin protocol, but it differs in terms of the hashing algorithm used, hard cap, block transaction times, and a few other factors. Litecoin has a block time of just 2.5 minutes and extremely low transaction fees, making it suitable for micro-transactions and point-of-sale payments.

LTC Price Analysis

At the time of writing, LTC is ranked the 22nd cryptocurrency globally and the current price is US$102.67. Let’s take a look at the chart below for price analysis:
Source: TradingView

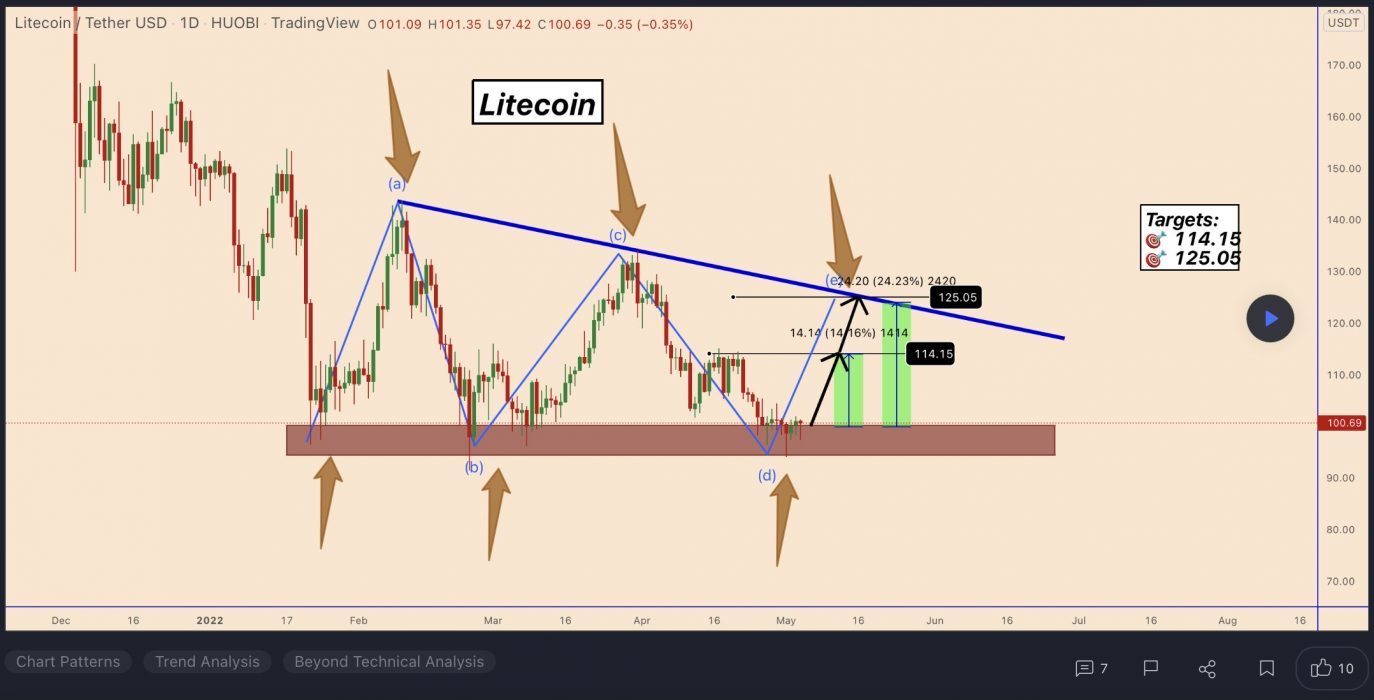
After setting a low last month, LTC kicked off a recovery trend that gained nearly 23% to break the weekly highs.

The following 55% plummet found support near $96.36, sweeping under the 40 EMA into the 61.8% retracement level before bouncing to resistance beginning at $110.53.

This area could continue to provide resistance, possibly causing a retracement to the 9 EMA and 18 EMA near $120.12, where aggressive bulls might begin bidding. The level near $133.98, which has confluence with the 40 EMA, may see more interest from bulls loading up for an attempt on probable resistance beginning near $149.13. 

However, if Bitcoin continues its sideways trend, much lower prices could be seen. The old support near $96.18 could provide at least a short-term bounce. If this level fails, the old monthly lows near $89.23 might also give support and see the start of a new bullish cycle after retesting these support levels.

2. Algorand (ALGO)

The Algorand ALGO blockchain is a permissionless, pure proof-of-stake blockchain protocol. Unlike Proof-of-Work (PoW) blockchains, where the root block must be validated by randomly selected validators (using computing power), in the pure proof-of-stake approach all of the validators are known to one another and only have to agree on the next block in order to create a new block. Algorand was invented to speed up transactions and improve efficiency in response to the slow transaction times of Bitcoin and other blockchains.

ALGO Price Analysis

At the time of writing, ALGO is ranked the 30th cryptocurrency globally and the current price is US$0.6615. Let’s take a look at the chart below for price analysis:
Source: TradingView

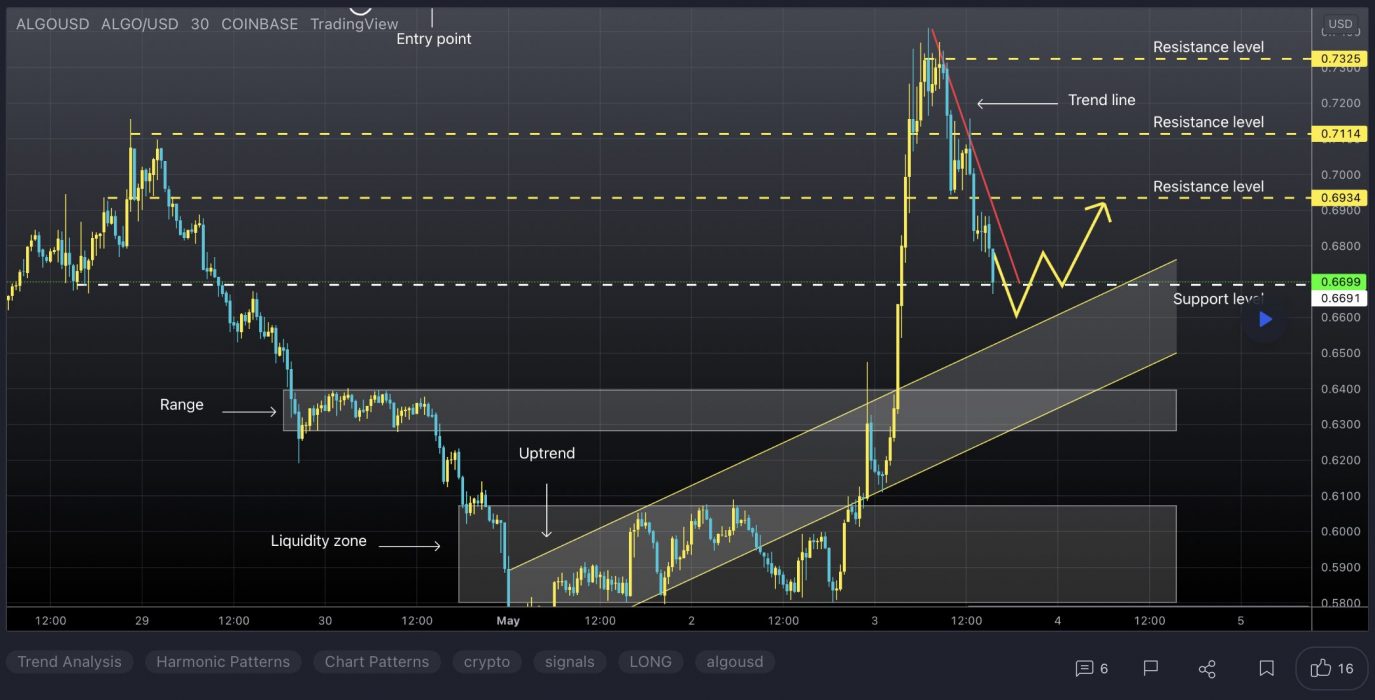
After creating a second equal low during last month, ALGO gained nearly 20% into resistance that starts near $0.7522.

Swing traders looking for a continuation to the nearest cluster of relatively equal highs around $0.8412 might look for bids near $0.9036. More significant resistance rests above, near $0.9815. A group of significant swing highs at $1.10 and $1.16 give possible targets if this resistance breaks.

A stop run on the recent low at $0.6533 into possible support beginning near $0.6130 might see stronger bidding. This area also has a confluence with the recent monthly lows.

3. Alpha Finance (ALPHA)

Alpha Finance Lab ALPHA is a cross-chain DeFi platform that looks to bring Alpha to users across a variety of different blockchains, including Binance Smart Chain (BSC) and Ethereum. The platform aims to produce an ecosystem of DeFi products that address unmet needs in the industry while remaining simple to use and access. ALPHA is the native utility token of the platform. Token holders can earn a share of network fees by staking ALPHA tokens to cover any default loans. Other use cases for the token include liquidity mining and governance voting.

ALPHA Price Analysis

At the time of writing, ALPHA is ranked the 306th cryptocurrency globally and the current price is US$0.2847. Let’s take a look at the chart below for price analysis:
Source: TradingView

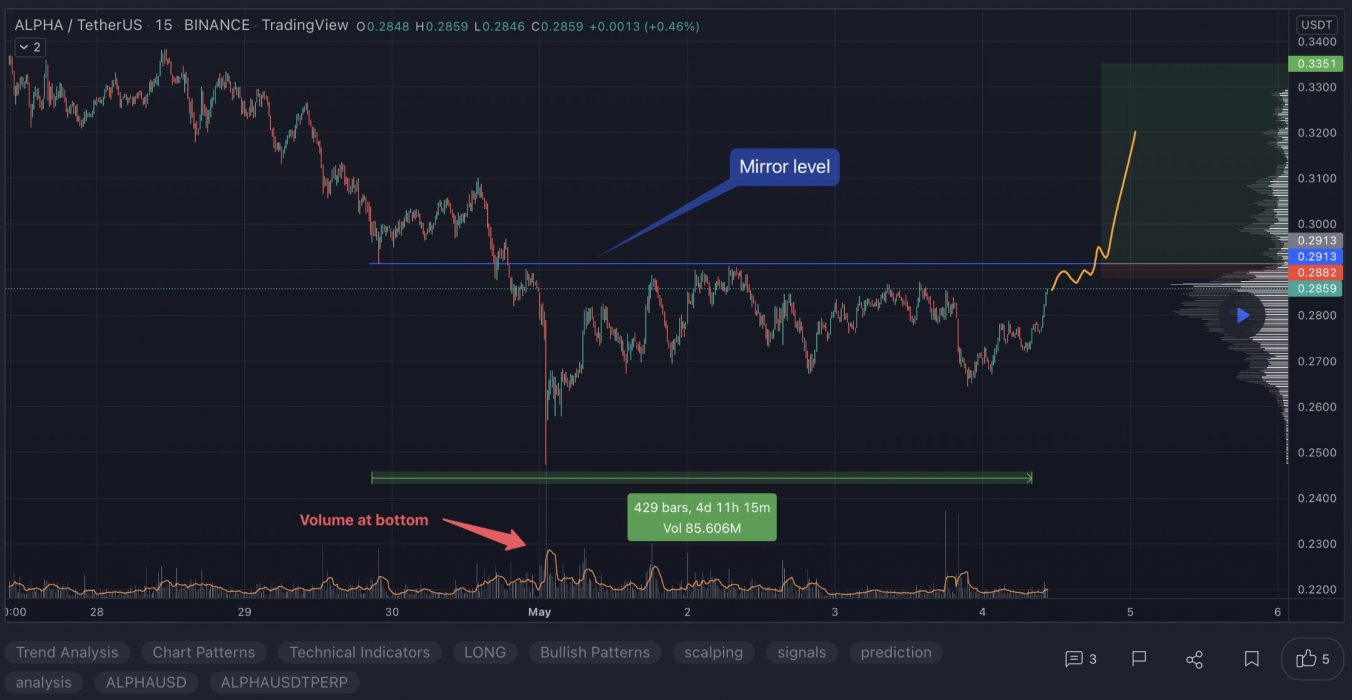
ALPHA‘s 60% rally from its Q1 lows met resistance near $0.5995, before creating a new range for Q2.

After a bearish flip of the 9, 18 and 40 EMAs, the price broke below $0.4310. This area, which has confluence with multiple swing lows and the February monthly open, may provide resistance on any future retest.

The price might find support near $0.3045 to $0.2549 if the overall market’s conditions turn more bullish. This zone has confluence with the 61.8% to 78.6% retracements and accumulation zone for Q1’s rally.

Suppose the price does rally through the probable resistance near December’s open. In that case, the January swing highs and above, near $0.4561, could provide resistance again. A shift back to more bullish market conditions could push the price to the 50% extension of the summer’s swing, near $0.5034.

Learn How to Trade Live!

Join Dave and The Crypto Den Crew and they’ll show you live on a webinar how to take your crypto trading to the next level.

Where to Buy or Trade Altcoins?

These coins have high liquidity on Binance Exchange, so that could help with trading on AUD/USDT/BTC pairs. And if you’re looking at buying and HODLing cryptos, then Swyftx Exchange is an easy-to-use popular choice in Australia.

Categories
Crypto News Market Analysis Polkadot Trading TRON

Top 3 Coins to Watch Today: DOT, TRX, CRO – May 4 Trading Analysis

Let’s take a closer look at today’s altcoins showing breakout signals. We’ll explain what the coin is, then dive into the trading charts and provide some analysis to help you decide.

1. Polkadot (DOT)

Polkadot DOT is an open-source sharding multichain protocol that facilitates the cross-chain transfer of any data or asset types, not just tokens, thereby making a wide range of blockchains interoperable with each other. Polkadot’s native DOT token serves three clear purposes: providing network governance and operations, and creating parachains by bonding. The Polkadot protocol connects public and private chains, permissionless networks, oracles and future technologies, allowing these independent blockchains to trustlessly share information and transactions through the Polkadot relay chain.

DOT Price Analysis

At the time of writing, DOT is ranked the 14th cryptocurrency globally and the current price is US$14.91. Let’s take a look at the chart below for price analysis:

Source: TradingView

DOT has retraced nearly 62% during Q1, showing little sign of interest from buyers.

April’s consolidation at possible support from $15.68 to $19.57 broke down with the rest of the market last month, turning this into likely resistance on future retests. This area now has confluence with the 9 and 18 EMAs.

If market conditions turn and this resistance breaks, an area near the midpoint of January’s consolidation range, near $22.70, and the monthly high near $26.88 may see profit-taking from bulls.

The first test of possible support near $14.80 showed some sensitivity. Still, continued bearishness in the market will likely cause a break of this level.

A break of this support might continue to drop to the next possible support near $14.10, running stops under the Q3 2021 swing low. If this level gives support and begins a consolidation forming a bottom, bulls might wait for a wick below to possible support from $13.55 to $12.37.

2. Tron (TRX)

Tron TRX is a blockchain-based operating system that aims to ensure this technology is suitable for daily use. Whereas Bitcoin can handle up to six transactions per second, and Ethereum up to 25, TRON claims that its network has a capacity for 2,000 TPS. This project is best described as a decentralised platform focused on content sharing and entertainment, and to this end, one of its biggest acquisitions was the file-sharing service BitTorrent in 2018. Overall, TRON has divided its goals into six phases. These include delivering simple distributed file sharing, driving content creation through financial rewards.

TRX Price Analysis

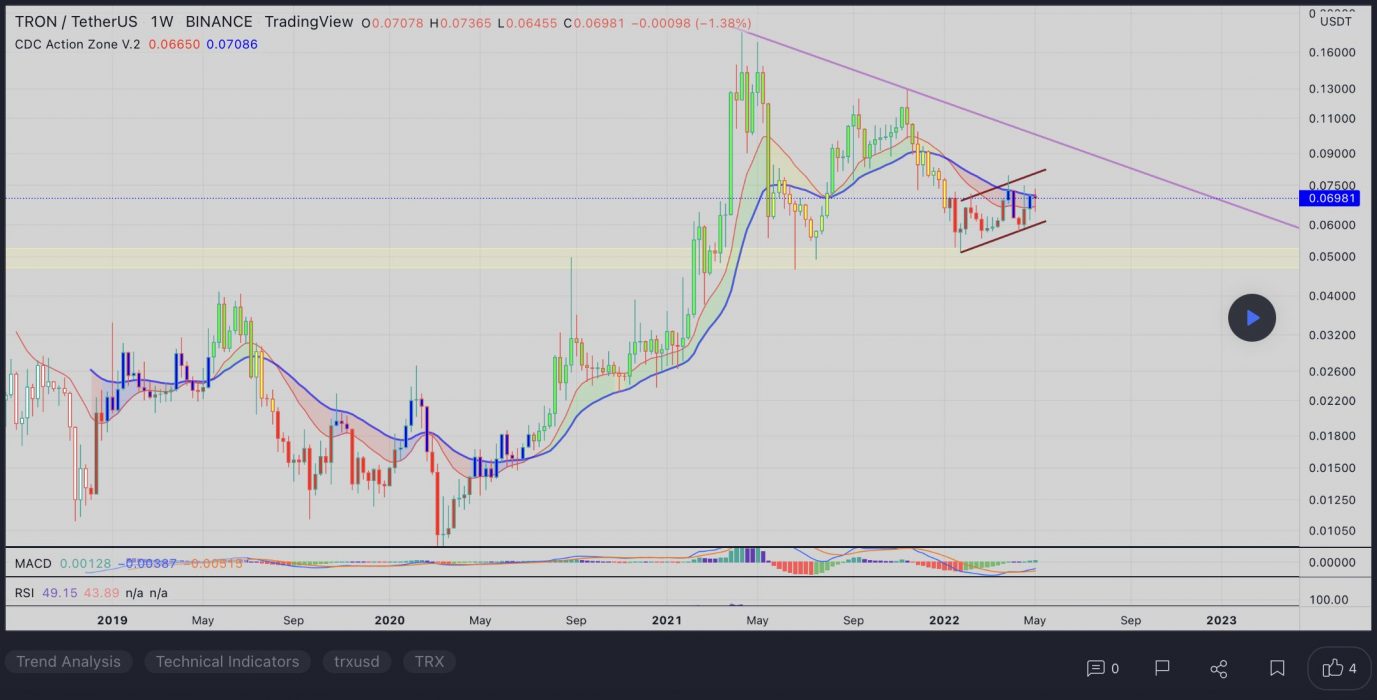
At the time of writing, TRX is ranked the 20th cryptocurrency globally and the current price is US$0.07217. Let’s take a look at the chart below for price analysis:

Source: TradingView

TRX accompanied the rest of the market during the January drop, falling nearly 60% from its mid-December high until it found a low in March.

Price action formed a weekly support level near $0.06054, which has so far held up the price. The most recent swing low inside this range, near $0.05829, might be the target for any future stop runs. After this low, the swing low near $0.05589 and the gap beginning near $0.05326 mark possible higher-timeframe support.

The price is currently battling with significant higher-timeframe resistance levels, with the closest probable resistance resting near $0.07592, just over the previous monthly open. A sweep of the relatively equal highs above this resistance might find sellers near $0.07835, but could reach as high as $0.08637.

3. Crypto Coin (CRO)

Crypto.com coin CRO is the native cryptocurrency token of Crypto.com Chain, a decentralised, open-source blockchain developed by the Crypto.com payment, trading and financial services company. Crypto.com Chain is one of the products in Crypto.com’s lineup of solutions designed to accelerate the global adoption of cryptocurrencies as a means of increasing personal control over money, safeguarding user data, and protecting users’ identities. The CRO blockchain serves primarily as a vehicle that powers the Crypto.com Pay mobile payments app.

CRO Price Analysis

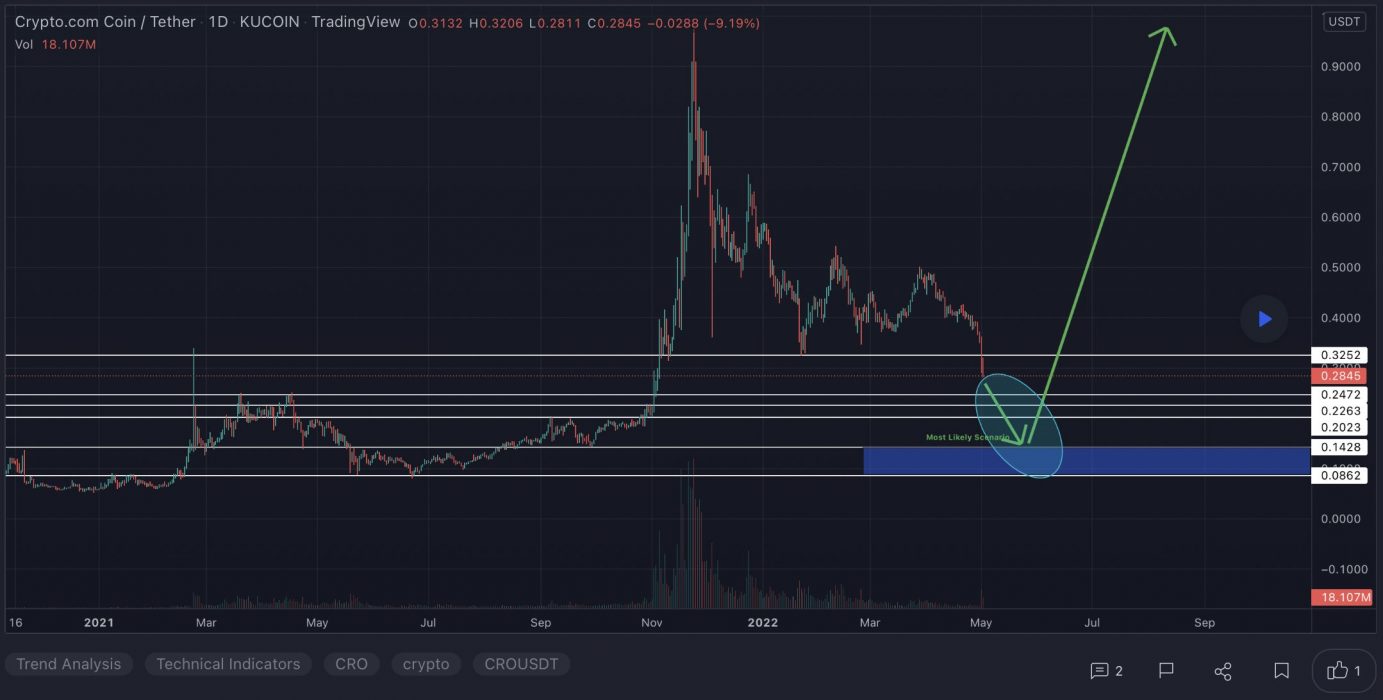
At the time of writing, CRO is ranked the 22nd cryptocurrency globally and the current price is US$0.2877. Let’s take a look at the chart below for price analysis:

Source: TradingView

CRO went parabolic during November, reaching nearly 115% percent within a few days as it blasted through its old all-time high.

This fast move left little compelling higher-timeframe support near the current price. A level near $0.2522, which has confluence with the 8 EMA and 127% extension of H2 2021’s swing, could provide support.

Further below, near $0.2291, 2021’s previous monthly high could also provide some support on a retest. The last consolidation before the breakout, near December’s open, might give the most substantial support. However, this would require significant retracement from the current price point.

While next targets are impossible to predict, extensions from H1 2021’s move suggest that the 40% extension, near $0.3675, could provide some resistance. Above this level, the 48% extension near $0.4348 could also trigger bulls to take profits.

Learn How to Trade Live!

Join Dave and The Crypto Den Crew and they’ll show you live on a webinar how to take your crypto trading to the next level.

Where to Buy or Trade Altcoins?

These coins have high liquidity on Binance Exchange, so that could help with trading on AUD/USDT/BTC pairs. And if you’re looking at buying and HODLing cryptos, then Swyftx Exchange is an easy-to-use popular choice in Australia.

Categories
Crypto News Market Analysis Rari Governance Token Syscoin Trading

Top 3 Coins to Watch Today: SYS, RGT, GST – May 3 Trading Analysis

Let’s take a closer look at today’s altcoins showing breakout signals. We’ll explain what the coin is, then dive into the trading charts and provide some analysis to help you decide.

1. Syscoin (SYS)

Syscoin SYS is a full Layer-1 and Layer-2 blockchain solution built to combine industry-proven technology to support cutting-edge applications, all in one network. The project’s goal is to build a protocol that transforms the blockchain experience and combines the best of Bitcoin and Ethereum. Through Bitcoin merge-mining, Syscoin transforms Bitcoin’s Proof-of-Work security and decentralisation into a functional and scalable solution. Syscoin’s token platform currently features a custom notary API, fungible tokens, NFTs, and fractionalised NFTs.

SYS Price Analysis

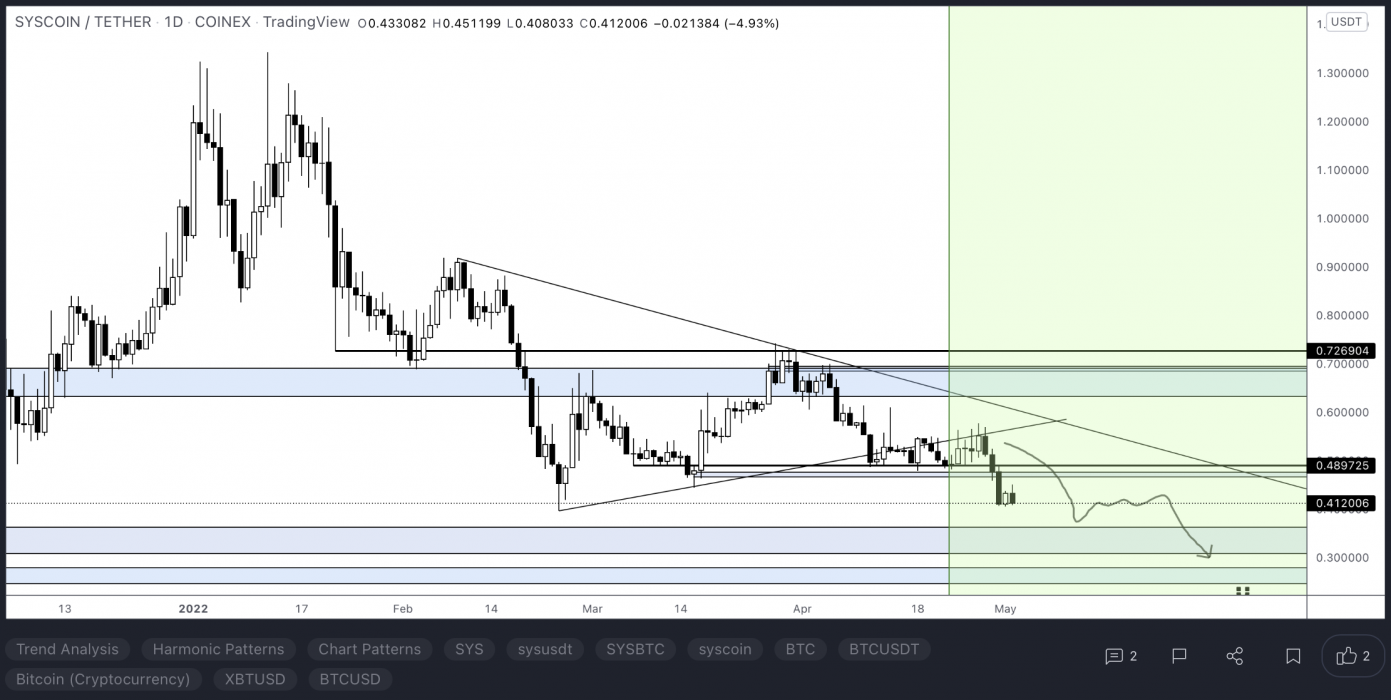
At the time of writing, SYS is ranked the 159th cryptocurrency globally and the current price is US$0.4138. Let’s take a look at the chart below for price analysis:

Source: TradingView

SYS has ranged between approximately $0.6865 and $0.3965 since late February. It is currently near the bottom of this range.

An inefficiently traded area near $0.4376 could provide resistance. However, eager bears should be wary since the price is very oversold relative to its local range.

Above, the 18 EMA and April’s consolidation low overlap with an inefficiently traded area at $0.4884. This area might also provide resistance during a retest. 

A more substantial rally may seek to return to the local range highs. This move would clear bear’s stops and may target an inefficiently traded area near the April monthly open at $0.6170.

Over the weekend, the price tested possible support at $0.4098, near the midpoint of October 2021’s accumulation range and relatively equal swing lows. It seems likely that the price will dip deeper into this support to run bulls’ stops.

If this support breaks, $0.3627 could provide bulls with their next level of interest. This level saw significant buying on a retracement before November’s rally and could provide support again.

Just below, $0.3090 may also provide support. This region had a significant five-week accumulation before early October 2021’s bullish rally and April 2021’s sudden upward spike.

2. Rari Governance Token (RGT)

The Rari Governance Token RGT is the native token behind Rari Capital. Rari Capital is a non-custodial DeFi Robo-advisor that autonomously earns users yield. It is a decentralised protocol for lending and borrowing. The Rari Governance Token is used for fee discounts and protocol governance.

RGT Price Analysis

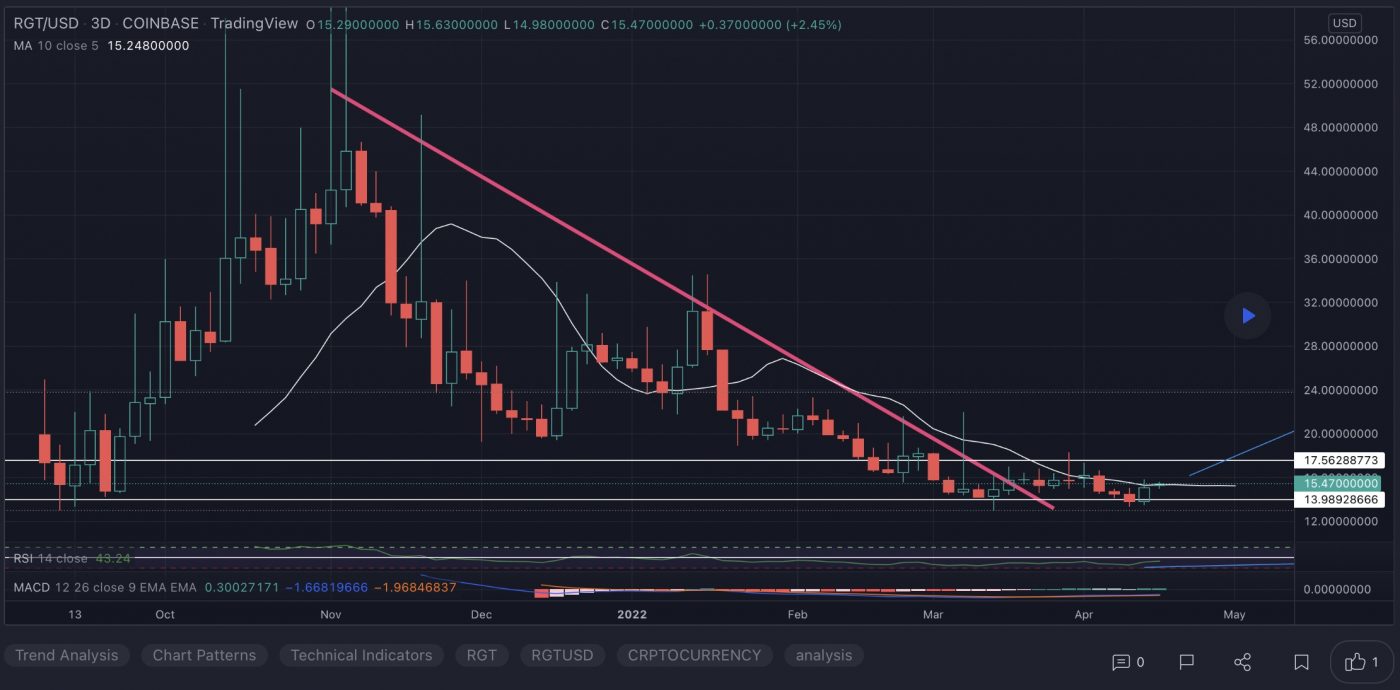
At the time of writing, RGT is ranked the 294th cryptocurrency globally and the current price is US$10.65. Let’s take a look at the chart below for price analysis:

Source: TradingView

RGT has been in a downtrend since early 2022. Last week saw an acceleration to the downside as hackers drained $80 million from its liquidity pools.

The sharp move to the downside created an inefficiently traded area between $11.59 and $12.55, which may provide resistance on a retest. This zone has confluence with the 9 EMA.

If this resistance breaks, the price may retest the bottom of March’s consolidation near $13.35. This area has confluence with the 18 EMA and soon the 40 EMA. 

A more significant rally could target the bottom of January’s consolidation, near $20.14. This climb may not happen until the overall market’s conditions turn more bullish.

Below, there is no price action to suggest higher-probability support levels. Extensions from March’s consolidation range hint at downside targets near $10.50, $8.00, and $5.50. The price is currently testing the closest of these levels.

3. Green Satoshi Token (GST)

Green Satoshi Token GST is the game token of STEPN — a Web 3.0 lifestyle app with inbuilt fun social elements and gamification design. STEPN is the first move-to-earn NFT game where players earn GST tokens by walking, jogging, and running outdoors while wearing NFT sneakers. GST tokens can also be used to level up and mint new sneakers, and players can sell/rent their NFT sneakers on the App Marketplace.

GST Price Analysis

At the time of writing, GST is ranked the 714th cryptocurrency globally and the current price is US$5.84. Let’s take a look at the chart below for price analysis:

Source: TradingView

GST has seen massive volatility recently as STEPN’s other coin, GMT, went on its parabolic run. GST’s price climbed 147% during April, dropped 60%, and is now retesting possible resistance.

Above the April monthly open, $5.73 to $6.06 could provide resistance. Breaking through this resistance could reach near $7.35, which is approximately the midpoint of last week’s long upper wick. If the price breaks this level, last week’s high near $9.45 provides another reasonable target.

Bulls stepped in on each recent drop below $5.14. This level could provide support again and has confluence with the 18 EMA. A move below this level might see support near the 40 EMA and accumulation on the weekly, near $4.61.

A more significant move down could target an old inefficiently traded area on the weekly between $4.05 and $3.67. The lower portion of this range, under $3.81, may provide higher-probability support.

Learn How to Trade Live!

Join Dave and The Crypto Den Crew and they’ll show you live on a webinar how to take your crypto trading to the next level.

Where to Buy or Trade Altcoins?

These coins have high liquidity on Binance Exchange, so that could help with trading on AUD/USDT/BTC pairs. And if you’re looking at buying and HODLing cryptos, then Swyftx Exchange is an easy-to-use popular choice in Australia.

Categories
Crypto News Fantom Internet Computer Market Analysis NEAR Protocol Trading

Top 3 Coins to Watch Today: FTM, ICP, NEAR – May 2 Trading Analysis

Let’s take a closer look at today’s altcoins showing breakout signals. We’ll explain what the coin is, then dive into the trading charts and provide some analysis to help you decide.

1. Fantom (FTM)

Fantom FTM is a directed acyclic graph (DAG) smart contract platform providing decentralised finance (DeFi) services to developers using its own bespoke consensus algorithm. Together with its in-house token FTM, Fantom aims to solve problems associated with smart-contract platforms – specifically transaction speed, which developers say they have reduced to under two seconds.

FTM Price Analysis

At the time of writing, FTM is ranked the 50th cryptocurrency globally and the current price is US$0.7426. Let’s take a look at the chart below for price analysis:

Source: TradingView

FTM‘s bounce during Q1 ran into resistance near the old monthly highs. This rejection created a set of relatively equal highs near $1.60, possibly forming the next bullish leg’s target.

Currently, the price is testing possible support near the weekly open, around $0.6911. This level also has confluence with the 78.6% retracement of the current local range and the 18 and 40 EMAs. 

If this level fails to provide support, a zone from $0.6534 to $0.6230 might mark a possible swing low or consolidation area. This zone is between the 61.8% and 75.6% retracement of early August’s swing.

A more bearish tone in the market could propel the price lower. The lows, near $0.5930, might mark an area of possible support as well as a bearish target.

2. Internet Computer (ICP)

The Internet Computer ICP is the world’s first blockchain that runs at web speed with unbounded capacity. It also represents the third major blockchain innovation, alongside Bitcoin and Ethereum – a blockchain computer that scales smart contract computation and data, runs them at web speed, processes and stores data efficiently, and provides powerful software frameworks to developers. By making this possible, the Internet Computer enables the complete reimagination of software, providing a revolutionary new way to build tokenised internet services, pan-industry platforms, decentralised financial systems, and even traditional enterprise systems and websites.

ICP Price Analysis

At the time of writing, ICP is ranked the 37th cryptocurrency globally and the current price is US$13.10. Let’s take a look at the chart below for price analysis:

Source: TradingView

During Q1, ICP also turned the corner, breaking a key swing high. This move could suggest a longer-term bullish trend.

The swing high near $20.24 stands out as a bullish target and marks an area of probable resistance. Further continuation could reach into possible resistance starting near $23.12.

Even if the bearish trend continues, a stop run at the recent swing low near $13.01 into possible support beginning near $12.75 is reasonable. If the price reaches further down, the swing low and possible support near $12.13 might provide another downside target. 

The area near $11.95 could also provide support. However, a drop this far could suggest a stop run below the higher-timeframe relatively equal lows near $11.40 into possible support beginning around $10.88.

3. Near Protocol (NEAR)

NEAR Protocol is a decentralised application platform designed to make apps usable on the web. The network runs on a Proof-of-Stake (PoS) consensus mechanism called Nightshade, which aims to offer scalability and stable fees. NEAR uses human-readable account names, unlike the cryptographic wallet addresses common to Ethereum. NEAR also introduces unique solutions to scaling problems and has its own consensus mechanism, called “Doomslug”.

NEAR Price Analysis

At the time of writing, NEAR is ranked the 19th cryptocurrency globally and the current price is US$11.98. Let’s take a look at the chart below for price analysis:

Source: TradingView

After its uptrend during Q1, NEAR has retraced 45% from its highs to support at the retracement of around $10.15.

The price shifted market structure to run to the consolidation lows near $12.11, just under the monthly open. A continued bearish trend in the market may create support just below, between $11.84 and $11.25.  

On the other hand, if the current resistance breaks, the price might find resistance near $17.98, whereas mid-January buyers may still be trapped in longs.

Learn How to Trade Live!

Join Dave and The Crypto Den Crew and they’ll show you live on a webinar how to take your crypto trading to the next level.

Where to Buy or Trade Altcoins?

These coins have high liquidity on Binance Exchange, so that could help with trading on AUD/USDT/BTC pairs. And if you’re looking at buying and HODLing cryptos, then Swyftx Exchange is an easy-to-use popular choice in Australia.
Categories
Crypto News dYdX Market Analysis Secret Terra Trading

Top 3 Coins to Watch Today: LUNA, DYDX, SCRT – April 29 Trading Analysis

Let’s take a closer look at today’s altcoins showing breakout signals. We’ll explain what the coin is, then dive into the trading charts and provide some analysis to help you decide.

1. Terra (LUNA)

Terra LUNA is a blockchain protocol that uses fiat-pegged stablecoins to power price-stable global payments systems. According to its whitepaper, Terra combines the price stability and wide adoption of fiat currencies with the censorship-resistance of Bitcoin, and offers fast and affordable settlements. Terra’s native token, LUNA, is used to stabilise the price of the protocol’s stablecoins. LUNA holders are also able to submit and vote on governance proposals, giving it the functionality of a governance token.

LUNA Price Analysis

At the time of writing, LUNA is ranked the 8th cryptocurrency globally and the current price is US$88.83. Let’s take a look at the chart below for price analysis:

Source: TradingView

LUNA showed significant strength in the face of a mostly bearish altcoin market, rallying over 105% during Q1.

The price is currently retracing from resistance near $116.90, just below the all-time high. Bulls might begin eyeing entries near $85.00, which will soon be near the 18 EMA and between the 61.8% and 78.6% retracement levels of the last leg upward.

A deeper retracement might reach an inefficient zone and the 40 EMA under the last daily swing low, between $82.44 and $79.10. A move below this low suggests a more bearish shift in market structure. If this shift occurs, it could create a short setup to target possible support at the upmove’s accumulation zone, near $74.41.

While the price is retracing, $96.44 offers the closest probable resistance at the yearly open. Just above, near the March monthly open, the consolidation lows near $102.69 are also a reasonable candidate for resistance.

If the price breaks through these resistances, the significant resistance at $108.69 might also break and allow LUNA to set new monthly highs. However, bulls should keep in mind that the overall market is mostly bearish, decreasing the chances of a massive bullish breakout. If the price does break the all-time high and enter discovery, overlapping extensions near $123.40 offer a possible significant target.

2. Dydx (DYDX)

DYDX is a governance token that allows the dYdX community to truly govern the dYdX Layer 2 Protocol. By enabling shared control of the protocol, DYDX allows traders, liquidity providers, and partners of dYdX to work collectively towards an enhanced protocol. DYDX enables a robust ecosystem around governance, rewards, and staking, each designed to drive future growth and decentralisation of dYdX, resulting in a better experience for users.

DYDX Price Analysis

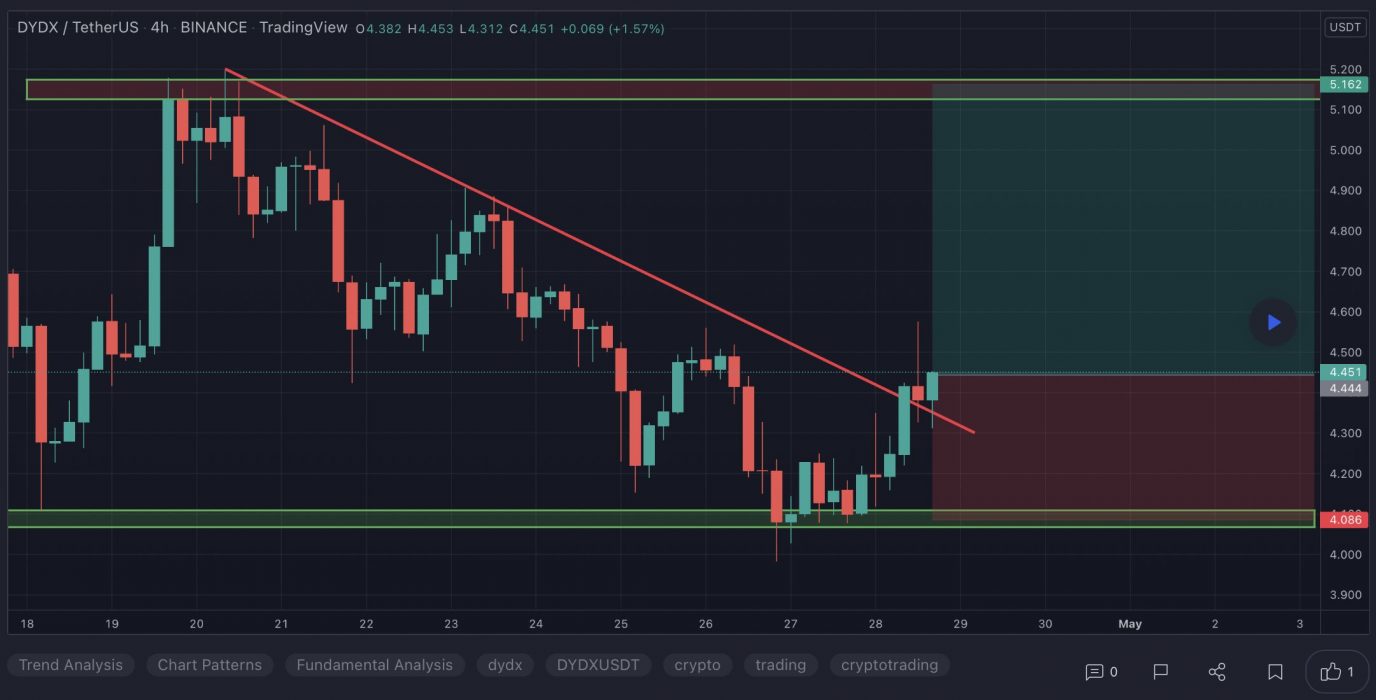
At the time of writing, DYDX is ranked the 165th cryptocurrency globally and the current price is US$4.50. Let’s take a look at the chart below for price analysis:

Source: TradingView

DYDX consolidated between $4.18 and $6.26 with the bulk of the volume concentrated in the lower half of the range. The price does not indicate a clear longer-term direction yet as stop orders build on both sides of the range.

Range traders will likely take profits or sell near $4.92. A stop run and swift rejection above $5.34 could provide a more favorable risk-to-reward entry for bears. An old 4h gap around $5.85 might cap this stop run.

Bulls will likely accumulate more long positions on a run below the relatively equal lows near $4.38. Little exists below the current range to identify precise support levels. However, the area between $4.30 and $4.25 could also give support during a deeper stop run.

If the price does break out decisively to the upside, the swing high at $6.10 provides a reasonable target. The highs and daily resistance levels between $6.27 and $6.40 may provide a second target.

3. Secret (SCRT)

Secret SCRT is the native coin of the Secret Network, a decentralised network for private/secure computation. Nodes on the network (known as secret nodes) can perform generalisable computations over encrypted data, which allows smart contracts (known as secret contracts) to use private and sensitive data as inputs. Our focus is on computational privacy, not just transactional privacy. Developers can build decentralised, privacy-preserving “Secret Apps” on the network. The privacy functionality of the Secret Network is critical for many fields, including decentralised finance, Web3, machine learning, access control, and many more.

SCRT Price Analysis

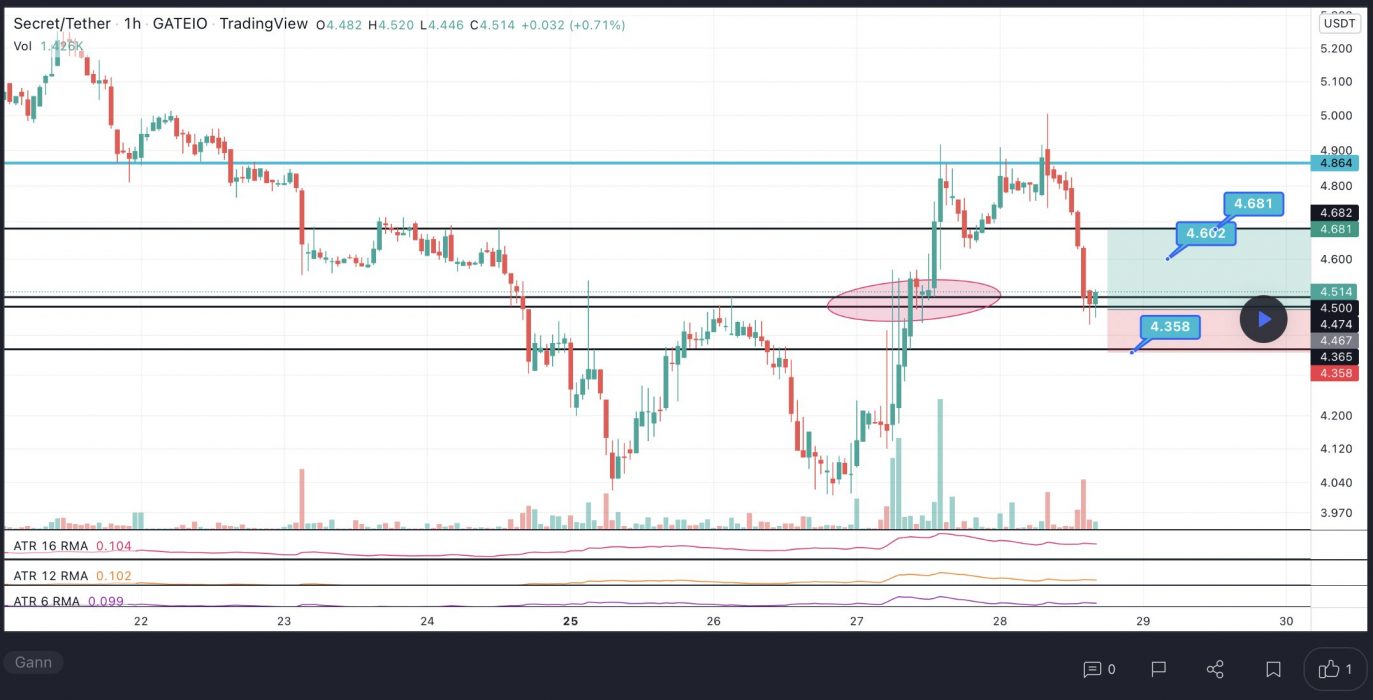
At the time of writing, SCRT is ranked the 95th cryptocurrency globally and the current price is US$4.57. Let’s take a look at the chart below for price analysis:

Source: TradingView

SCRT‘s 109% rally from its late December lows has retraced 70% and is entering higher-timeframe support.

An area from $4.45 to $4.10, near the low of Q4’s bullish leg and highs of early 2021’s consolidation, could provide some support.

However, relentless selling suggests that the price may continue dropping into a thinly traded area between $3.92 and $3.67, which has confluence with the 78.6% retracement of the previous Q3-Q4 rally.

Any retracement upward might meet resistance near $5.12, which has confluence with the 18 EMA and old resistance.

A stronger push through the probable resistance near $5.34 could reach $6.10, where the price consolidated over an old high. However, this may not happen until the next bullish cycle. 

Close above, a zone beginning near $6.28 may provide some resistance, with more sensitivity near $6.80.

Learn How to Trade Live!

Join Dave and The Crypto Den Crew and they’ll show you live on a webinar how to take your crypto trading to the next level.

Where to Buy or Trade Altcoins?

These coins have high liquidity on Binance Exchange, so that could help with trading on AUD/USDT/BTC pairs. And if you’re looking at buying and HODLing cryptos, then Swyftx Exchange is an easy-to-use popular choice in Australia.
Categories
Crypto News Gala Hedera Market Analysis Polygon Trading

Top 3 Coins to Watch Today: MATIC, HBAR, GALA – April 28 Trading Analysis

Let’s take a closer look at today’s altcoins showing breakout signals. We’ll explain what the coin is, then dive into the trading charts and provide some analysis to help you decide.

1. Polygon (MATIC)

Polygon MATIC is the first well-structured, easy-to-use platform for Ethereum scaling and infrastructure development. Its core component is Polygon SDK, a modular, flexible framework that supports building multiple types of applications. The MATIC token will continue to exist and will play an increasingly important role in securing the system and enabling governance.

MATIC Price Analysis

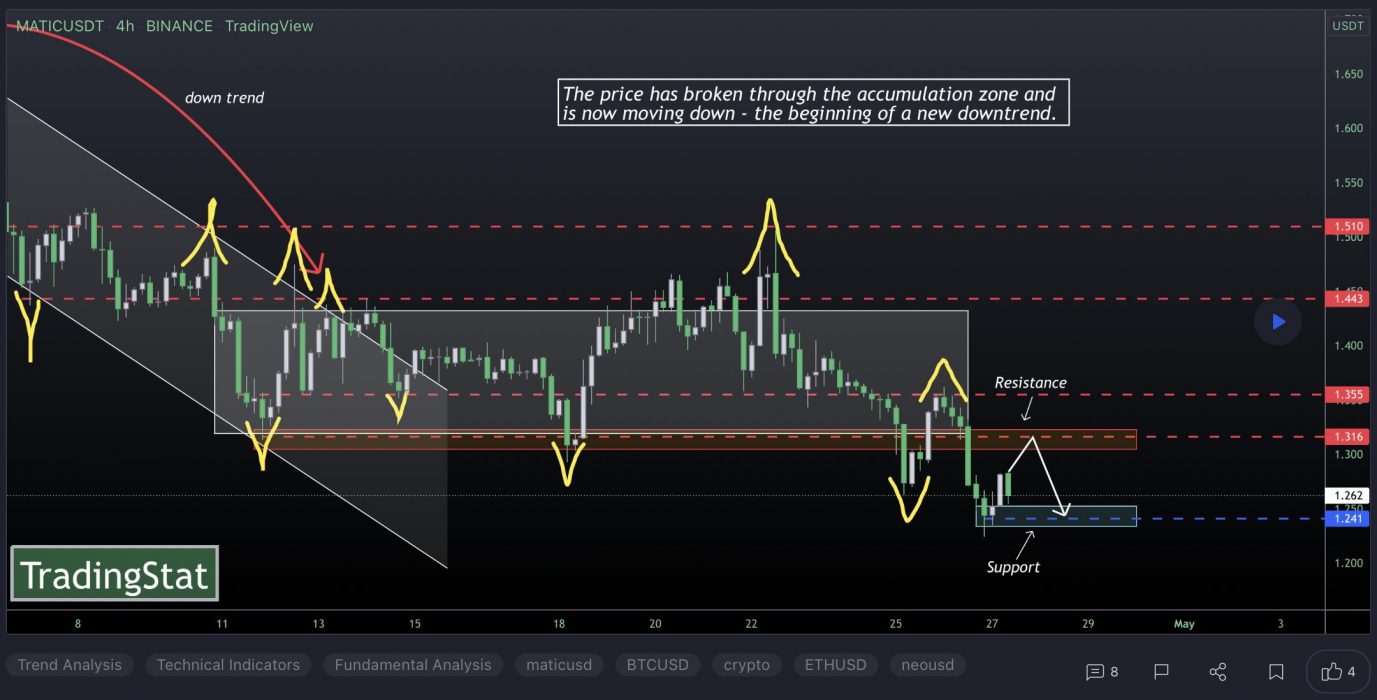
At the time of writing, MATIC is ranked the 17th cryptocurrency globally and the current price is US$1.26. Let’s take a look at the chart below for price analysis:

Source: TradingView

Since its Q1 highs, MATIC has been in a steady bearish trend – retracing nearly 25% by mid-April. The price found support near $1.20, at the 50.6% retracement level.

Last week’s sharp impulse up might have marked the start of a new bullish swing. If so, higher timeframes suggest that $1.39 near the 61.8% retracement, and the 9, 18 and 40 EMAs, may see interest from bulls. The price could reach lower, near $1.20, and still find support.

Currently, the price is contesting a region between $1.19 and $1.35. Closes over this level could confirm it as new support, leading to a move higher.

However, bulls are contending with probable resistance near $1.44, while $1.53 is also likely to be sensitive with the nearest support and resistance this close together.

2. Hedera (HBAR)

Hedera Hashgraph HBAR is a public network that allows individuals and businesses to create powerful decentralised applications (DApps). It is designed to be a fairer, more efficient system that eliminates some of the limitations older blockchain-based platforms face, such as slow performance and instability. The HBAR token has a dual role within the Hedera public network.

HBAR Price Analysis

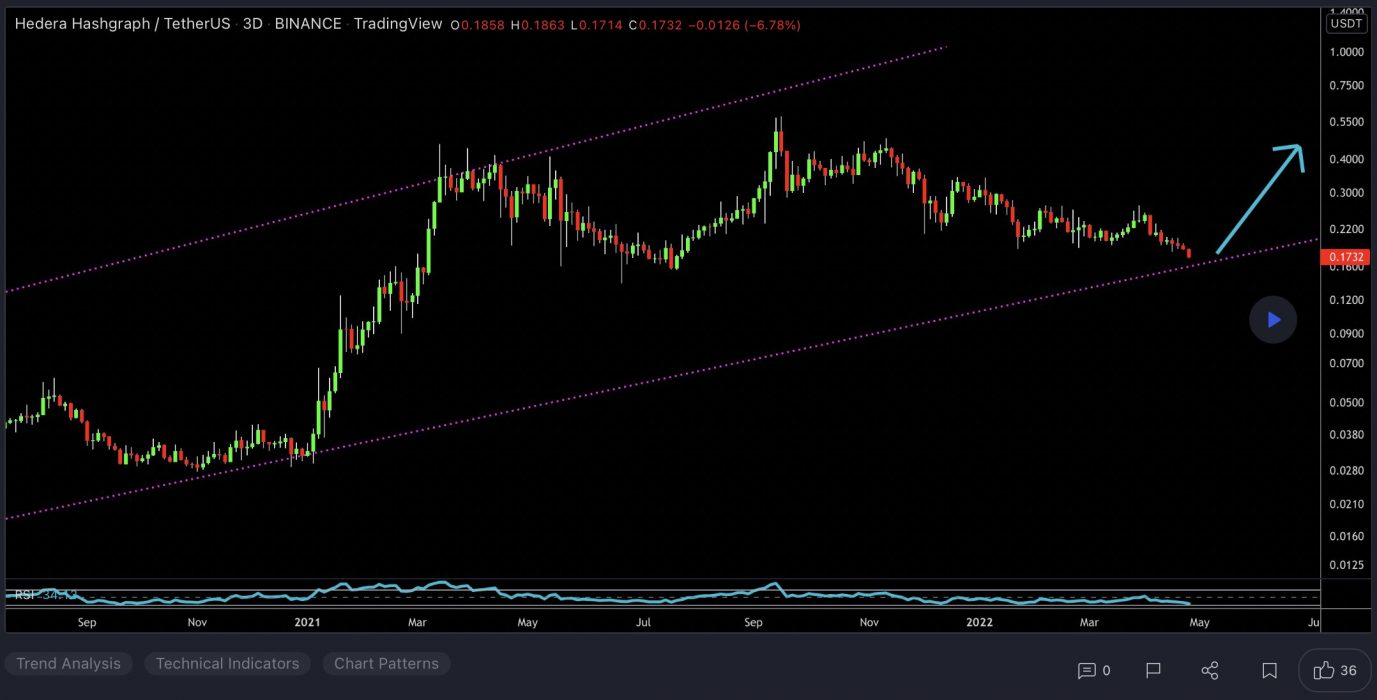
At the time of writing, HBAR is ranked the 36th cryptocurrency globally and the current price is US$0.1691. Let’s take a look at the chart below for price analysis:

Source: TradingView

HBAR‘s 50% Q1 run retraced almost to its origin, narrowly missing probable support near $0.1695 before bears swatted down the bounce near resistance around $0.1989.

With the daily gap between $0.1812 and $0.1750 almost filled in a single wick, the price may not need to revisit areas below this level. However, the safer entry is still in probable support between $0.1545 and $0.1500, which would also sweep the lows of last week’s bounce.

The relatively equal highs near $0.2256 provide a likely first target on lower timeframes. However, the resistance beginning at $0.2435 may initially suppress a further move up.

A clean break through this resistance will need to contend with the next resistance near $0.2692, under the last swing high. This swing high at $0.2770 gives a reasonable take-profit area before a possible move to the 1.0 extension near $0.2956.

3. Gala (GALA)

GALA aims to take the gaming industry in a different direction by giving players back control over their games. Gala Games’ mission is to make “blockchain games you’ll actually want to play”. The project wants to change the fact that players can spend hundreds of dollars on in-game assets and countless hours playing the game, all of which could be taken away from them with the click of a button. It plans to reintroduce creative thinking into games by giving players control of the games and in-game assets with the help of blockchain technology.

GALA Price Analysis

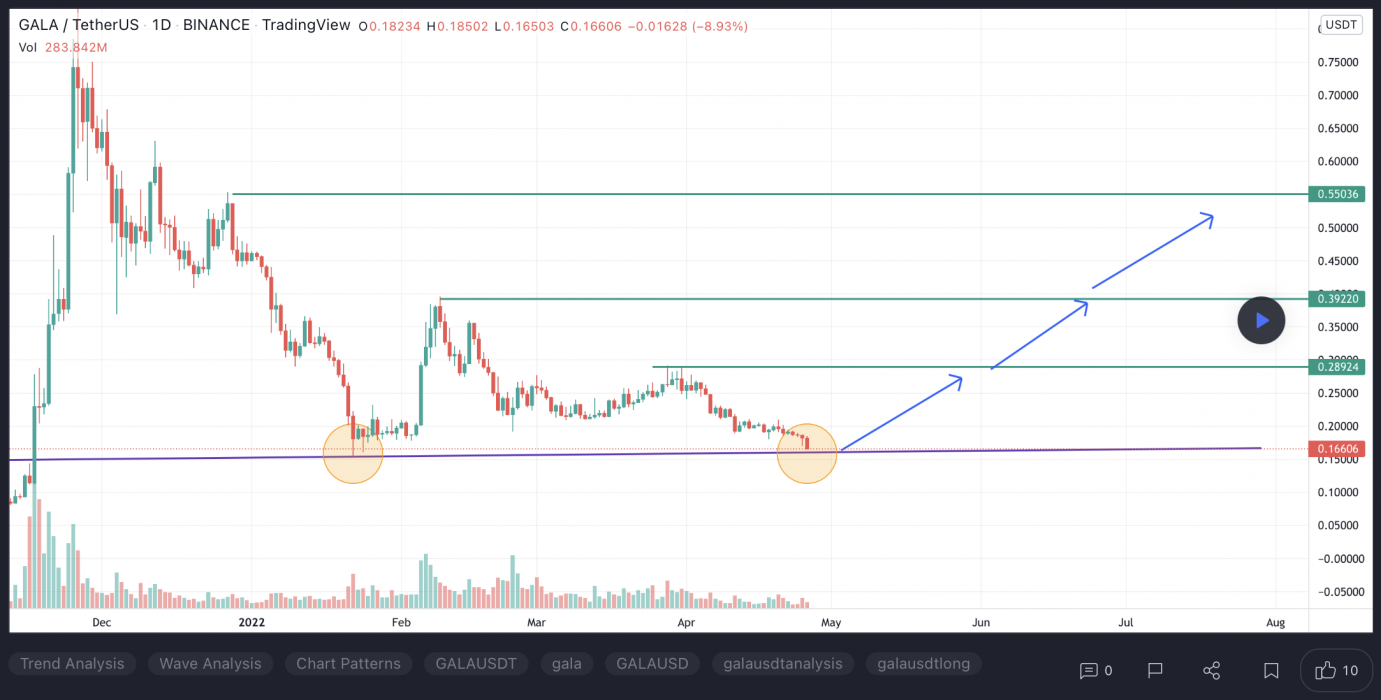
At the time of writing, GALA is ranked the 74th cryptocurrency globally and the current price is US$0.1688. Let’s take a look at the chart below for price analysis:

Source: TradingView

After setting a low last week, GALA turned into a recovery trend to make the new monthly highs.

The following 60% plummet found support near $0.1679, sweeping under the 40 EMA into the 58.8% retracement level before bouncing to resistance beginning at $0.1930.

This area could continue to provide resistance, possibly causing a retracement to the 9 EMA and 18 EMA near $0.2112, where aggressive bulls might begin bidding. The level near $0.2350, which has confluence with the 40 EMA, may see more interest from bulls loading up for an attempt on probable resistance beginning near $0.2685. 

However, if Bitcoin continues its sideways trend, much lower prices could be seen. The old support near $0.1580 could provide at least a short-term bounce. If this level fails, the old highs near $0.1435 might also give support and see the start of a new bullish cycle after retesting these support levels.

Learn How to Trade Live!

Join Dave and The Crypto Den Crew and they’ll show you live on a webinar how to take your crypto trading to the next level.

Where to Buy or Trade Altcoins?

These coins have high liquidity on Binance Exchange, so that could help with trading on AUD/USDT/BTC pairs. And if you’re looking at buying and HODLing cryptos, then Swyftx Exchange is an easy-to-use popular choice in Australia.
Categories
Cardano COTI Crypto News iExec RLC Market Analysis Trading

Top 3 Coins to Watch Today: ADA, COTI, RLC – April 27 Trading Analysis

Let’s take a closer look at today’s altcoins showing breakout signals. We’ll explain what the coin is, then dive into the trading charts and provide some analysis to help you decide.

1. Cardano (ADA)

Cardano ADA is a proof-of-stake blockchain platform whose stated goal is to allow “changemakers, innovators and visionaries” to bring about positive global change. The open-source project also aims to “redistribute power from unaccountable structures to the margins to individuals”, helping to create a society that is more secure, transparent, and fair. Cardano is used by agricultural companies to track fresh produce from field to fork, while other products built on the platform allow educational credentials to be stored in a tamper-proof way, and retailers to clamp down on counterfeit goods.

ADA Price Analysis

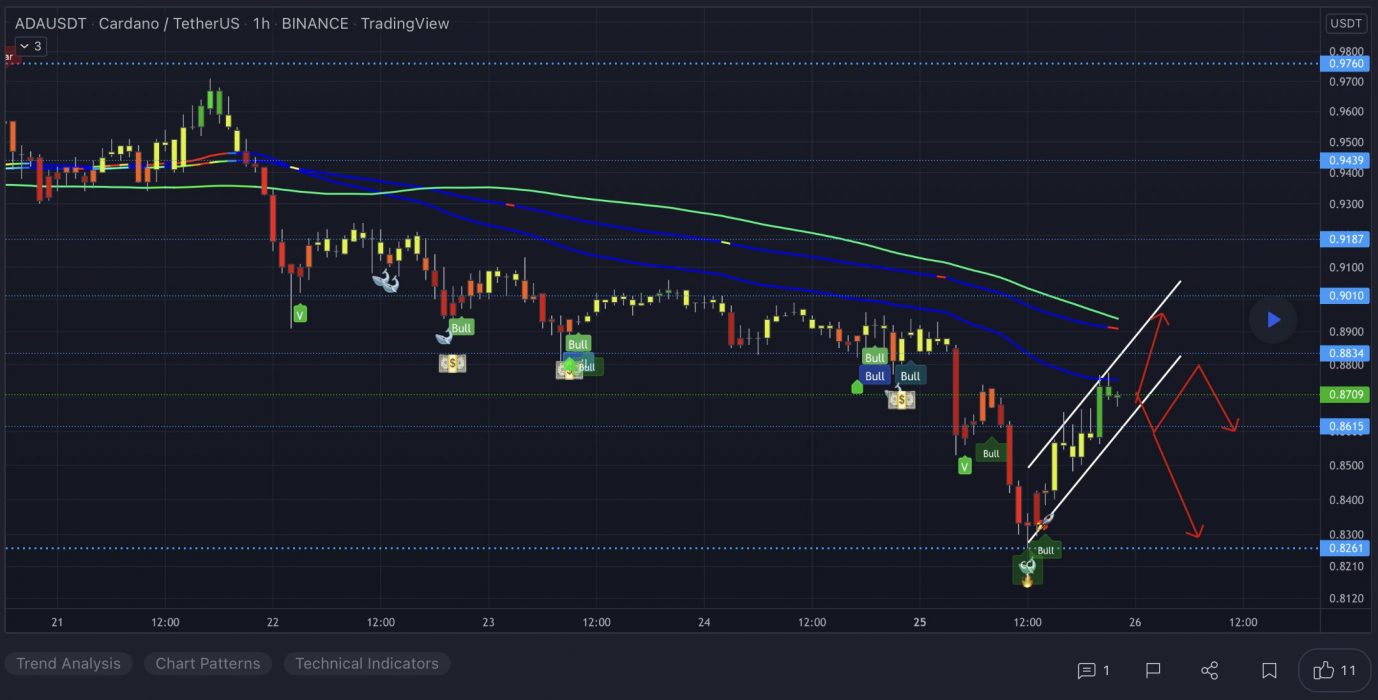
At the time of writing, ADA is ranked the 9th cryptocurrency globally and the current price is US$0.8328. Let’s take a look at the chart below for price analysis:

Source: TradingView

ADA‘s near 55% drop during Q1 found a low near $0.7935 during mid-March before closing over a short-term high.

This daily close over the high could signal a shift in market structure that may reach probable resistance near $0.8815. A sustained bullish move may target the swing high at $0.9622. If this stop run occurs, a run beyond the high into probable resistance near $1.10 and $1.15 is possible.

Bulls could buy a retracement to possible support near $0.8145, just above the weekly open. A bearish turn in the marketplace may propel the price toward possible support near $0.7925. 

However, relatively equal lows near $0.7757 and $0.7522 provide an attractive target for bears if the market resumes its bearish trend. A run on these lows might find support between $0.7347 and $0.7152.

2. Coti (COTI)

COTI markets itself as the first enterprise-grade fintech platform that empowers organisations to build their own payment solutions, as well as digitise any currency to save time as well as money. COTI is one of the world’s first blockchain protocols that is optimised for decentralised payments and designed for use by merchants, governments, payment DApps, and stablecoin issuers. The ecosystem has a DAG-based blockchain, proof-of-trust consensus algorithm, multiDAG, GTS (Global Trust System), a universal payment solution, and a payment gateway.

COTI Price Analysis

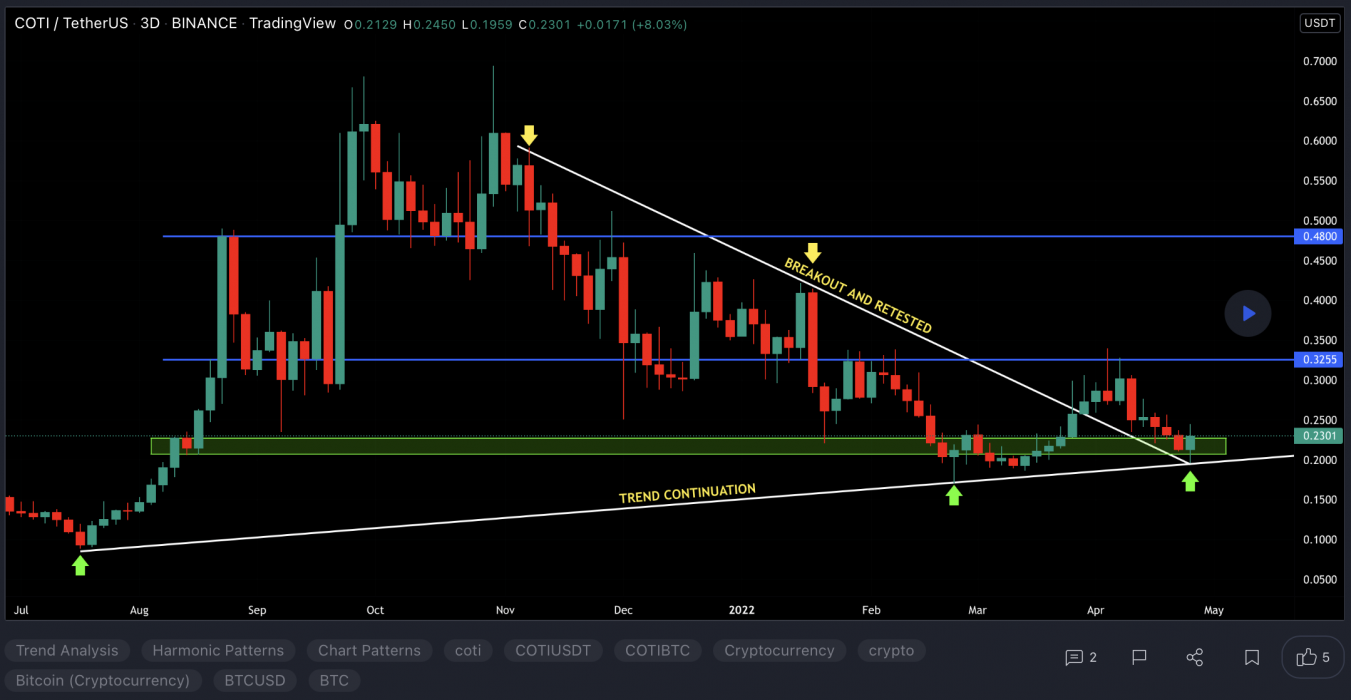
At the time of writing, COTI is ranked the 185th cryptocurrency globally and the current price is US$0.2209. Let’s take a look at the chart below for price analysis:

Source: TradingView

COTI‘s rally during H2 2021 broke down in November and has since been in a bearish trend on the daily chart. The price recently swept lows below a contested area at $0.1942, which prompted a rally during the last week into resistance at the 40 EMA near $0.3148. 

It remains to be seen whether this contested area from $0.2073 to $0.1910 can support a retest.

Unless the overall market turns bullish, a bearish continuation to possible support near $0.2155 – just under the 79.6% retracement level – seems likely. This area has sparked multiple consolidations.

A break of this level might continue to possible support near $0.1799, where the H2 2021 rally began accumulating before its run.

If the market continues its rally, breaking through resistance near the 2021 yearly open, the macro range highs near $0.3415 might provide the next resistance.

3. iExec Rlc (RLC)

iExec RLC claims to have developed the first decentralised marketplace for cloud computing resources. Blockchain technology is used to organise a market network where users can monetise their computing power, applications and datasets. By providing on-demand access to cloud computing resources, iExec is reportedly able to support compute-intensive applications in fields such as AI, big data, healthcare, rendering, or FinTech.

RLC Price Analysis

At the time of writing, RLC is ranked 147th cryptocurrency globally and the current price is US$1.81. Let’s take a look at the chart below for price analysis:

Source: TradingView

RLC printed nearly +46% gains during March. After this move, the price has been consolidating for the past week around a monthly level near $1.80.

Overlapping support zones should provide bullish strength, with the current region beginning at $1.72 providing a reasonable entry accompanied by a wide stop. Relatively equal daily lows near $1.66 could prompt a stop run that provides a better entry, maybe as low as the next overlapping support area near $1.60.

Last month’s high near $1.98 provides the highest probability target, with the next swing high inside resistance at $2.08 giving another target and potential short-term reversal area.

A strong move through this level into resistance beginning at $2.15 is likely to target the monthly high at $2.19, potentially reaching the next monthly high near $2.25.

Learn How to Trade Live!

Join Dave and The Crypto Den Crew and they’ll show you live on a webinar how to take your crypto trading to the next level.

Where to Buy or Trade Altcoins?

These coins have high liquidity on Binance Exchange, so that could help with trading on AUD/USDT/BTC pairs. And if you’re looking at buying and HODLing cryptos, then Swyftx Exchange is an easy-to-use popular choice in Australia.
Categories
Crypto News Market Analysis Mines of Dalarnia Theta Network Trading

Top 3 Coins to Watch Today: THETA, DAR, 10SET – April 26 Trading Analysis

Let’s take a closer look at today’s altcoins showing breakout signals. We’ll explain what the coin is, then dive into the trading charts and provide some analysis to help you decide.

1. Theta Network (THETA)

Theta Network THETA is a blockchain-powered network purpose-built for video streaming. Launched in March 2019, the Theta mainnet operates as a decentralised network in which users share bandwidth and computing resources on a peer-to-peer (P2P) basis. Theta features its own native cryptocurrency token, THETA, which performs various governance tasks within the network, and counts Google, Binance, Blockchain Ventures, Gumi, Sony Europe and Samsung as Enterprise validators, along with a Guardian network of thousands of community-run guardian nodes.

THETA Price Analysis

At the time of writing, THETA is ranked the 40th cryptocurrency globally and the current price is US$2.91. Let’s take a look at the chart below for price analysis:

Source: TradingView

THETA has formed a clean range between $4.388 and $2.274. The price is likely to run these equal highs and lows before the next significant move.

The price is currently near the low end of the range. On the monthly chart, an old, inefficiently traded area down to $2.784 could provide support. This support might create a bounce back up to the old range highs.

If this level breaks, a broad zone between $1.460 and $0.680 could be the next support. This area shows inefficient trading on the monthly and weekly charts.

Shorter-term traders might frame a short near $3.009. Here, an inefficiently traded area on the daily chart could provide resistance. Just above, $3.080 might also provide resistance. This level is near the current consolidation range’s highs.

Current price action makes it unclear where bulls are most likely to find the current range’s next resistance. A bullish reversal will likely draw to the relatively equal highs at $4.388. Bears might stop the price first at an area of old bullish rejection on the monthly, near $4.198.

2. Mines of Dalarnia (DAR)

Mines of Dalarnia DAR is an action-adventure game with a blockchain real-estate market. MoD is based on a simple and simultaneously captivating gameplay where users can mine and combine in-game items, then utilise them to upgrade their characters (skills and equipment), thereby increasing their rank in the game. Players can go in search of rare artifacts/relics/minerals, complete quests, team up with other players to defeat monsters, and unlock rewards.

DAR Price Analysis

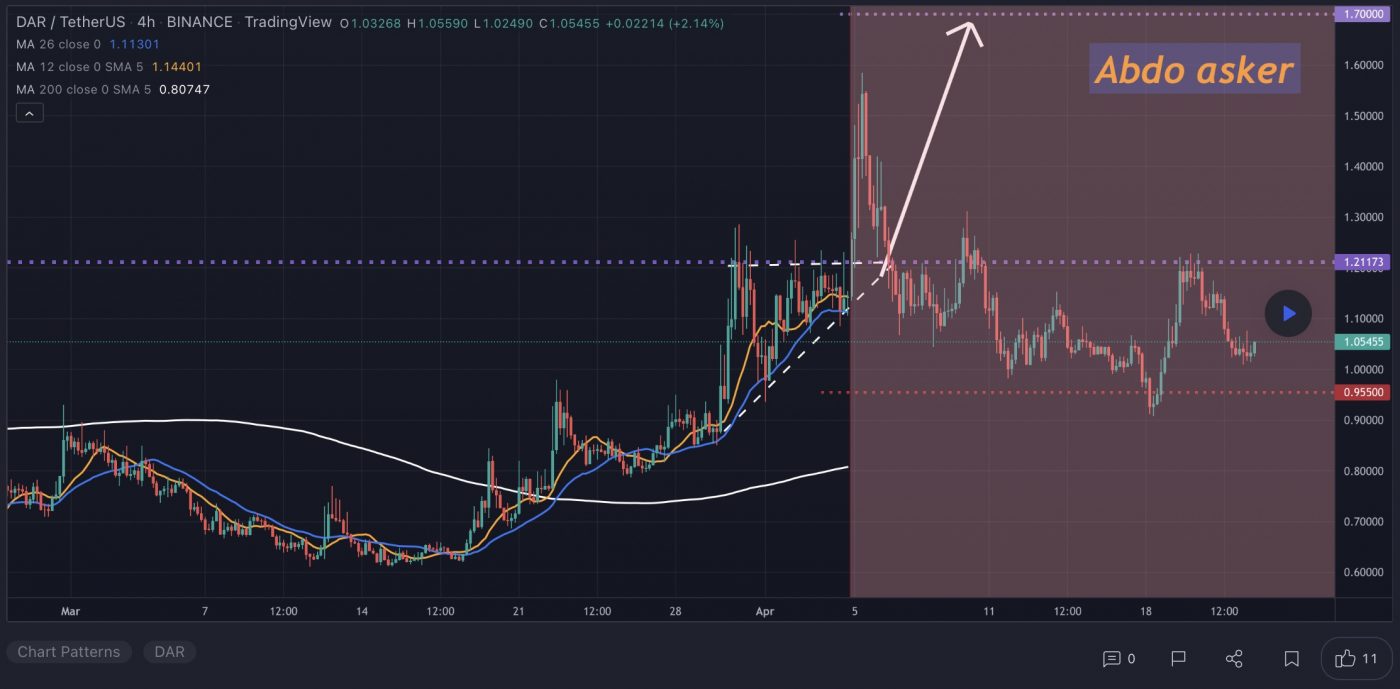
At the time of writing, DAR is ranked the 256th cryptocurrency globally and the current price is US$1.05. Let’s take a look at the chart below for price analysis:

Source: TradingView

After a rapid 77% selloff in late December 2021, DAR has formed a range between approximately $1.30 and $0.60.

The price is currently testing an old inefficiently traded area near $0.9724. It is reasonable to expect a stop run below the old swing low at $0.9080.

If the price runs below this low, a small inefficiently traded area on the weekly chart at $0.8478 could be the target. These levels are between the 61.8% and 78.6% retracement of March and April’s rally.

A deeper move might target an old swing low and area of bullish rejection on the monthly chart, near $0.7906. Below this level, historical price action shows no support.

An area near $1.1053 offers the closest probable resistance. It is in the middle of the recent consolidation range and near the April monthly open.

Above this level, an old swing high and bottom of an inefficiently traded area on the monthly chart, near $1.3060, may offer the next resistance. 

A larger rally could reach between $1.8168 and $1.585. This area shows inefficient trading on the monthly and weekly charts.

3. Tenset (10SET)

Tenset 10SET is an emerging blockchain project that envisions itself to be the bridge between crypto assets and the traditional stock market. It employs the new generation ETF 2.0 deflationary token as well as an intelligent staking method. Its goal is to speed up the adoption of cryptocurrencies and blockchain by the financial markets. According to its official website, it is capitalising on the current state of the economy as it approaches the fourth industrial revolution.

10SET Price Analysis

At the time of writing, 10SET is ranked the 3058th cryptocurrency globally and the current price is US$2.73. Let’s take a look at the chart below for price analysis:

Source: TradingView

10SET rallied 250% during February and March and is aggressively retracing this move after consolidating through April.

The price broke below an inefficiently traded area on the weekly chart between $2.750 and $2.863. This zone could provide resistance during a retest. 

Above, the April monthly open, early April’s consolidation low, and the inefficiently traded area on the daily chart near $3.448 might also provide resistance.

The price may be seeking stops under the closest swing low near $2.250. This level could provide support. However, the current bearish market conditions might drag the price further down. Bears could next be targeting an inefficiently traded area on the daily chart near $1.744.

A move this low might reach into the range lows and accumulation area between $1.501 and $1.248. If bulls begin accumulating, the upper end of this range is more likely to provide support.

Learn How to Trade Live!

Join Dave and The Crypto Den Crew and they’ll show you live on a webinar how to take your crypto trading to the next level.

Where to Buy or Trade Altcoins?

These coins have high liquidity on Binance Exchange, so that could help with trading on AUD/USDT/BTC pairs. And if you’re looking at buying and HODLing cryptos, then Swyftx Exchange is an easy-to-use popular choice in Australia.

Categories
Crypto News Market Analysis Smooth Love Potion Solana Trading Zcash

Top 3 Coins to Watch Today: ZEC, SOL, SLP – April 25 Trading Analysis

Let’s take a closer look at today’s altcoins showing breakout signals. We’ll explain what the coin is, then dive into the trading charts and provide some analysis to help you decide.

1. Zcash (ZEC)

Zcash ZEC is a decentralised cryptocurrency focused on privacy and anonymity. It uses the zk-SNARK zero-knowledge proof technology that allows nodes on the network to verify transactions without revealing any sensitive information about those transactions. Zcash transactions, on the other hand, still have to be relayed via a public blockchain, but unlike pseudonymous cryptocurrencies, ZEC transactions by default do not reveal the sending and receiving addresses or the amount being sent.

ZEC Price Analysis

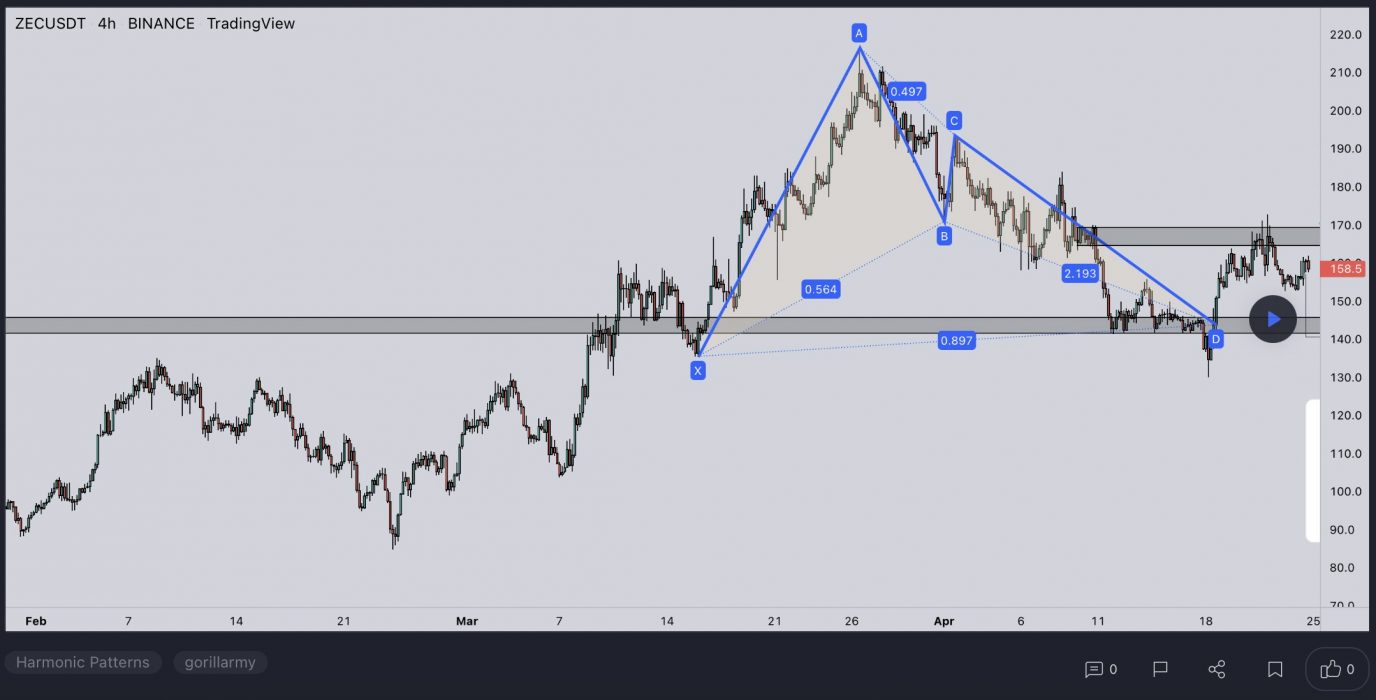
At the time of writing, ZEC is ranked the 50th cryptocurrency globally and the current price is US$158.86. Let’s take a look at the chart below for price analysis:

Source: TradingView

ZEC‘s recent bearish flip of the 9, 18, and 40 EMAs might cause bulls to be less aggressive in bidding. However, possible support near $146.47 and $155.96 – between the 41.8% and 58.6% retracements – could see at least a short-term bounce. 

Last year’s long-term consolidation suggests that the areas near $138.23 may be more likely to cause a longer-term trend reversal. 

Bears are likely to add to their shorts at probable resistance beginning near $168.50, which has confluence with the 18 EMA. A fast break of this resistance could trigger more selling near $190.12, the start of the bearish move.

If an aggressive bullish move does appear, trapped buyers in the probable resistance beginning near $210.32 might provide a ceiling for this impulse.

2. Solana (SOL)

Solana SOL is a highly functional open-source project that banks on blockchain technology’s permissionless nature to provide decentralised finance (DeFi) solutions. The Solana protocol is designed to facilitate decentralised app (DApp) creation. It aims to improve scalability by introducing a proof-of-history (PoH) consensus combined with the underlying proof-of-stake (PoS) consensus of the blockchain.

SOL Price Analysis

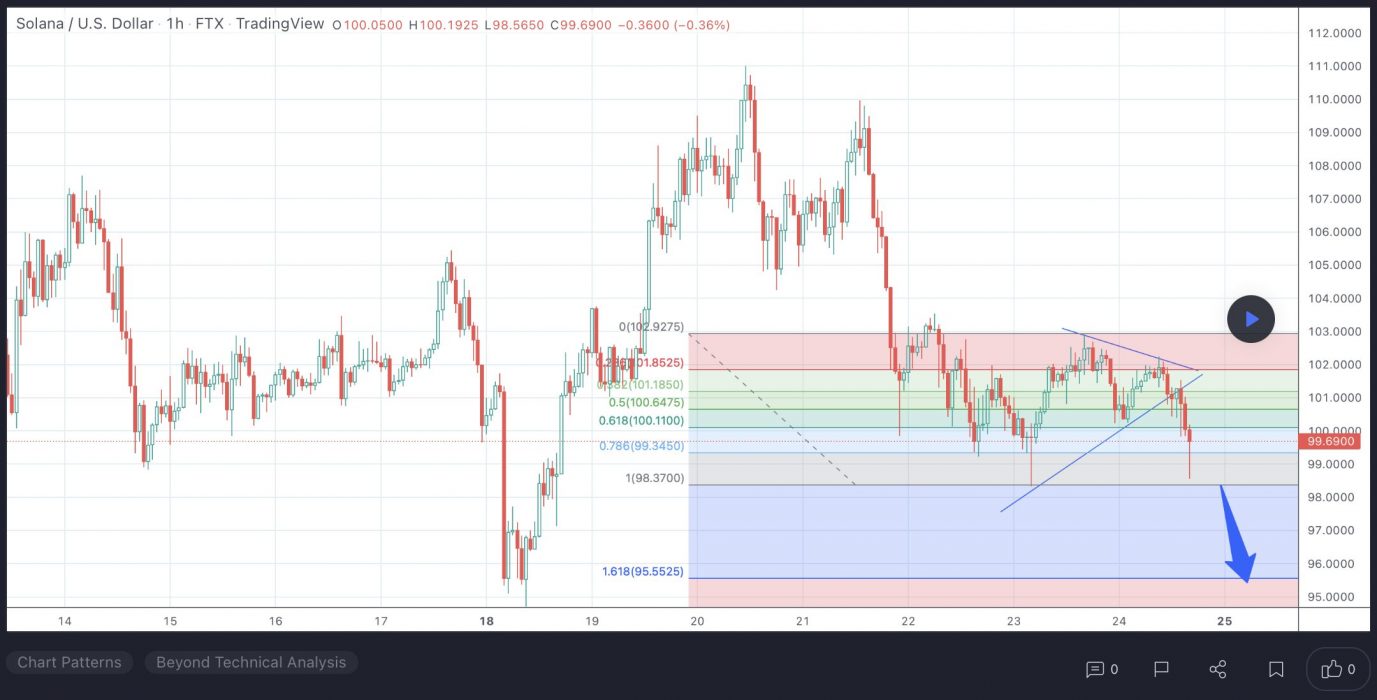
At the time of writing, SOL is ranked the 7th cryptocurrency globally and the current price is US$99.11. Let’s take a look at the chart below for price analysis:

Source: TradingView

SOL has retraced 68% from its December highs and reached possible support last month near $89.34. Resistance might begin near $120.34, which has confluence with the 9 and 18 EMAs.

A more substantial rally might reach near the swing high at $110.23 and the 40 EMA. This high is less likely to break if bears plan to continue the downtrend without a lengthier consolidation.

While not highly probable in the current market conditions, a more animated move upward could reach a wide resistance area between $126.42 and $133.94. This zone is where the last movement down accumulated positions before breaking down. 

Possible support rests near $96.34, which showed sensitivity on the last test. While it could provide support again, the higher-timeframe bearish trend is more likely to propel the price into an inefficient area between $91.10 and $87.54. If the price reaches this zone, the May 2021 swing high near $82.13 might mark a more sensitive level.

3. Smooth Love Potion (SLP)

Smooth Love Potion SLP tokens are earned by playing the Axie Infinity game. This digital asset serves as a replacement for experience points. SLP are ERC-20 tokens, and they can be used to breed new digital pets known as Axies. The cost of breeding begins at 100 SLP but increases gradually, rising to 200 SLP for the second breed, 300 for the third, 500 for the fourth, 800 for the fifth, and 1,300 for the sixth. Axies can be bred a maximum of seven times, and the seventh breed costs 2,100 SLP. This limit exists in order to prevent hyperinflation in the marketplace.

SLP Price Analysis

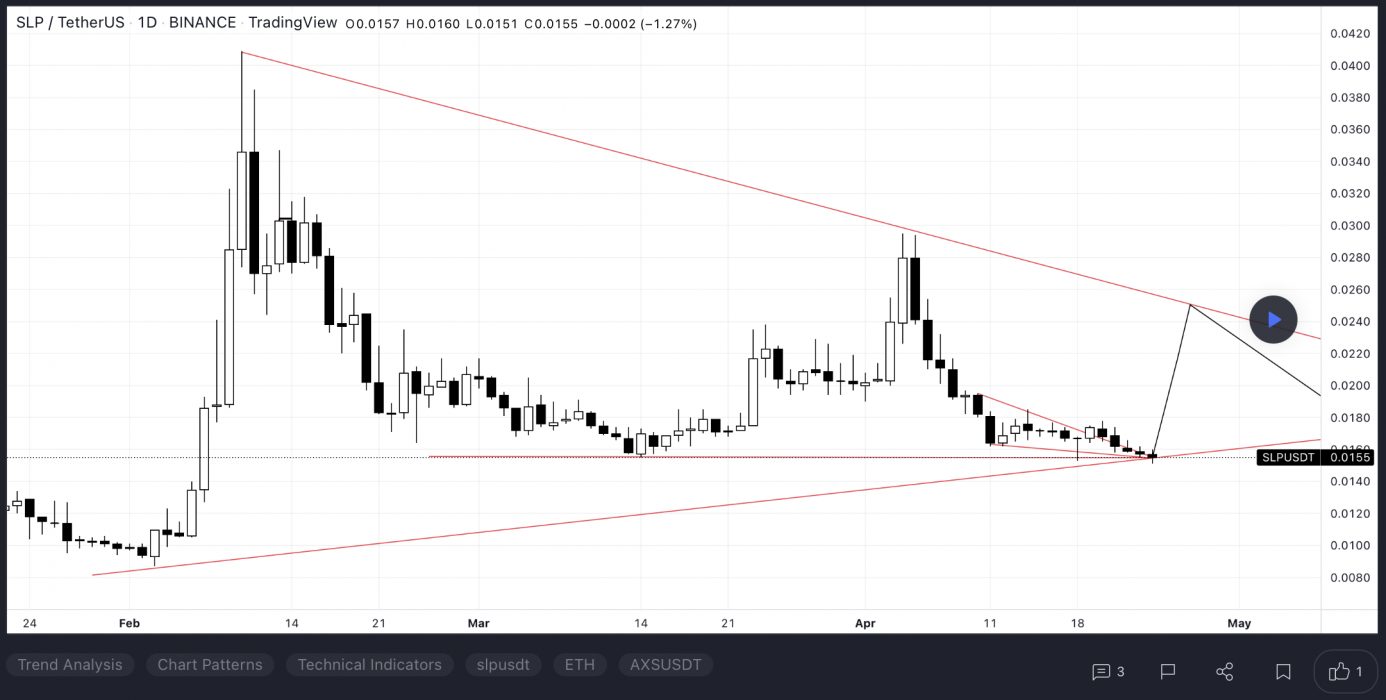
At the time of writing, SLP is ranked the 420th cryptocurrency globally and the current price is US$0.01547. Let’s take a look at the chart below for price analysis:

Source: TradingView

SLP‘s 65% rally during Q1 ran into a 30% retracement near $0.01615. Since then, the price has been consolidating in a 40% range between $0.01424 and $0.02432.

Just below the late-March low, $0.01500 is the first level likely to provide substantial support. If the price breaks down through this level, overlapping levels near $0.01458 might cap a run on the lows near $0.01410 and $0.01385.

The higher-timeframe analysis points to the area near $0.02351 as the next substantial resistance. Significant selling has been occurring here on the daily chart. If this level breaks, the swing highs near $0.02827 and $0.03060 may be the next targets.

Learn How to Trade Live!

Join Dave and The Crypto Den Crew and they’ll show you live on a webinar how to take your crypto trading to the next level.

Where to Buy or Trade Altcoins?

These coins have high liquidity on Binance Exchange, so that could help with trading on AUD/USDT/BTC pairs. And if you’re looking at buying and HODLing cryptos, then Swyftx Exchange is an easy-to-use popular choice in Australia.

Categories
Crypto News DigiByte Market Analysis Trading VeThor Token Waves

Top 3 Coins to Watch Today: DGB, WAVES, VET – April 22 Trading Analysis

Let’s take a closer look at today’s altcoins showing breakout signals. We’ll explain what the coin is, then dive into the trading charts and provide some analysis to help you decide.

1. DigiByte (DGB)

DigiByte DGB is an open-source blockchain and asset creation platform. A longstanding public blockchain and cryptocurrency, DigiByte uses five different algorithms to improve security, and originally aimed to improve on the Bitcoin blockchain’s security, capacity and transaction speed. DigiByte consists of three layers: a smart contract “App Store”, a public ledger, and the core protocol featuring nodes communicating to relay transactions.

DGB Price Analysis

At the time of writing, DGB is ranked the 144th cryptocurrency globally and the current price is US$0.02628. Let’s take a look at the chart below for price analysis:

Source: TradingView

After retracing nearly 56% since the beginning of Q2, a 30% range has trapped DGB between $0.03449 and $0.02322 during April.

A consolidation near $0.02192, visible on the weekly chart, provided support on the last touch. This level could provide support again on a stop run under the $0.02015. 

A deeper run-on stop at $0.01920 might reach the top of a higher-timeframe gap at the same level. However, a push this low reduces the chance of a new monthly high soon. Below, little significant support exists until $0.01713.

Higher-timeframe levels overlapping with a daily gap beginning at $0.02895 are likely to provide resistance, perhaps on a sweep of the equal highs near $0.03240. Breaking this resistance makes the relatively equal highs near $0.03755 and the monthly high at $0.03947 the next probable targets.

2. Waves (WAVES)

WAVES is a multi-purpose blockchain platform that supports various use cases, including decentralised applications (DApps) and smart contracts. The platform has undergone various changes and added new spin-off features to build on its original design. Waves’ native token is WAVES, an uncapped supply token used for standard payments such as block rewards. Waves initially set out to improve on the first blockchain platforms by increasing speed, utility and user-friendliness.

WAVES Price Analysis

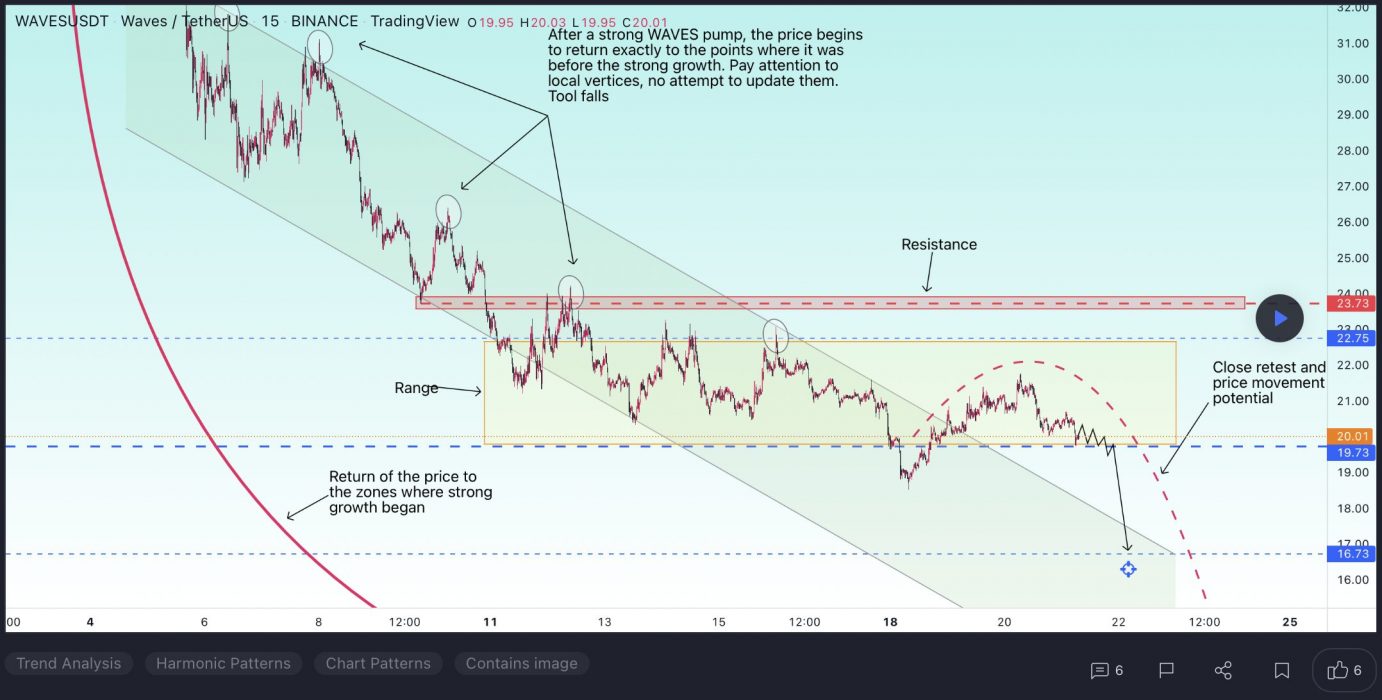
At the time of writing, WAVES is ranked the 52nd cryptocurrency globally and the current price is US$20.27. Let’s take a look at the chart below for price analysis:

Source: TradingView

During April’s high, WAVES‘ slight drop marks the current range as a reasonable area to expect accumulation.

The recent bearish flip of the 9, 18 and 40 EMAs might cause bulls to be less aggressive in bidding. However, possible support near $20.12 and $18.35 – between the 31.8% and 40.6% retracements – could see at least a short-term bounce. 

Long-term consolidation suggests that the areas near $29.45 and $34.61 may be more likely to cause a longer-term trend reversal.

Bears are likely to add to their shorts at probable resistance beginning near $28.77, which has confluence with the 18 EMA. A fast break of this resistance could trigger more selling near $32.42, the start of the bearish move.

3. VeChain (VET)

VeChain VET is a blockchain-powered supply chain platform. VeChain aims to use distributed governance and Internet of Things (IoT) technology to create an ecosystem that solves some of the major problems with supply chain management. The platform uses two in-house tokens, VET and VTHO, to manage and create value based on its VeChainThor public blockchain. The idea is to boost the efficiency, traceability and transparency of supply chains while reducing costs and placing more control in the hands of individual users.

VET Price Analysis

At the time of writing, VET is ranked the 35th cryptocurrency globally and the current price is US$0.06087. Let’s take a look at the chart below for price analysis:

Source: TradingView

VET‘s 65% move during late March ran into resistance near $0.08120, at the 27% extension of the Q1 swing.

An old high and the 18 EMA have provided support near $0.05833 and may give support again on a retest. This area also has confluence with the 50% and 62.8% retracements of November’s swing.

Just below, near $0.05493, the 55.8% retracement of the current Q1 swing might also mark an area of support. 

If the market turns bearish, $0.05072 is unlikely to be revisited but could see interest from bulls during any deeper retracement.

An area near $0.07418, at the 50% extension of the last week swing, could see some profit-taking if bulls break the current resistance near $0.07978. Above, old consolidations near $0.08425 and $0.08872 may also provide some resistance before another round of price discovery.

Learn How to Trade Live!

Join Dave and The Crypto Den Crew and they’ll show you live on a webinar how to take your crypto trading to the next level.

Where to Buy or Trade Altcoins?

These coins have high liquidity on Binance Exchange, so that could help with trading on AUD/USDT/BTC pairs. And if you’re looking at buying and HODLing cryptos, then Swyftx Exchange is an easy-to-use popular choice in Australia.