Let’s take a closer look at today’s altcoins showing breakout signals. We’ll explain what the coin is, then dive into the trading charts and provide some analysis to help you decide.
1. Litecoin (LTC)
Litecoin LTC is a cryptocurrency designed to provide fast, secure and low-cost payments by leveraging the unique properties of blockchain technology. The cryptocurrency was created based on the Bitcoin protocol but it differs in terms of the hashing algorithm used, hard cap, block transaction times, and a few other factors. Litecoin has a block time of just 2.5 minutes and extremely low transaction fees, making it suitable for micro-transactions and point-of-sale payments.
LTC Price Analysis
At the time of writing, LTC is ranked the 22nd cryptocurrency globally and the current price is US$62.03. Let’s take a look at the chart below for price analysis:
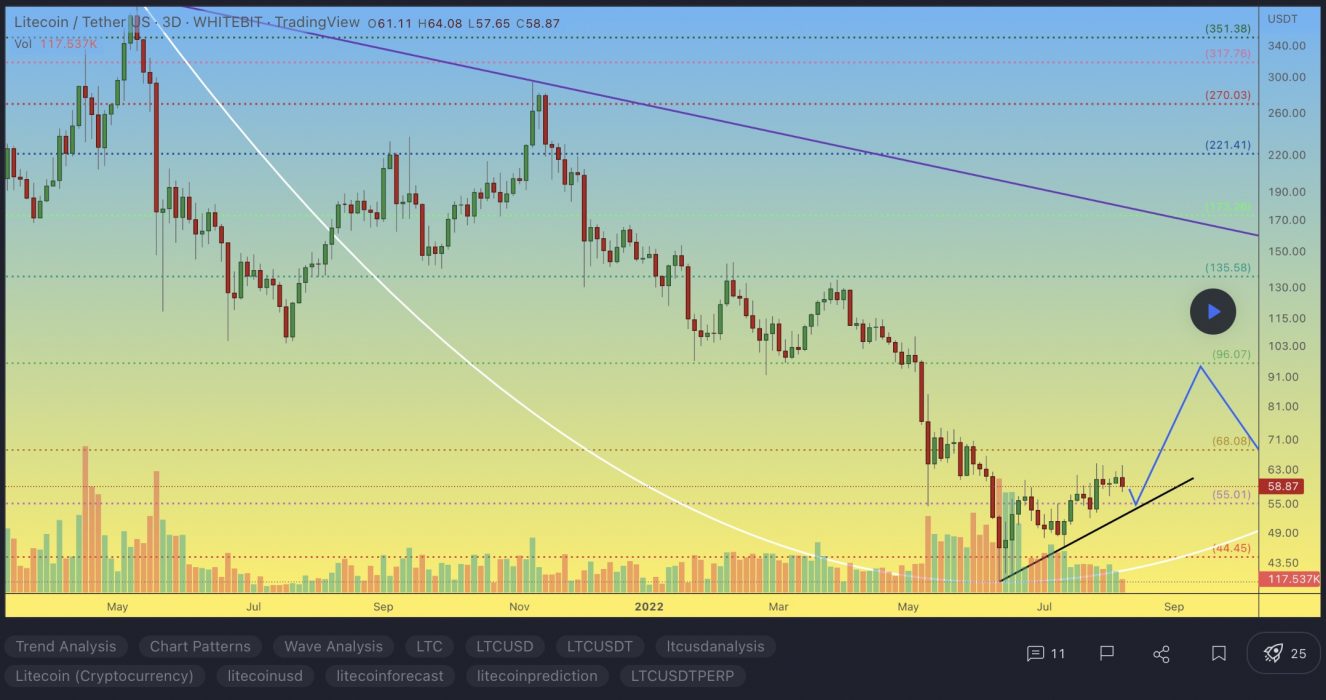
After setting a low last month, LTC kicked off a with recovery trend to break the weekly highs. The following 70% plummet found support near $44.36, sweeping under the 40 EMA into the 65.8% retracement level before bouncing to resistance beginning at $65.73.
This area could continue to provide resistance, possibly causing a retracement to the 9 EMA and 18 EMA near $69.12, where aggressive bulls might begin bidding. The level near $76.18, which has confluence with the 40 EMA, may see more interest from bulls loading up for an attempt on probable resistance beginning near $82.13.
However, if Bitcoin continues its sideways trend, much lower prices could be seen. The old support near $56.18 could provide at least a short-term bounce. If this level fails, the old monthly lows near $48.65 may also give support and see the start of a new bullish cycle after retesting these support levels.
2. Fantom (FTM)
Fantom FTM is a directed acyclic graph (DAG) smart contract platform providing decentralised finance (DeFi) services to developers using its own bespoke consensus algorithm. Together with its in-house token FTM, Fantom aims to solve problems associated with smart-contract platforms – specifically transaction speed, which developers say they have reduced to under two seconds.
FTM Price Analysis
At the time of writing, FTM is ranked the 53rd cryptocurrency globally and the current price is US$0.4118. Let’s take a look at the chart below for price analysis:
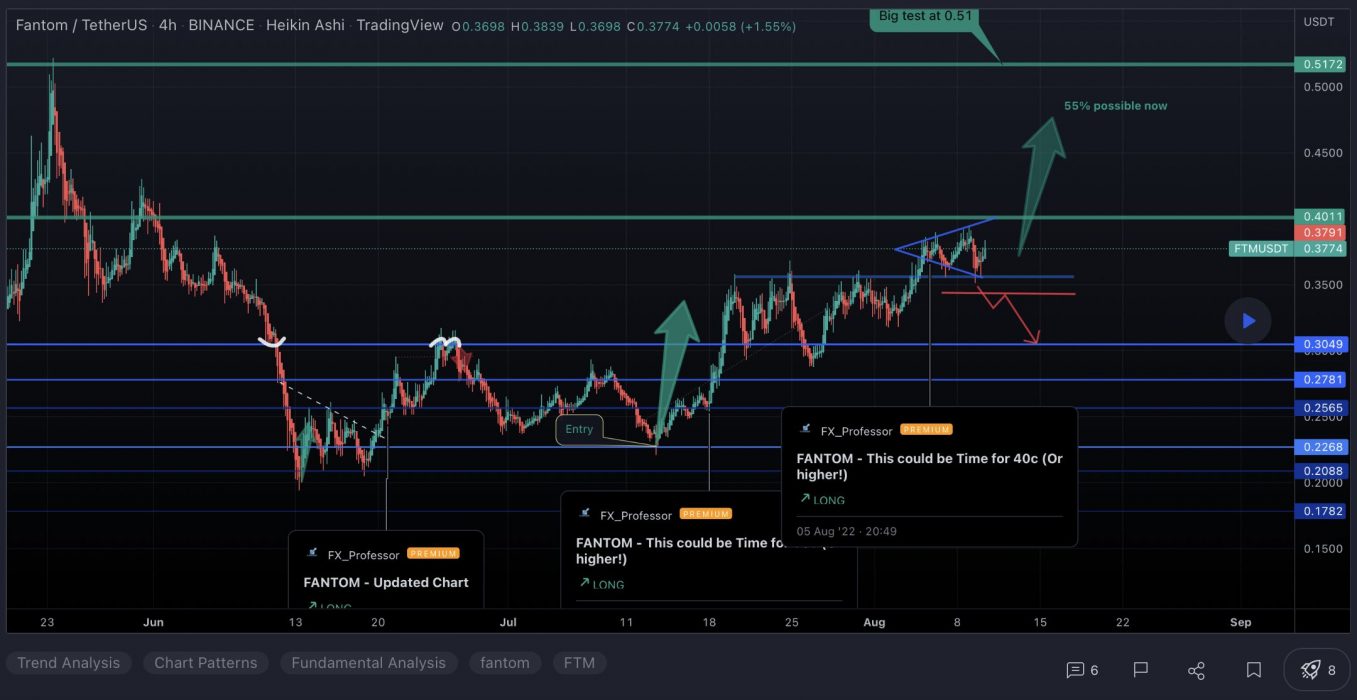
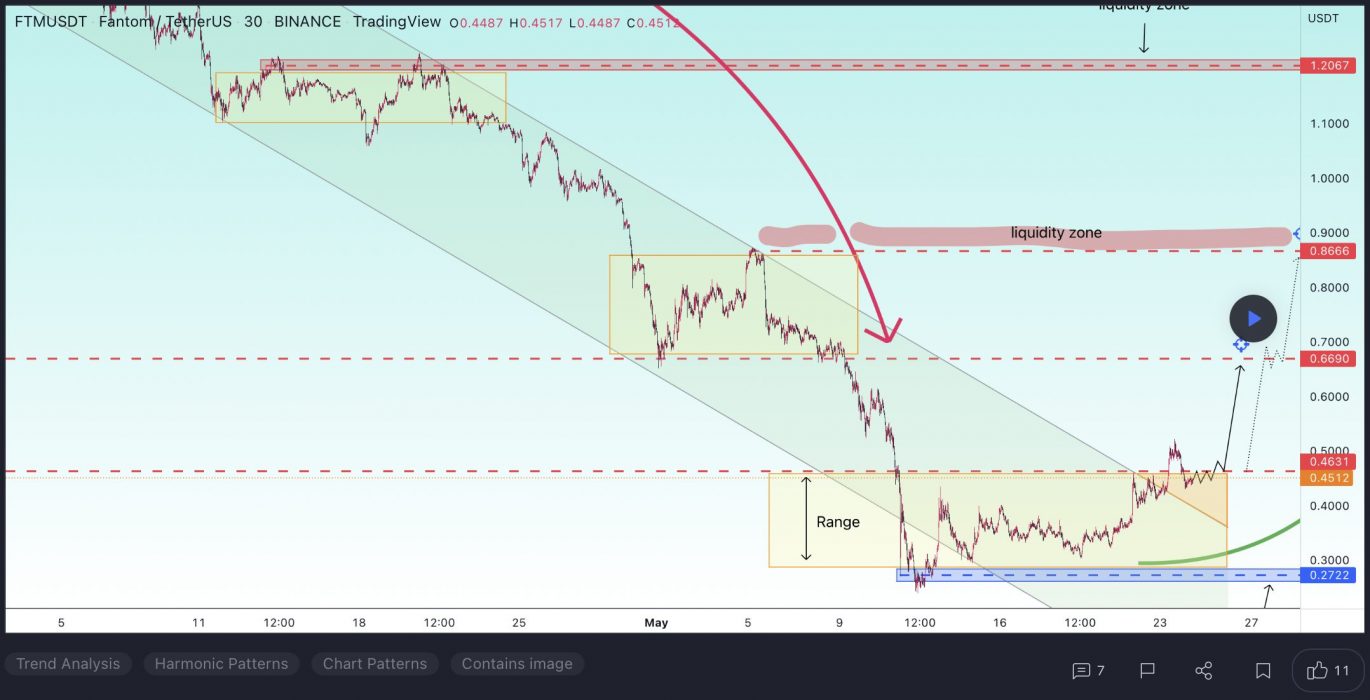
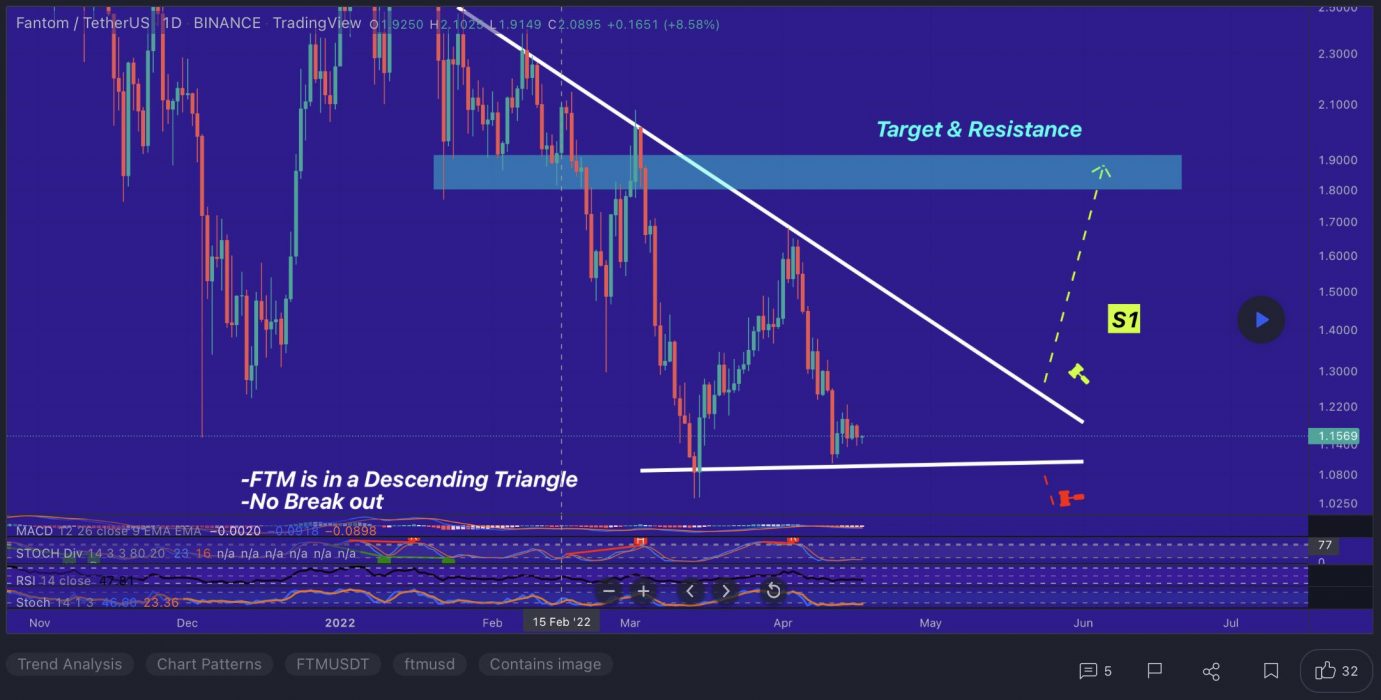
FTM‘s bounce during Q2 ran into resistance near the old monthly highs. This rejection created a set of relatively equal highs near $0.5067, possibly forming the next bullish leg’s target.
Currently, the price is testing possible support near the weekly open, around $0.3865. This level also has confluence with the 80.6% retracement of the current local range and the 18 and 40 EMAs.
If this level fails to provide support, a zone from $0.3574 to $0.3320 might mark a possible swing low or consolidation area. This zone is between the 65.8% and 78.6% retracement of August 2021’s swing.
A more bearish tone in the market could propel the price lower. The lows, near $0.3070, may mark an area of possible support as well as a bearish target.
3. The Sandbox (SAND)
The Sandbox SAND is a blockchain-based virtual world allowing users to create, build, buy and sell digital assets in the form of a game. By combining the powers of decentralised autonomous organisations (DAOs) and non-fungible tokens (NFTs), the Sandbox creates a decentralised platform for a thriving gaming community. The Sandbox employs the powers of blockchain technology by introducing the SAND utility token, which facilitates transactions on the platform.
SAND Price Analysis
At the time of writing, SAND is ranked the 37th cryptocurrency globally and the current price is US$1.34. Let’s take a look at the chart below for price analysis:

SAND‘s impressive gains during Q1 halted at $3.00 before retracing 85% of the move. This price action created several areas of possible higher-timeframe resistance in the process.
The price found resistance on its last swing upward near $1.40 – an area that could provide resistance again. If this swing high breaks, the price may find resistance near $1.58. If this area does provide resistance, it would suggest the formation of a higher-timeframe consolidation.
The fast move up left little higher-timeframe support. However, a vast zone between $1.28 and $1.24 has provided support before and could give support again on a retest. This zone is between the 71.8%-to-88.6% retracement levels of 2021 Q4’s parabolic move.
Continuation downward through this level, especially if the overall market remains bearish, could retrace most of Q2’s move to the next higher-timeframe support near $1.10.
Learn How to Trade Live!
Join Dave and The Crypto Den Crew and they’ll show you live on a webinar how to take your crypto trading to the next level.

Where to Buy or Trade Altcoins?
These coins have high liquidity on Binance Exchange, so that could help with trading on AUD/USDT/BTC pairs. And if you’re looking at buying and HODLing cryptos, then Swyftx Exchange is an easy-to-use popular choice in Australia.


