Categories
Market Analysis The Crypto Den Trading

TradeRoom: Our Weekly Crypto Trades Analysis – Mar 8, 2022

Welcome to this weekly series from the TradeRoom. My name is Dave and I’m the founder of The Crypto Den, an Australian-based crypto trading and education community aiming to give you the knowledge to take your trading game to the next level.

Crypto Market Outlook

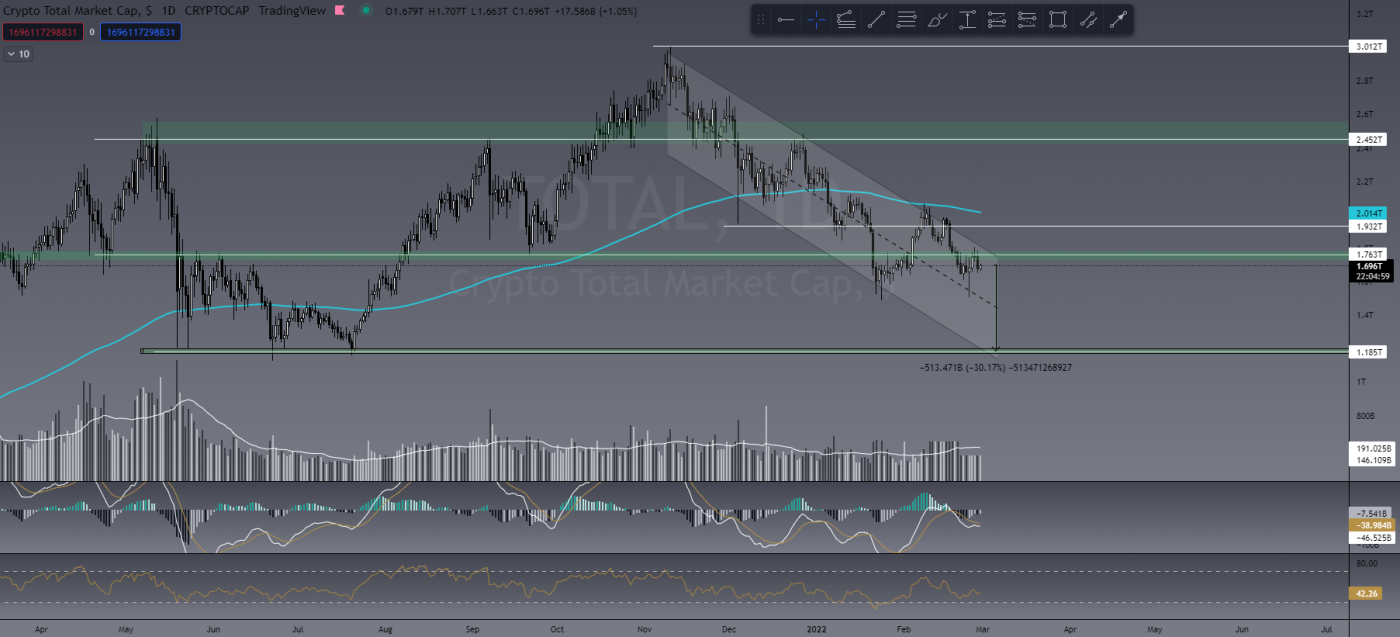
The TOTAL cryptocurrency marketcap has been ranging between US$1.9 trillion and US$1.6 trillion for over a month now and still producing lower market structure. As I’ve been saying for a while, I still expect to see further downside in the crypto markets. Once the US$1.58 trillion support level is broken, I see the market losing over US$400 billion.
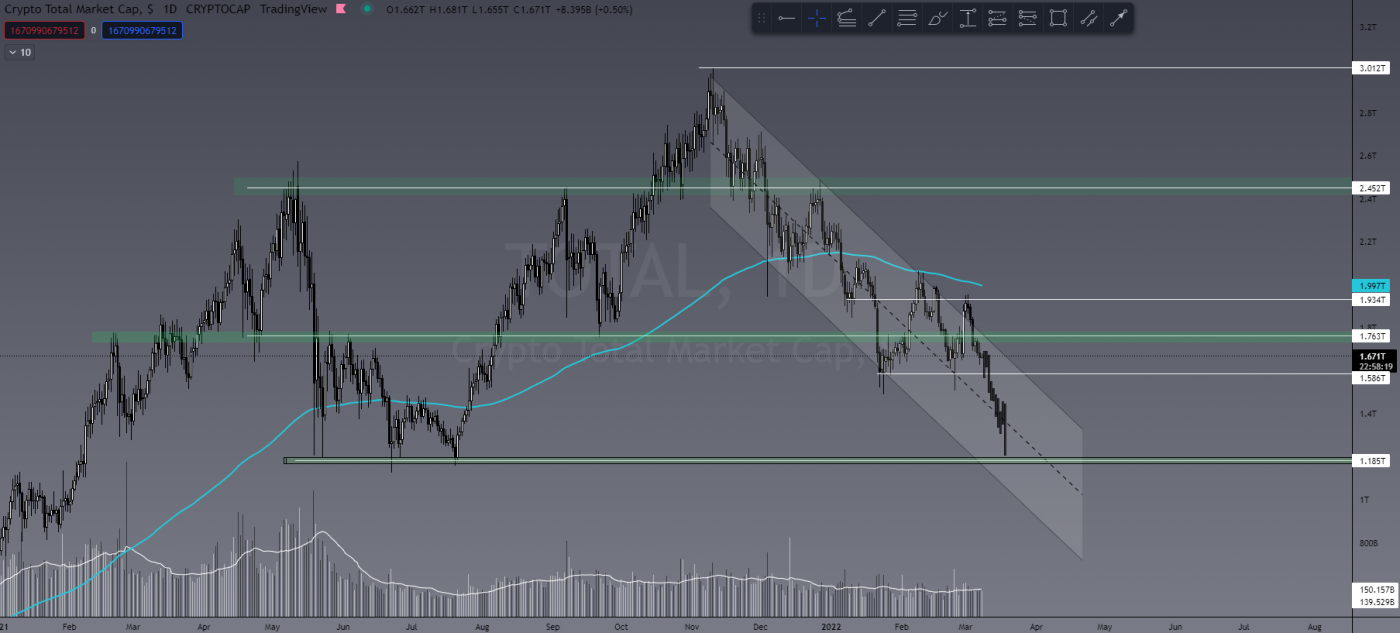
TOTAL Marketcap

BTC.D (bitcoin market dominance in %) is sitting at 43.3% and looks to be turning. If this happens with ALT coins still dropping, it tells me money flow is going into USD/USDT etc as profit-taking is occurring. That, coupled with the DXY (US Dollar Currency Index) pumping, gives me confidence in this scenario.
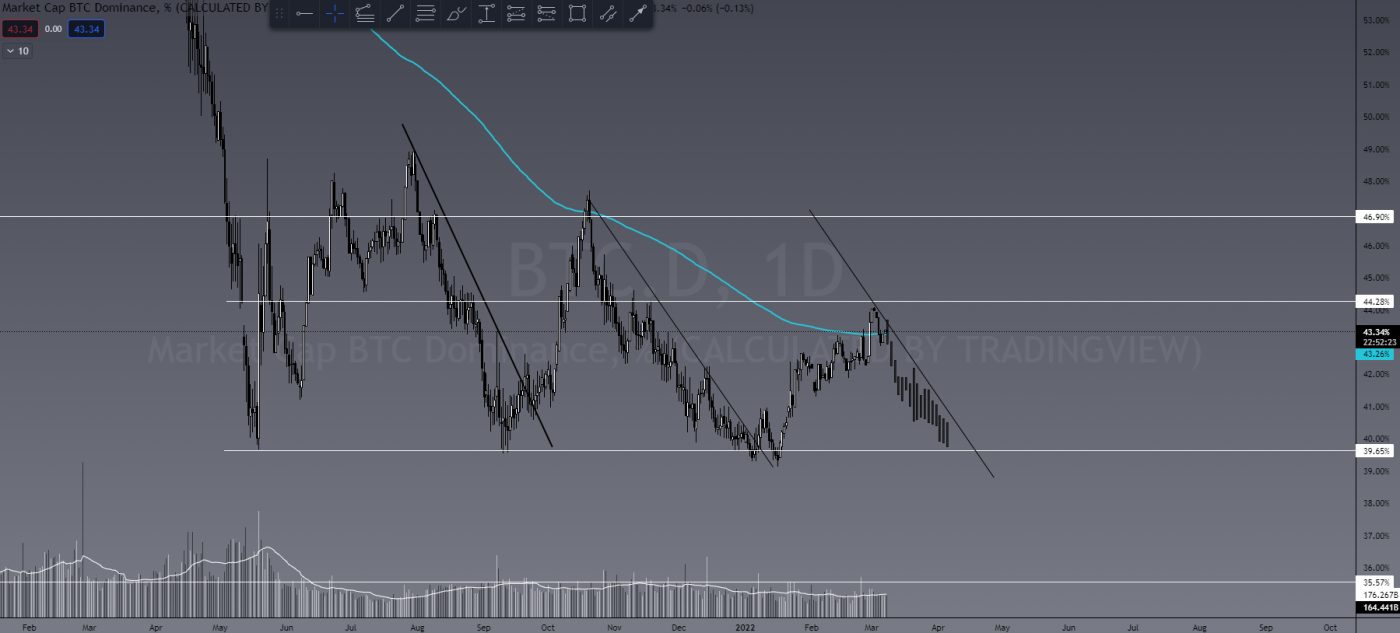
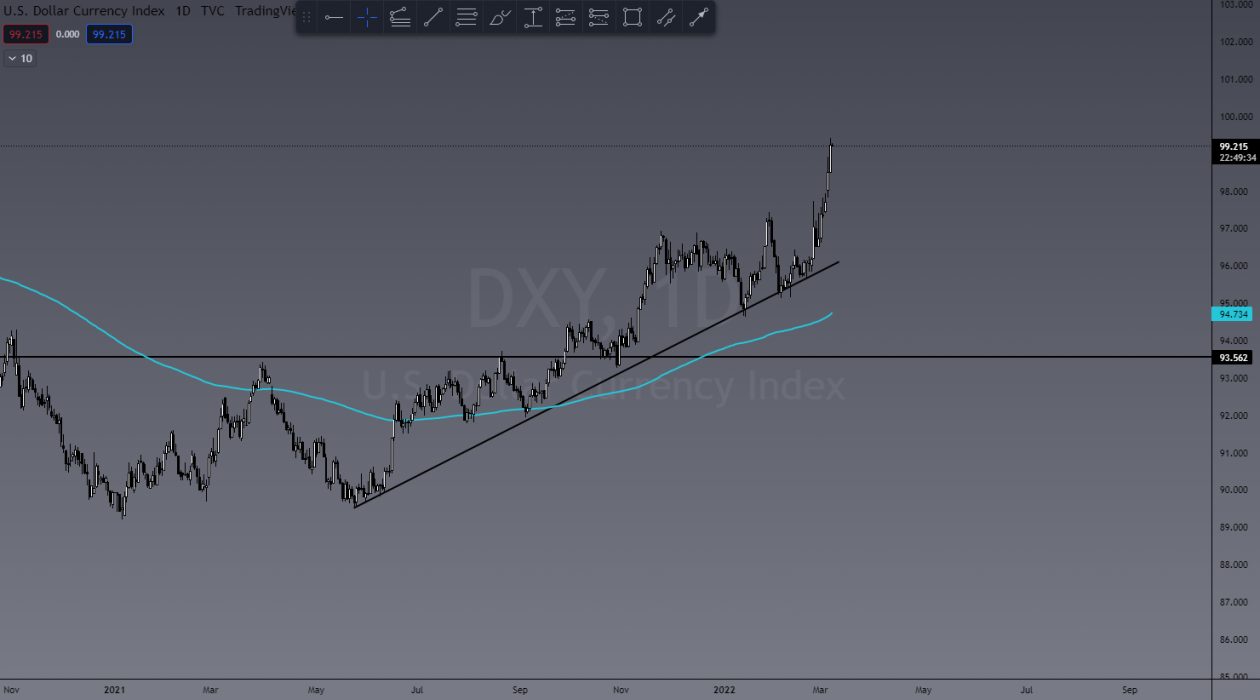
BTC.D
DXY

As for BTC itself, nothing has changed for me. Despite seeing a little pump in price action from US$38,000 to US$45,000 last week, there really wasn’t huge volume behind it to give me buyer confidence. My point still stands, in that breaking the daily 200 EMA is when I can start getting comfortable into a bullish bias. I know some say I go against the grain a little with a bearish outlook, but I’m trying to prepare people for that scenario. The last thing I want to see is another 2018 situation where people lose 90% of their capital due to “hopium” and bullish influencers. I still like the US$29,000 target.
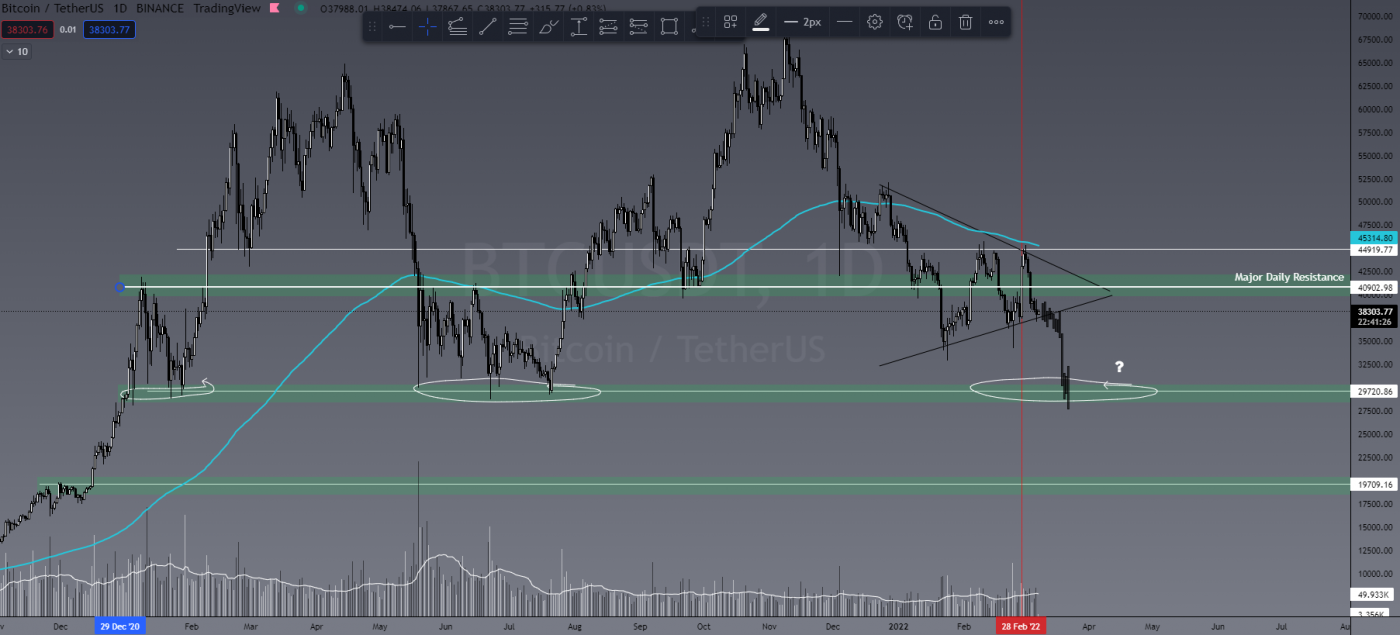
BTC/USDT

Last Week’s Performance

WAVES/USDT

I think it’s important to share both winning and losing trades. Last week I shared a potential trade on WAVES and this one was definitely a losing trade! I entered my short at key resistance and was stopped out for a 2% loss. This is why we use stop losses! Not every trade we enter will be a winner, and it’s important to mitigate that risk with correct risk management strategies.
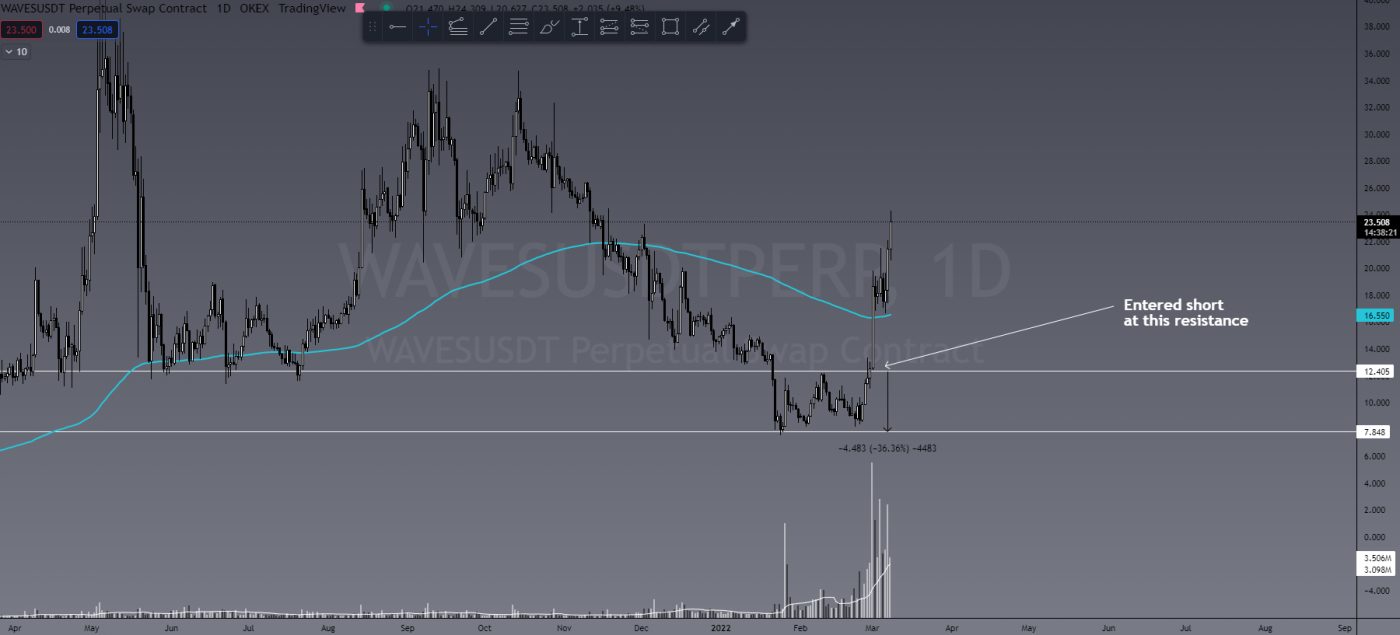
WAVES/USDT

ETH/USDT

One of the most consistently profitable traders I know, and a leader within The Crypto Den community TradeRoom, Cassie, who shared this beautiful 20% (200% on 10x) ETH short trade. Cass is also highly active in our TCD Facebook group for those who would like to follow her trades.

ETH/USDT BEFORE
ETH/USDT AFTER

This Week’s Trades

SOL/USDT

I’m going to have to go with SOL again as my pick of the week (should it play out) for a potential short here. If BTC does see further downside with profits moving into USD instead of ALTs, I see SOL as one of the biggest losers – a potential 70% drop from its current price. It may see some sideways support at US$53.00, though my target is US$21.00.
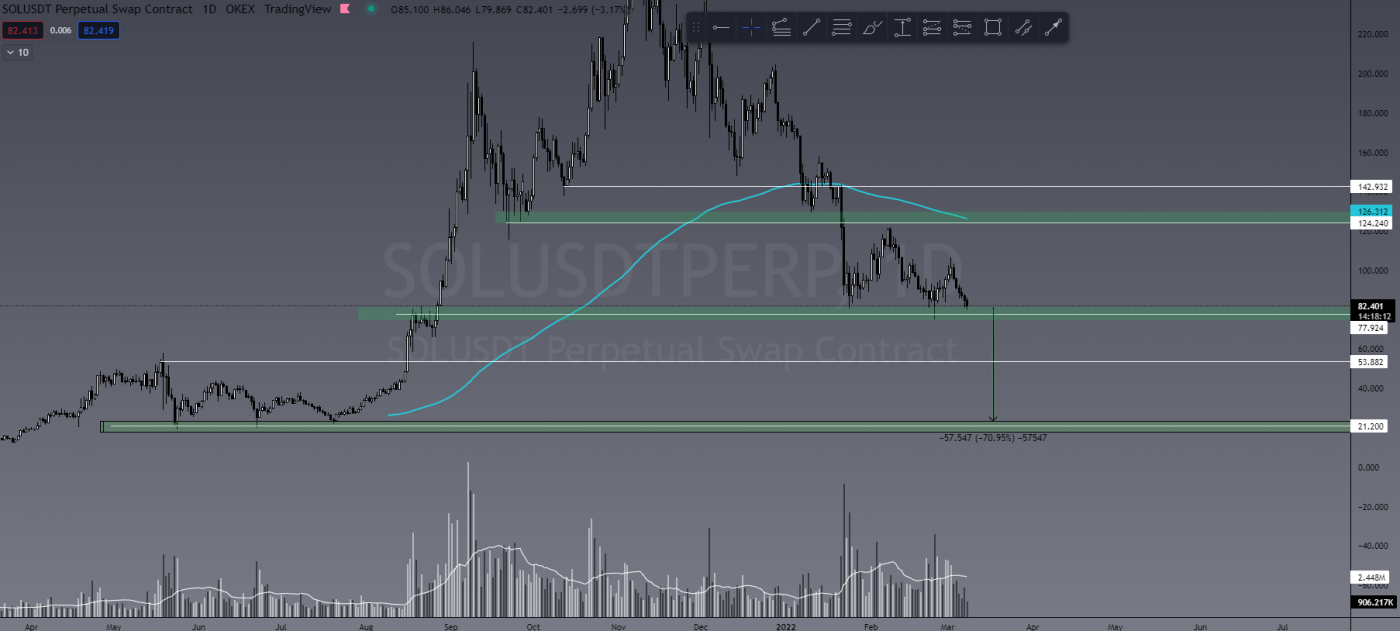
SOL/USDT


ADA/USDT

Yes, I know you’re probably sick of seeing me write this but again, for the same reasons as above with SOL, I still see ADA dropping a good 70%. Hardcore ADA fans give me hell over this but I see absolutely nothing bullish in the charts for ADA!
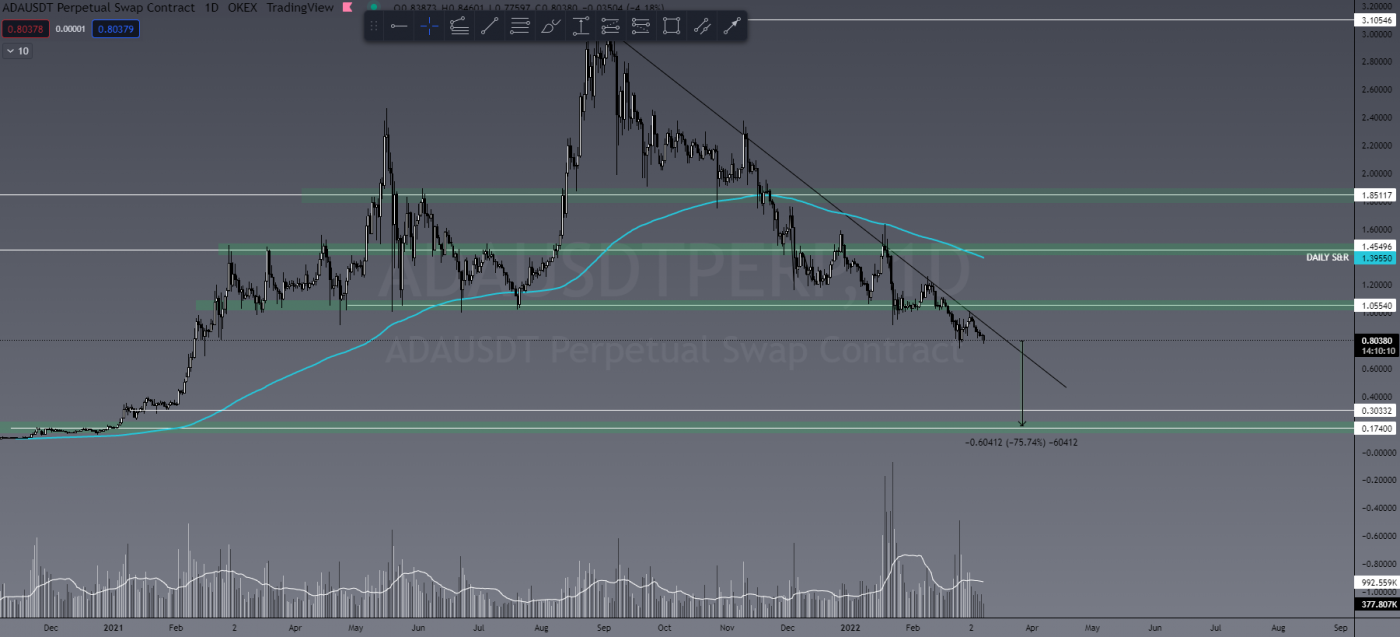
ADA/USDT

Introducing TCD’s New Social Platform

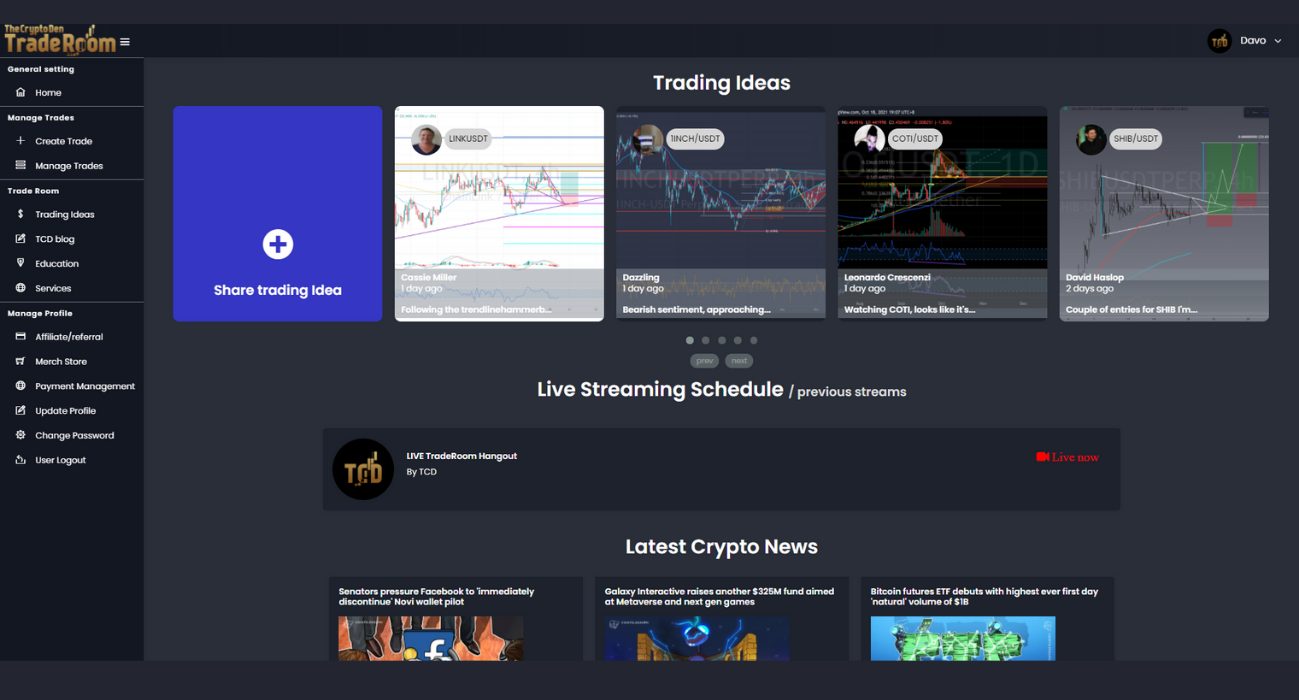
The Crypto Den now has a FREE purpose-built social platform to share investment ideas, trading chat, connect to like-minded people, share info and more, without the censorship of Facebook. The platform is designed for those more focused on the investment/profitable side of the Crypto world.


Are You a Trader?

Invite to Join our TradeRoom

If you’d like to become a better trader, you’re invited to join our TradeRoom where we share daily charts and market analysis. In our community we strongly encourage and teach correct risk management strategies to keep our members safe in this new volatile crypto market.
Join our “Apprentice” plan now for your 7-day trial.

The Crypto Den was created in 2017 to help the rapidly growing crypto community learn and understand the fundamentals of digital currencies and how to trade them. 

Since then we have taught thousands of members the basics of technical analysis and trading strategies to further progress and perfect their trading abilities.

In the TradeRoom you will be included in a supportive environment which encourages personal growth, education and community support.

It’s a place to share your trading ideas and follow other experienced traders’ feeds to help keep your finger on the pulse of such a volatile market!

Categories
Crypto News Kava Market Analysis Terra Trading Verge

Top 3 Coins to Watch Today: KAVA, LUNA, XVG – March 8 Trading Analysis

Let’s take a closer look at today’s altcoins showing breakout signals. We’ll explain what the coin is, then dive into the trading charts and provide some analysis to help you decide.

1. Kava.io (KAVA)

KAVA is a cross-chain DeFi lending platform that allows users to borrow USDX stablecoins and deposit a variety of cryptocurrencies to begin earning a yield. The Kava DeFi hub operates as a decentralised bank for digital assets, allowing users to access a range of decentralised financial services, including its native USD-pegged stablecoin, USDX, as well as synthetics and derivatives. Through Kava, users are able to borrow USDX tokens by depositing collateral, effectively leveraging their exposure to crypto assets.

KAVA Price Analysis

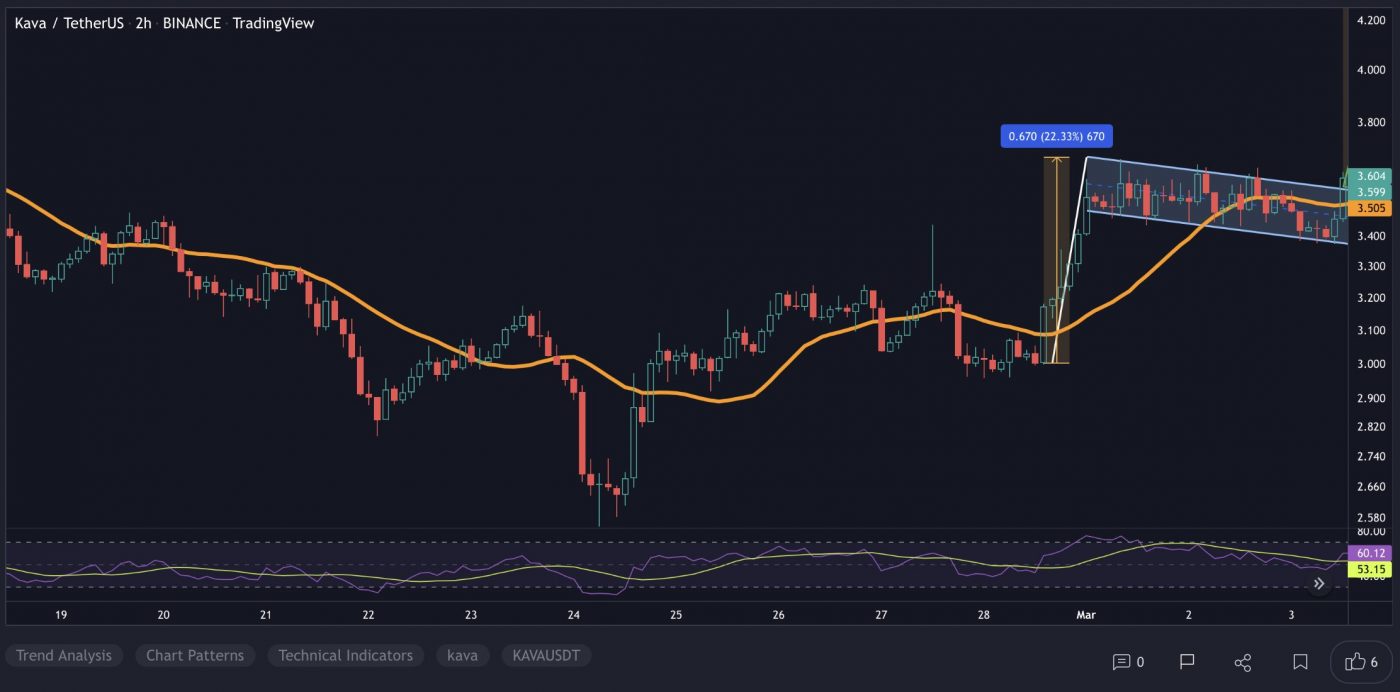
At the time of writing, KAVA is ranked the 118th cryptocurrency globally and the current price is US$3.14. Let’s take a look at the chart below for price analysis:

Source: TradingView

The last year saw KAVA travel through a massive range from approximately $8 to $2.66. Currently, it is trending downward into the range lows.

Resistance might be found just above the current price, beginning near $3.148. This area has confluence with the 9 and 18 EMAs. 

A stronger retracement against the bearish trend could reach the 40 EMA and the March monthly open, near $3.407.

Although unlikely in the current bearish market conditions, a more significant rally might reach over the 2022 yearly open to test an inefficiently traded area from $4.198 to $4.486.

In late February, the price bounced from the support between $2.819 to $2.734 while wicking just under a narrow support zone at $2.594. These two levels could provide support again. 

However, the price has been consolidating on higher timeframes since late January. Given the current bearish market conditions, it seems likely that a retest of these two support levels may fail. 

Bears might take profits near $1.827 at Q4 2021’s consolidation, which could offer support. However, if the price reaches this far, it’s reasonable to expect continuation through the swing low at $1.123 into an inefficiently traded area on higher timeframes.

2. Terra (LUNA)

Terra LUNA is a blockchain protocol that uses fiat-pegged stablecoins to power price-stable global payments systems. According to its whitepaper, Terra combines the price stability and wide adoption of fiat currencies with the censorship-resistance of Bitcoin and offers fast and affordable settlements. Terra’s native token, LUNA, is used to stabilise the price of the protocol’s stablecoins. LUNA holders are also able to submit and vote on governance proposals, giving it the functionality of a governance token.

LUNA Price Analysis

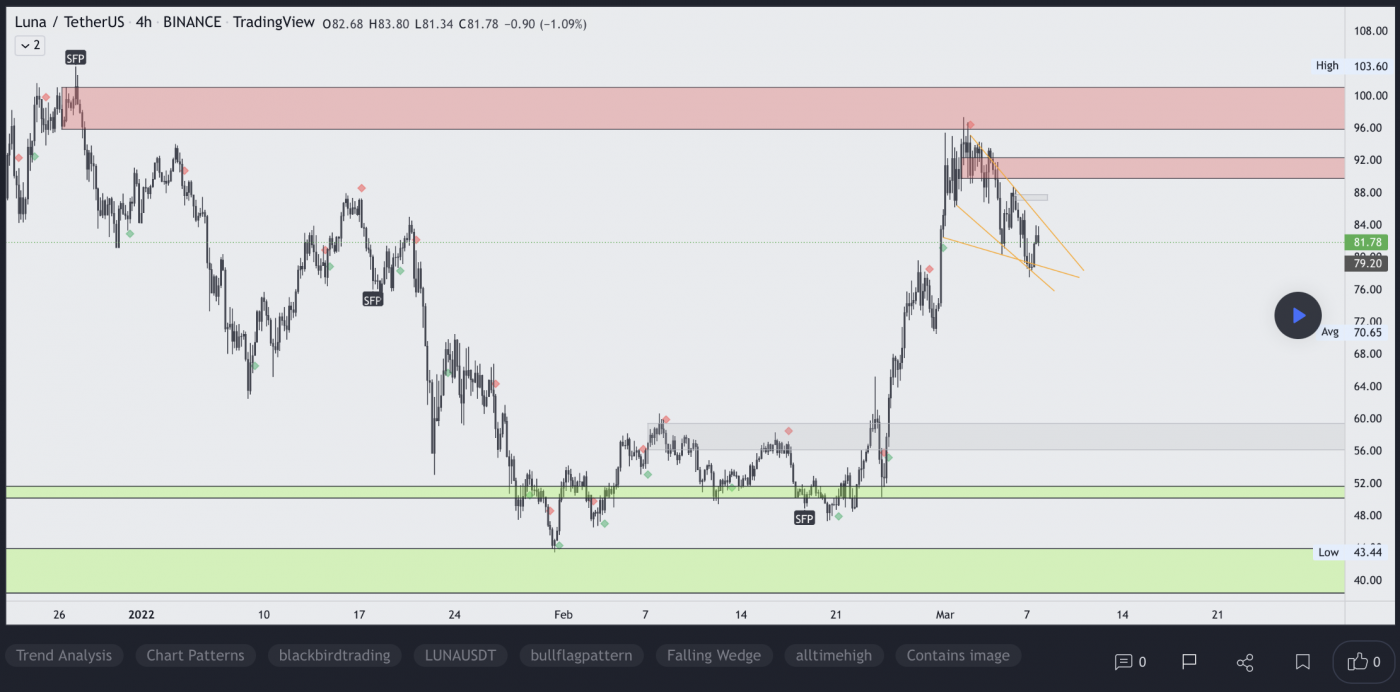
At the time of writing, LUNA is ranked the 7th cryptocurrency globally and the current price is US$81.77. Let’s take a look at the chart below for price analysis:

Source: TradingView

LUNA showed significant strength in the face of a mostly-bearish altcoin market, rallying over 100% in late February after raising funds to help stabilise its peg.

The price is currently retracing from resistance near $98.90, just below the all-time high. Bulls might begin eyeing entries near $79.00, which will soon be near the 18 EMA and between the 61.8% and 78.6% retracement levels of the last leg upward.

A deeper retracement might reach an inefficient zone and the 40 EMA under the last daily swing low, between $70.44 and $66.07. A move below this low suggests a more bearish shift in market structure. If this shift occurs, it could create a short setup to target possible support at the upmove’s accumulation zone, near $59.41.

While the price is retracing, $83.44 offers the closest probable resistance at the 2022 yearly open. Just above, near the March monthly open, the consolidation lows near $89.69 are also a reasonable candidate for resistance.

If the price breaks through these resistances, the significant resistance at $89.69 might also break and allow LUNA to set new all-time highs. However, bulls should keep in mind that the overall market is bearish, decreasing the chances of a massive bullish breakout. If the price does break the all-time high and enter discovery, overlapping extensions near $130 offer a possible significant target.

3. Verge (XVG)

Verge XVG is a privacy-focused cryptocurrency and blockchain that seeks to offer a fast, efficient, decentralised payments network that improves on the original Bitcoin blockchain. It includes additional privacy features including integrating the anonymity network Tor into its wallet, called Verge Pay, and providing the option of sending transactions to stealth addresses. The project describes itself as community-driven, relying on volunteers and priding itself on being open-source.

XVG Price Analysis

At the time of writing, XVG is ranked the 278th cryptocurrency globally and the current price is US$0.009039. Let’s take a look at the chart below for price analysis:

Source: TradingView

XVG has retraced nearly 80% from its November 2021 highs and appears poised to continue its downtrend.

If Monday’s trading fails to reach $0.009471, resistance might begin just above the current price at $0.009235. 

Just above this level rests higher-timeframe resistance from $0.009599 to $0.011032. Inside this broad zone, $0.009709 (an inefficiently traded area) and $0.010175 (the March monthly open) might offer the most sensitivity.

A more significant rally would likely find resistance between $0.013500 and $0.015655, where the monthly chart shows inefficient trading. However, the current bear market decreases the probability of a rally reaching this far.

The quarterly chart shows a broad zone of possible support near $0.006907. Inside this zone, $0.005756 – near the 100% extension of the last retracement upward – offers a higher probability for a bounce or bottom. This level is near the midpoint of November 2020’s massive rally. 

However, the swing low at $0.003552 and an inefficiently traded area below inside late 2019’s consolidation offers an attractive target for bears. Bulls should be cautious with entries until the trend flips bullish.

Learn How to Trade Live!

Join Dave and The Crypto Den Crew and they’ll show you live on a webinar how to take your crypto trading to the next level.

Where to Buy or Trade Altcoins?

These coins have high liquidity on Binance Exchange, so that could help with trading on AUD/USDT/BTC pairs. And if you’re looking at buying and HODLing cryptos, then Swyftx Exchange is an easy-to-use popular choice in Australia.

Categories
Binance Coin Chiliz Crypto News Market Analysis Ripple Trading

Top 3 Coins to Watch Today: BNB, XRP, CHZ – March 7 Trading Analysis

Let’s take a closer look at today’s altcoins showing breakout signals. We’ll explain what the coin is, then dive into the trading charts and provide some analysis to help you decide.

1. Binance Coin (BNB)

Binance BNB is the biggest cryptocurrency exchange globally, based on daily trading volume. Binance aims to bring cryptocurrency exchanges to the forefront of world financial activity. Aside from being the largest cryptocurrency exchange, Binance has launched a whole ecosystem of functionalities for its users. The Binance network includes the Binance Chain, Binance Smart Chain, Binance Academy, Trust Wallet and Research projects, which all employ the powers of blockchain technology to bring new-age finance to the world. Binance Coin is an integral part of the successful functioning of many of the Binance sub-projects.

BNB Price Analysis

At the time of writing, BNB is ranked the 4th cryptocurrency globally and the current price is US$383.55. Let’s take a look at the chart below for price analysis:

Source: TradingView

After a 25% decline during February, BNB has ranged between $360 and $410. The recent price recovery was approaching probable resistance near $408 but could be aiming for stops above the relatively equal highs near $420. Continuation of the trend could target the daily gap near $435.

Aggressive bulls might add to positions near $395 and $387. Price action near $375 may be more likely to provide support – if it gets there – during any retracements.

Relatively equal lows clustered around $369 seem likely to be swept if the bearish trend resumes. If this move occurs, the price might find support at the significant higher-timeframe level near $360.

2. Ripple (XRP)

Ripple XRP is the currency that runs on a digital payment platform called RippleNet, on top of a distributed ledger database called XRP Ledger. While RippleNet is run by a company called Ripple, the XRP Ledger is open-source and not based on a blockchain, but rather the previously mentioned distributed ledger database.

XRP Price Analysis

At the time of writing, XRP is ranked the 6th cryptocurrency globally and the current price is US$0.7402. Let’s take a look at the chart below for price analysis:

Source: TradingView

XRP printed some gains during last week before moving sideways for the rest of the month.

The price was in a downtrend, with the 9, 18 and 40 EMAs providing resistance on each attempt to rally. However, bulls are showing some interest at the 71.6% retracement, near $0.7472. If this level breaks, a move into possible support – just below the lows near $0.6952 – seems likely.

If the price does rally through the swing high at $0.8055 – perhaps triggered by a sudden surge in Bitcoin – bulls might find some resistance at the 61.8% retracement level near $0.8450. 

Overlapping swing highs and lows near $0.8946 might provide the next target, where bears immediately forced the price down in late December.

More bullish market conditions could shift targets up near the midpoint of Q3’s consolidation, near $0.9517, where higher timeframes show an inefficiently traded zone.

3. Chiliz (CHZ)

Chiliz CHZ is the leading digital currency for sports and entertainment, powering the world’s first blockchain-based fan engagement and rewards platform, Socios.com. Here, fans can purchase and trade branded fan tokens as well as having the ability to participate, influence, and vote in club-focused surveys and polls. Founded in Malta in 2018, the company’s vision is to bridge the gap between active and passive fans, providing millions of sports fanatics with a fan token that acts as a tokenised share of influence.

CHZ Price Analysis

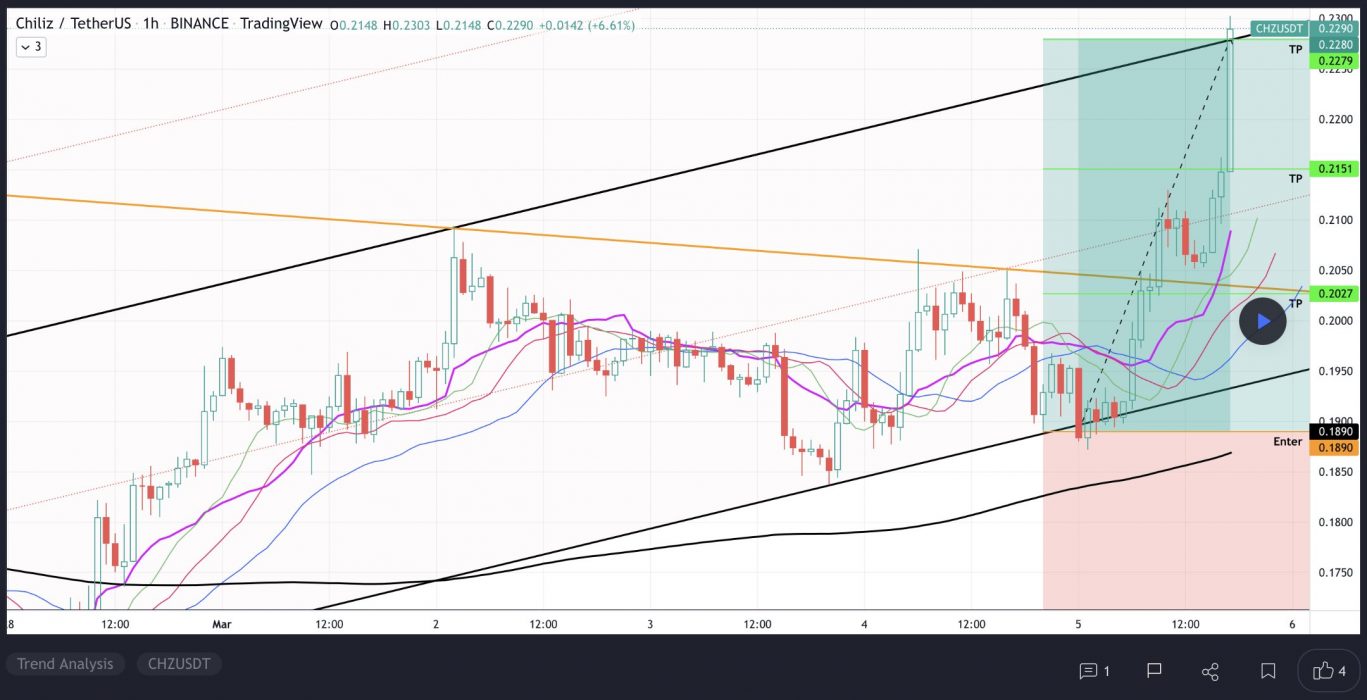
At the time of writing, CHZ is ranked the 68th cryptocurrency globally and the current price is US$0.1766. Let’s take a look at the chart below for price analysis:

Source: TradingView

CHZ‘s stunning rally to $0.3150 plummeted over 70% during January to sweep consolidation lows at $0.1655. This could set the stage for a new bullish cycle to begin. 

The price is currently balancing around the monthly open. A quick stop run into support beginning near $0.1732 could set the stage for a move into the daily gap beginning near $0.1685, potentially reaching resistance near $0.1934.

A sweep of the highs near $0.2132, followed by a sharp sell-off, could hint that bulls are preparing to run the swing high near $0.2247. This run could find the next resistance around $0.2436 in the candle wick that created the monthly high. If the market remains bullish, the price will likely reach into possible resistance near $0.2618.

Learn How to Trade Live!

Join Dave and The Crypto Den Crew and they’ll show you live on a webinar how to take your crypto trading to the next level.

Where to Buy or Trade Altcoins?

These coins have high liquidity on Binance Exchange, so that could help with trading on AUD/USDT/BTC pairs. And if you’re looking at buying and HODLing cryptos, then Swyftx Exchange is an easy-to-use popular choice in Australia.

Categories
Algorand Avalanche Axie Infinity Crypto News Market Analysis Trading

Top 3 Coins to Watch Today: AVAX, ALGO, AXS – March 4 Trading Analysis

Let’s take a closer look at today’s altcoins showing breakout signals. We’ll explain what the coin is, then dive into the trading charts and provide some analysis to help you decide.

1. Avalanche (AVAX)

Avalanche AVAX is the fastest smart contracts platform in the blockchain industry, as measured by time-to-finality, and has the most validators securing its activity of any proof-of-stake protocol. Avalanche is blazingly fast, low-cost, and green. Any smart contract-enabled application can outperform its competition on Avalanche. AVAX is the native token of Avalanche. It is a hard-capped, scarce asset that is used to pay for fees, secure the platform through staking, and provide a basic unit of account between the multiple subnets created on Avalanche.

AVAX Price Analysis

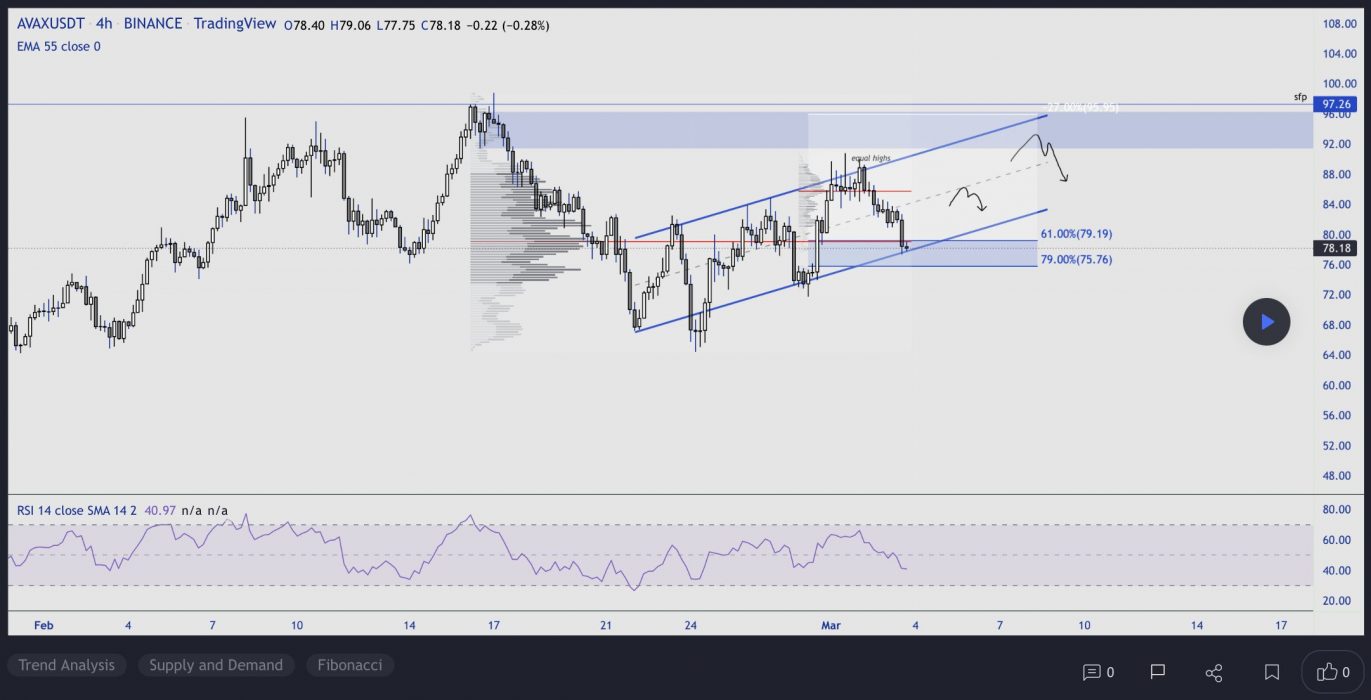
At the time of writing, AVAX is ranked the 10th cryptocurrency globally and the current price is US$77.80. Let’s take a look at the chart below for price analysis:

Source: TradingView

AVAX‘s 70% rally in January ended with an almost 35% retracement as the rest of the altcoin market dropped. Bulls stepped in near the 61.8% retracement of Q4’s move, creating a consolidation that ended with last week’s bullish impulse to resistance near $86.35.

With the 9, 18, and 40 EMAs stacked bullish and a bullish higher-timeframe trend, it’s reasonable to anticipate retracement to possible support before further bullish expansion. 

Near the 40 EMA, a broad zone from $68.12 to $65.35 could see interest from bulls before further expansion. If this level fails, bears might capitalise on any sharp moves down in Bitcoin, aiming for possible support near the 80% retracement, at $61.54, and potentially lower to a higher-timeframe support zone between $57.82 and $54.77.

If the higher-timeframe bullish trend resumes and the current resistance near $93.35 breaks, the wicks near $105.84 and the new monthly highs might see profit-taking.

2. Algorand (ALGO)

The Algorand ALGO blockchain is a permissionless, pure proof-of-stake blockchain protocol. Unlike proof-of-work (PoW) blockchains, where the root block must be validated by randomly selected validators (using computing power), in the pure proof-of-stake approach all of the validators are known to one another and only have to agree on the next block in order to create a new block. Algorand was invented to speed up transactions and improve efficiency in response to the slow transaction times of Bitcoin and other blockchains.

ALGO Price Analysis

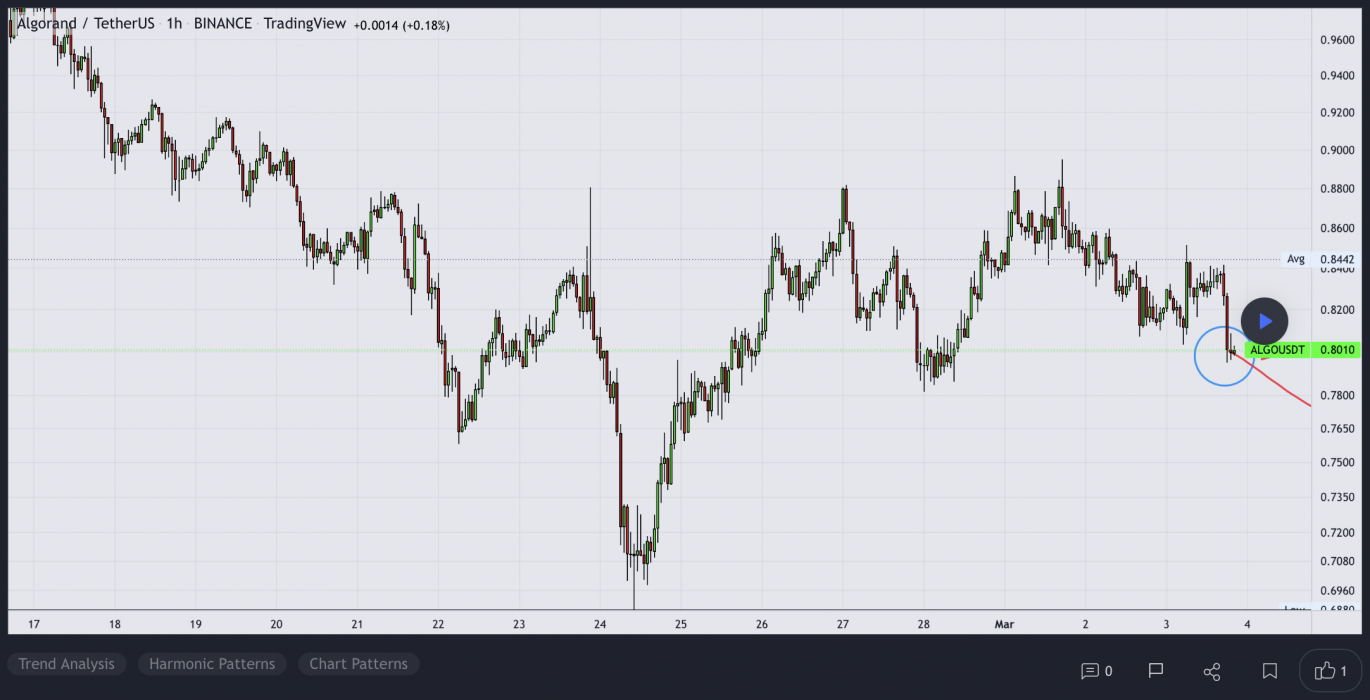
At the time of writing, ALGO is ranked the 29th cryptocurrency globally and the current price is US$0.7967. Let’s take a look at the chart below for price analysis:

Source: TradingView

After creating a second equal low during February, ALGO gained nearly 22% into resistance that starts near $0.9122.

Swing traders looking for a continuation to the nearest cluster of relatively equal highs around $1.10 might look for bids near $1.05. More significant resistance rests above, near $1.15. A group of significant swing highs at $1.21 and $1.25 give possible targets if this resistance breaks.

A stop run on the recent low at $0.7460 into possible support beginning near $0.6830 might see stronger bidding. This area also has a confluence with the recent monthly lows.

3. Axie Infinity (AXS)

Axie Infinity AXS is a blockchain-based trading and battling game that is partially owned and operated by its players. The Axie Infinity ecosystem has its own unique governance token, known as Axie Infinity Shards AXS. These are used to participate in key governance votes and will give holders a say in how funds in the Axie Community Treasury are spent.

AXS Price Analysis

At the time of writing, AXS is ranked the 40th cryptocurrency globally and the current price is US$52.62. Let’s take a look at the chart below for price analysis:

Source: TradingView

AXS‘s relatively small 25% range could suggest that a larger move is setting up in February.

Aggressive bulls could look for entries at the most recent area of support formed near $49.22. However, equal lows near $45.12 make a tempting target for a stop run into this support. This move could reach support near $42.67. 

A decisive move to the downside could run stops below the second set of relatively equal lows near $40.23, possibly reaching support at an old swing high and a daily gap near $38.58.

A recent level near $58.84 provided resistance and caused a recent swing high to form near $63.88, offering first targets. A move through this high may arrive at new monthly high levels near $68.31 and $75.30.

Learn How to Trade Live!

Join Dave and The Crypto Den Crew and they’ll show you live on a webinar how to take your crypto trading to the next level.

Where to Buy or Trade Altcoins?

These coins have high liquidity on Binance Exchange, so that could help with trading on AUD/USDT/BTC pairs. And if you’re looking at buying and HODLing cryptos, then Swyftx Exchange is an easy-to-use popular choice in Australia.

Categories
Crypto News Decentraland Market Analysis OMG Network Trading Waves

Top 3 Coins to Watch Today: OMG, MANA, WAVES – March 3 Trading Analysis

Let’s take a closer look at today’s altcoins showing breakout signals. We’ll explain what the coin is, then dive into the trading charts and provide some analysis to help you decide.

1. Omg Network (OMG)

Omg Network OMG, formerly known as OmiseGo, is a non-custodial, layer-2 scaling solution built for the Ethereum blockchain. As an Ethereum scaling solution, OMG Network is designed to allow users to transfer ETH and ERC20 tokens significantly faster and more cheaply than when transacting directly on the Ethereum network. The network is powered by the OMG utility token, which can be used as one of the payment methods for fees on the OMG Network, and will eventually be stackable – helping to secure the network in return for rewards.

OMG Price Analysis

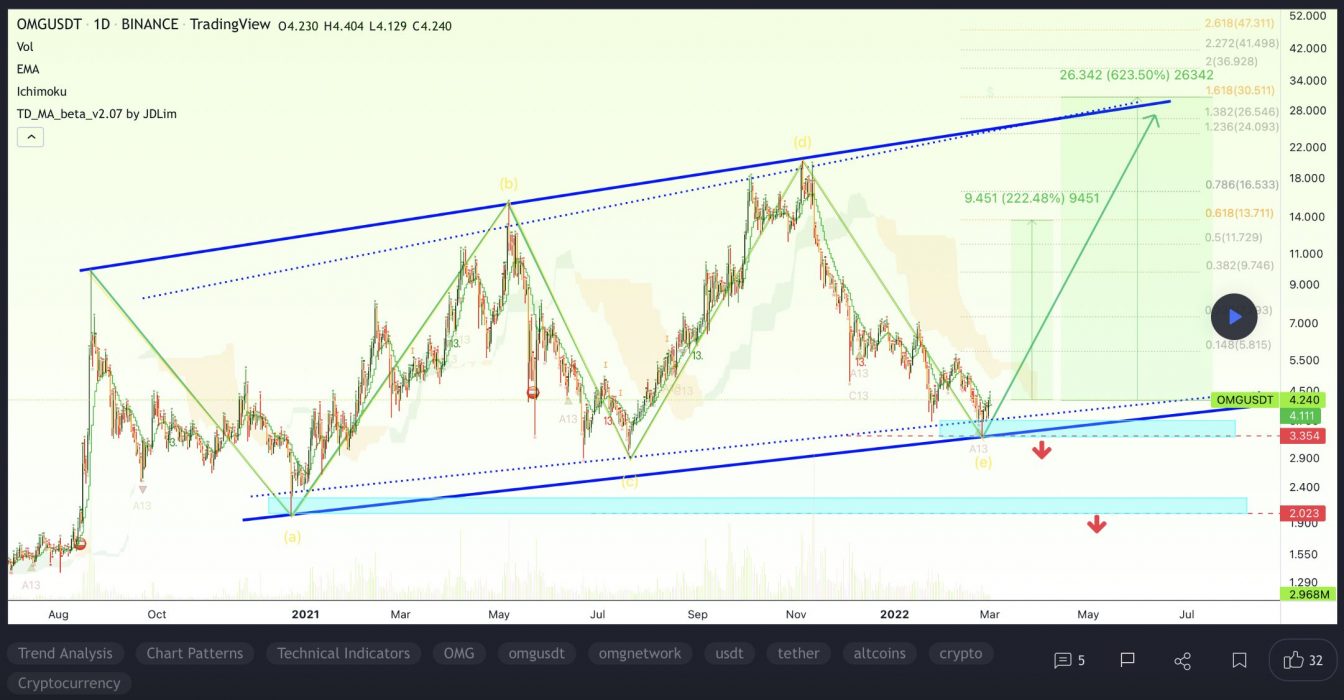
At the time of writing, OMG is ranked the 104th cryptocurrency globally and the current price is US$4.51. Let’s take a look at the chart below for price analysis:

Source: TradingView

OMG‘s 45% drop has filled the February monthly gap twice as the price consolidated between $3.88 and $4.70.

The price’s current region, between $4.41 and $4.27 and just under the monthly open, could continue to give support. If this area continues to hold, the cluster of relatively equal range highs up to $5.12 is a likely target. 

An animated move through these highs could reach up to the daily gap beginning at $5.31. The area between $5.73 and $6.19 provides a likely cap for a move into this zone.

A drop lower could be a run-on stop under $4.10 and find support near $3.94. If this level is lost, the swing low at $3.82 is a likely target, with $3.69 possibly giving support.

2. Decentraland (MANA)

Decentraland MANA defines itself as a virtual reality platform powered by the Ethereum blockchain that allows users to create, experience, and monetise content and applications. In this virtual world, users purchase plots of land that they can later navigate, build on and monetise. Decentraland uses two tokens: MANA and LAND. MANA is an ERC-20 token that must be burned to acquire non-fungible ERC-721 LAND tokens. MANA tokens can also be used to pay for a range of avatars, wearables, names and more on the Decentraland marketplace.

MANA Price Analysis

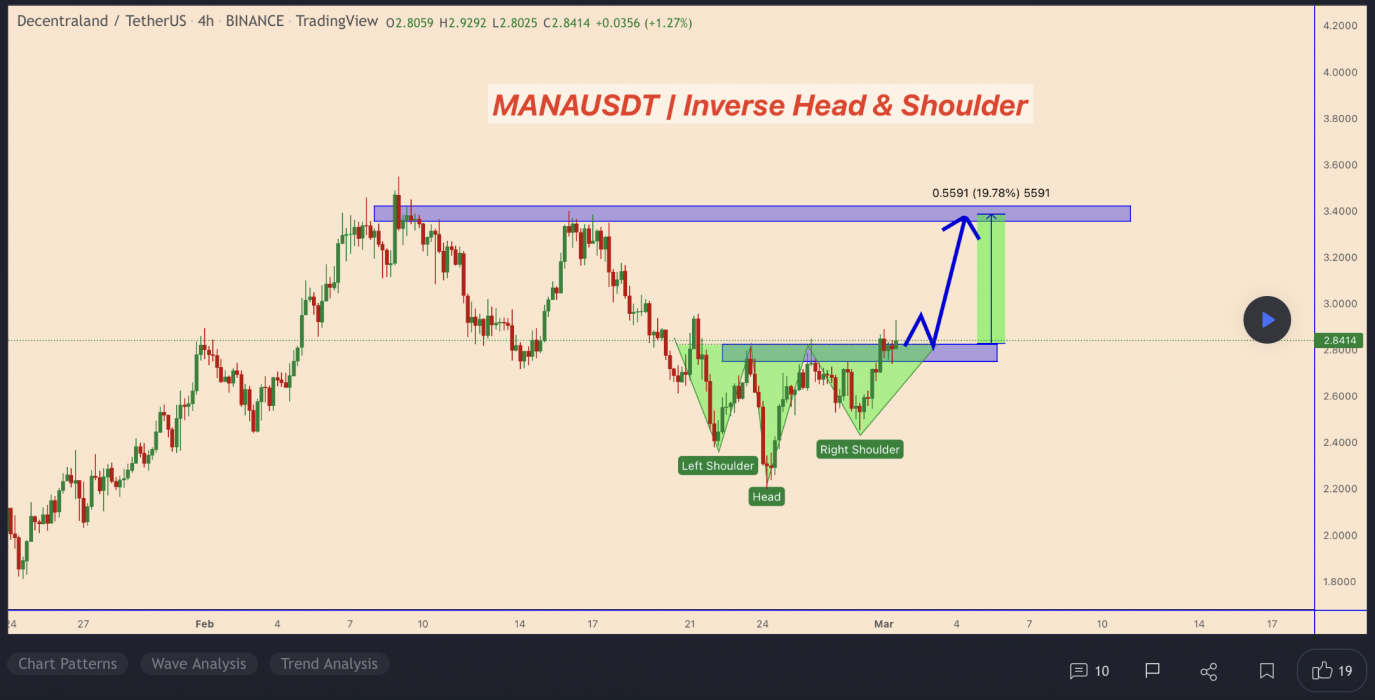
At the time of writing, MANA is ranked the 31st cryptocurrency globally and the current price is US$2.76. Let’s take a look at the chart below for price analysis:

Source: TradingView

Like many other altcoins, MANA set a monthly high during February before retracing 35% to the low at $2.50 last week.

The price broke through resistance near $2.53, which may mark an area of possible support on a retracement. If this support fails, bulls might also step in near $2.48. However, a drop this far increases the chances of a stop run to $2.42 and possibly into support near $2.37. For now, continuing bullish market conditions could help $2.67 become support.

The swing high around $2.90 gives bulls a reasonable first target, with $3.12 also likely to draw the price upward. Higher-timeframe resistance beginning near $3.22 or $3.25 could cap the move or trigger consolidations. If bullish market conditions continue, bulls might test probable resistance near new monthly highs around $3.35.

3. Waves (WAVES)

WAVES is a multi-purpose blockchain platform that supports various use cases, including decentralised applications (DApps) and smart contracts. The platform has undergone various changes and added new spin-off features to build on its original design. Waves’ native token is WAVES, an uncapped supply token used for standard payments such as block rewards. Waves initially set out to improve on the first blockchain platforms by increasing speed, utility, and user-friendliness.

WAVES Price Analysis

At the time of writing, WAVES is ranked the 54th cryptocurrency globally and the current price is US$17.52. Let’s take a look at the chart below for price analysis:

Source: TradingView

During December’s high, WAVES‘ 40% drop marks the current range as a reasonable area to expect accumulation.

The recent bearish flip of the 9, 18 and 40 EMAs might cause bulls to be less aggressive in bidding. However, possible support near $15.88 and $14.35 – between the 61.8% and 78.6% retracements – could see at least a short-term bounce. 

Long-term consolidation suggests that the areas near $19.45 and $20.61 may be more likely to cause a longer-term trend reversal.

Bears are likely to add to their shorts at probable resistance beginning near $22.77, which has confluence with the 18 EMA. A fast break of this resistance could trigger more selling near $25.42, the start of the bearish move.

Learn How to Trade Live!

Join Dave and The Crypto Den Crew and they’ll show you live on a webinar how to take your crypto trading to the next level.

Where to Buy or Trade Altcoins?

These coins have high liquidity on Binance Exchange, so that could help with trading on AUD/USDT/BTC pairs. And if you’re looking at buying and HODLing cryptos, then Swyftx Exchange is an easy-to-use popular choice in Australia.

Categories
Alien Worlds Crypto News Elrond Market Analysis Trading Zcash

Top 3 Coins to Watch Today: ZEC, TLM, EGLD – March 2 Trading Analysis

Let’s take a closer look at today’s altcoins showing breakout signals. We’ll explain what the coin is, then dive into the trading charts and provide some analysis to help you decide.

1. Zcash (ZEC)

Zcash ZEC is a decentralised cryptocurrency focused on privacy and anonymity. It uses the zk-SNARK zero-knowledge proof technology that allows nodes on the network to verify transactions without revealing any sensitive information about those transactions. Zcash transactions, on the other hand, still have to be relayed via a public blockchain, but unlike pseudonymous cryptocurrencies, ZEC transactions by default do not reveal the sending and receiving addresses or the amount being sent.

ZEC Price Analysis

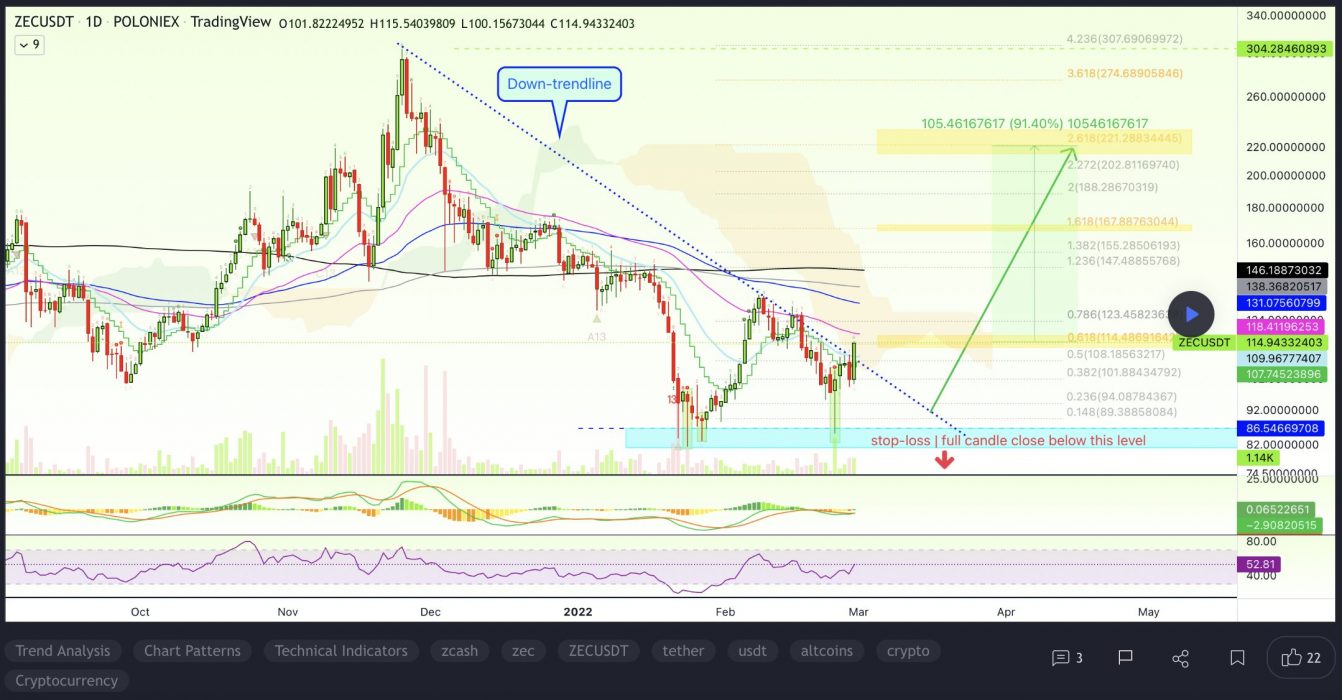
At the time of writing, ZEC is ranked the 60th cryptocurrency globally and the current price is US$116.48. Let’s take a look at the chart below for price analysis:

Source: TradingView

ZEC‘s recent bearish flip of the 9, 18 and 40 EMAs might cause bulls to be less aggressive in bidding. However, possible support near $96.47 and $112.96 – between the 61.8% and 78.6% retracements – could see at least a short-term bounce. 

Last year’s long-term consolidation suggests that the areas near $88.23 may be more likely to cause a longer-term trend reversal. 

Bears are likely to add to their shorts at probable resistance beginning near $125.50, which has confluence with the 18 EMA. A fast break of this resistance could trigger more selling near $140.12, the start of the bearish move.

If an aggressive bullish move does appear, trapped buyers in the probable resistance beginning near $158.41 might provide a ceiling for this impulse.

2. Alien Worlds (TLM)

Alien Worlds TLM is a decentralised, non-fungible token (NFT) metaverse where players compete for scarce resources of Trilium (TLM) in a simulated economy based around planetary worlds. Due to this, Alien Worlds also has a decentralised finance (DeFi) element to the game, as players advance by staking TLM and using TLM to vote in planetary Decentralised Autonomous Organisations (DAOs). 

TLM Price Analysis

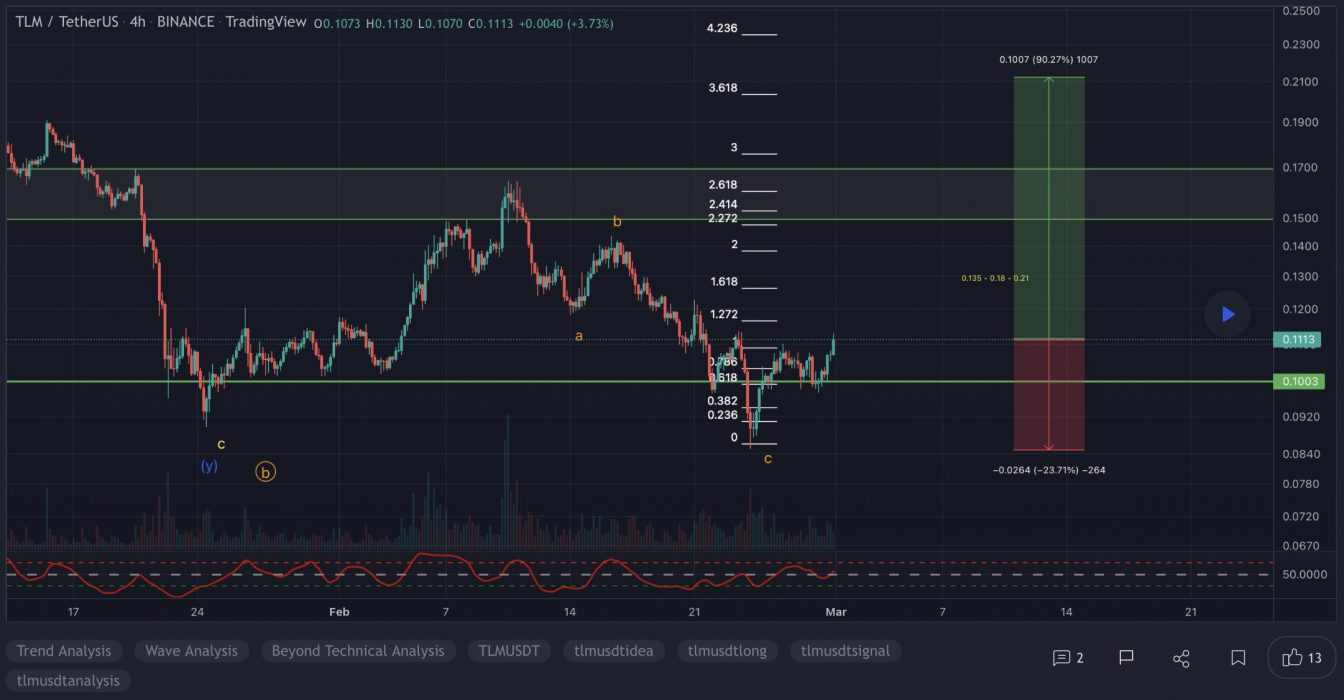
At the time of writing, TLM is ranked the 370th cryptocurrency globally and the current price is US$0.1127. Let’s take a look at the chart below for price analysis:

Source: TradingView

TLM formed relatively equal lows near $0.09541 after dropping over 45% last month. These lows could provide the target for another leg down, possibly finding support in the monthly gap of around $0.09354. 

If this sweep of the $0.09053 swing lows occurs, more aggressive bulls might begin bidding the weekly level near the swing low around $0.08944. Should the market take a more bullish turn, the level just below, near $0.08863, could provide some short-term support.

The steep drop left large areas of inefficient price action, making the daily gap up to $0.1436 likely to be touched or filled. A sustained move through this resistance could visit a significant area on the monthly and weekly chart near $0.1705.

3. Elrond (EGLD)

Elrond EGLD is a blockchain protocol that seeks to offer extremely fast transaction speeds by using sharding. The project describes itself as a technology ecosystem for the new internet, which includes fintech, decentralised finance, and the Internet of Things. Its smart contracts execution platform is reportedly capable of 15,000 transactions per second, six-second latency, and a $0.001 transaction cost. The blockchain has a native token known as eGold, or EGLD, that is used for paying network fees, staking, and rewarding validators.

EGLD Price Analysis

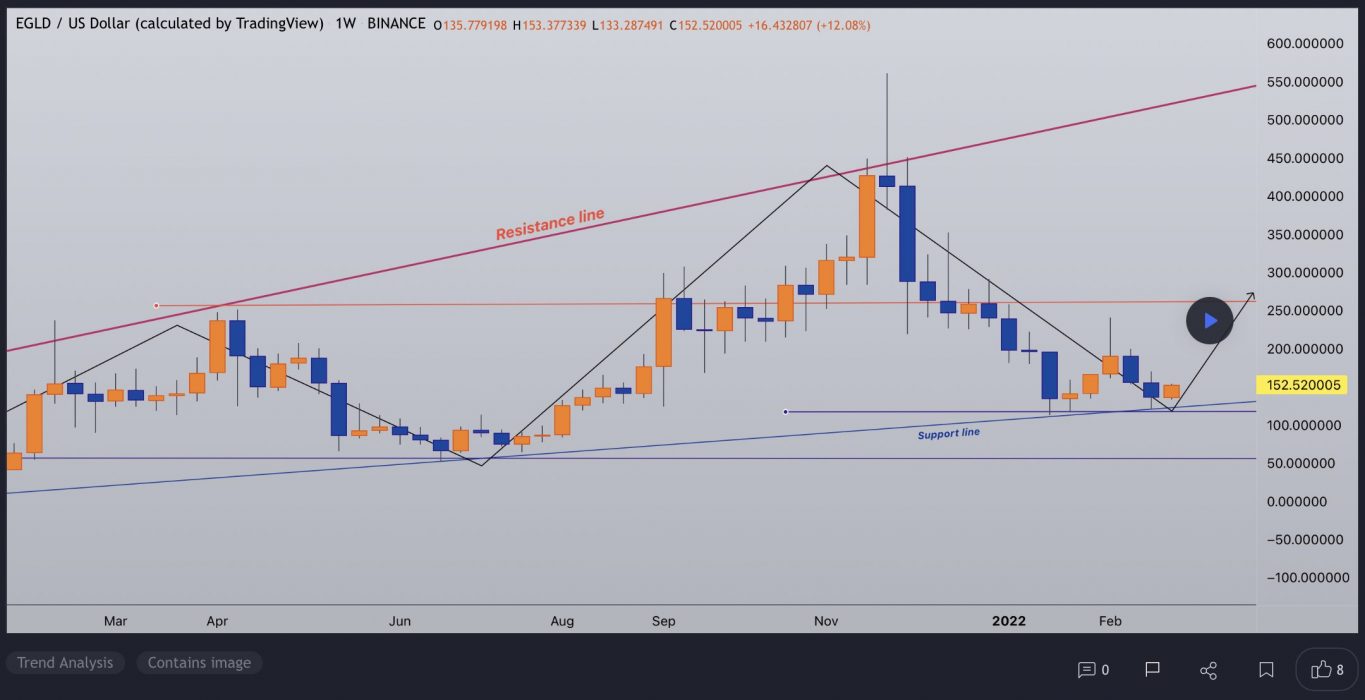
At the time of writing, EGLD is ranked the 40th cryptocurrency globally and the current price is US$150.97. Let’s take a look at the chart below for price analysis:

Source: TradingView

EGLD‘s 45% retracement from its February highs set a low near $132.23 during its consolidation that began last week.

Relatively equal highs near $179.44 could be the current target if the price breaks through resistance beginning near $200.45. Bullish continuation might reach through the next significant swing high near $215.71 into the daily gap near $229.16.

If bullish strength continues, the zones just below the previous monthly open near $238.69 and $245.87 could halt any retracement. 

A bearish shift in the market might seek the relatively equal lows near $145.19 into possible support near $140.43. If this down move occurs, the swing low near $137.22 and possible support near $135.70 may be the primary objective.

Learn How to Trade Live!

Join Dave and The Crypto Den Crew and they’ll show you live on a webinar how to take your crypto trading to the next level.

Where to Buy or Trade Altcoins?

These coins have high liquidity on Binance Exchange, so that could help with trading on AUD/USDT/BTC pairs. And if you’re looking at buying and HODLing cryptos, then Swyftx Exchange is an easy-to-use popular choice in Australia.

Categories
Crypto News EOS Market Analysis Solana Syscoin Trading

Top 3 Coins to Watch Today: EOS, SOL, SYS – March 1 Trading Analysis

Let’s take a closer look at today’s altcoins showing breakout signals. We’ll explain what the coin is, then dive into the trading charts and provide some analysis to help you decide.

1. Eos (EOS)

EOS is a platform designed to allow developers to build decentralised apps. The project’s goal is relatively simple: to make it as straightforward as possible for programmers to embrace blockchain technology and ensure the network is easier to use than rivals. As a result, tools and a range of educational resources are provided to support developers who want to build functional apps quickly. EOS also aims to improve the experience for users and businesses. While the project tries to deliver greater security and less friction for consumers, it also vies to unlock flexibility and compliance for enterprises.

EOS Price Analysis

At the time of writing, EOS is ranked the 47th cryptocurrency globally and the current price is US$2.19. Let’s take a look at the chart below for price analysis:

Source: TradingView

EOS has been in an overall decline for the last 10 months and has reached 87% below its mid-May 2021 high.

Just above the current price, near $2.1364, might be the bears’ first line of resistance in the upcoming weeks. This level is near the 9 EMA and consolidation highs that formed after the low sweep at $1.9940.

A slightly larger rally toward the February open is possible. Resistance could be found between $2.2760 and $2.4306, with the lower half of this range possibly proving stronger. This range has confluence with the 40 EMA and accumulation area for the early February run on bears’ stops.

While less likely, a more extended rally might reach probable resistance near $3.2716. This area is in the upper half of a significant consolidation area on higher-timeframe charts.

Bulls might find support beginning near $1.7000 – perhaps if traders “sell the news” of the Mandel 3.0 release. However, $1.4200 to $1.2142 could offer a higher probability of a short-term bottom before a more substantial bounce. Higher timeframes show inefficient trading in this zone, as well as in another possible support beginning near $0.9000.

2. Solana (SOL)

Solana SOL is a highly functional open-source project that banks on blockchain technology’s permissionless nature to provide decentralised finance (DeFi) solutions. The Solana protocol is designed to facilitate decentralised app (DApp) creation. It aims to improve scalability by introducing a proof-of-history (PoH) consensus combined with the underlying proof-of-stake (PoS) consensus of the blockchain.

SOL Price Analysis

At the time of writing, SOL is ranked the 9th cryptocurrency globally and the current price is US$95.27. Let’s take a look at the chart below for price analysis:

Source: TradingView

SOL has retraced 71% from its November all-time high and reached possible support last week near $75.3450. Resistance might begin near $89.2450, which has confluence with the 9 and 18 EMAs.

A more substantial rally might reach near the swing high at $105.9075 and the 40 EMA. This high is less likely to break if bears plan to continue the downtrend without a lengthier consolidation.

While not highly probable in the current market conditions, a more animated move upward could reach a wide resistance area between $122.0000 and $147.9425. This zone is where the last movement down accumulated positions before breaking down. 

Possible support rests near $75.3450, which showed sensitivity on the last test. While it could provide support again, the higher-timeframe bearish trend is more likely to propel the price into an inefficient area between $66.1000 and $54.7225. If the price reaches this zone, the May 2021 swing high near $58.4425 might mark a more sensitive level.

An eventual break of this support might target $42.8725, where the price consolidated during the summer before beginning its last bull run.

3. Syscoin (SYS)

Syscoin SYS is a full Layer-1 and Layer-2 blockchain solution built to combine industry-proven technology to support cutting-edge applications all in one network. The project’s goal is to build a protocol that transforms the blockchain experience and combines the best of Bitcoin and Ethereum. Through Bitcoin merge-mining, Syscoin transforms Bitcoin’s Proof-of-Work security and decentralisation into a functional and scalable solution. Syscoin’s token platform currently features custom notary API, Fungible Tokens, NFTs, and Fractionalised NFTs.

SYS Price Analysis

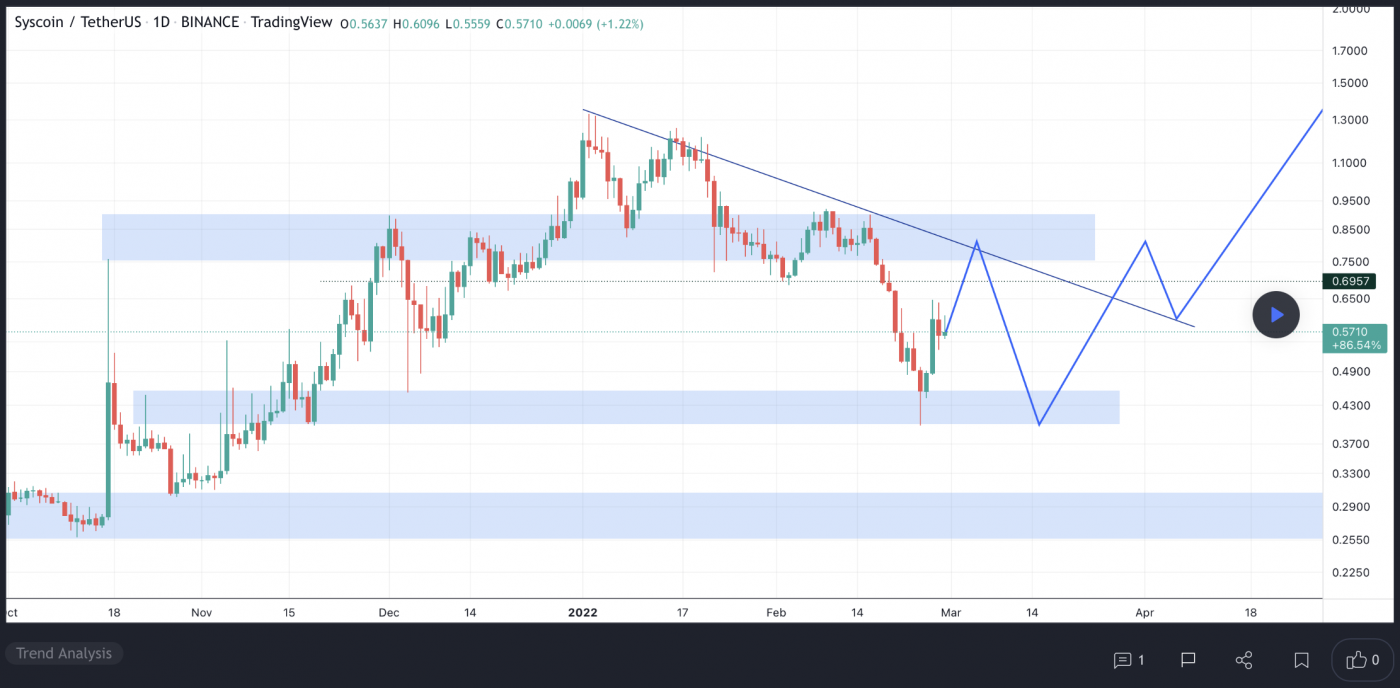
At the time of writing, SYS is ranked the 138th cryptocurrency globally and the current price is US$0.6116. Let’s take a look at the chart below for price analysis:

Source: TradingView

Early January 2022 created the all-time high in SYS before its retracement, which reached 70% by last week.

A sharp weekly rally might have formed possible resistance near $0.688700, where higher timeframes show a small inefficient area. 

Slightly lower, an area from $0.596187 to $0.629302 might also provide resistance. This area shows significant rejection of bulls by bears and has confluence with the 18 EMA.

While less probable in the current market conditions, a more significant rally could reach the February monthly open near $0.596187. This area saw consolidation before the recent drop and shows signs of inefficient trading.

From $0.528137 to $0.471303, price structures near the recent swing low could offer some support and perhaps form the lower end of an upcoming consolidation range. 

A break through this support might be targeting the midpoint of Q2 2022’s accumulation near $0.309023, where higher timeframes suggest bulls’ stops might provide an attractive target for bears.

Learn How to Trade Live!

Join Dave and The Crypto Den Crew and they’ll show you live on a webinar how to take your crypto trading to the next level.

Where to Buy or Trade Altcoins?

These coins have high liquidity on Binance Exchange, so that could help with trading on AUD/USDT/BTC pairs. And if you’re looking at buying and HODLing cryptos, then Swyftx Exchange is an easy-to-use popular choice in Australia.

Categories
Market Analysis The Crypto Den

TradeRoom: Our Weekly Crypto Trades Analysis – Feb 28, 2022

Welcome to this weekly series from the TradeRoom. My name is Dave and I’m the founder of The Crypto Den, an Australian-based crypto trading and education community aiming to give you the knowledge to take your trading game to the next level.

Crypto Market Outlook

Well, not much has changed on the TOTAL Crypto Cap since last week. Still hovering around that US$1.7 trillion area, still inside the bearish channel, still below key resistance and still below the daily 200 EMA. Nothing spectacular has happened with volume coming into the market as yet either, so I’m really not seeing anything here to get excited about. I still see the potential for a 30 percent drop, which will take us to a US$1.2 trillion valuation.

TOTAL Crypto Cap

BTC/USD

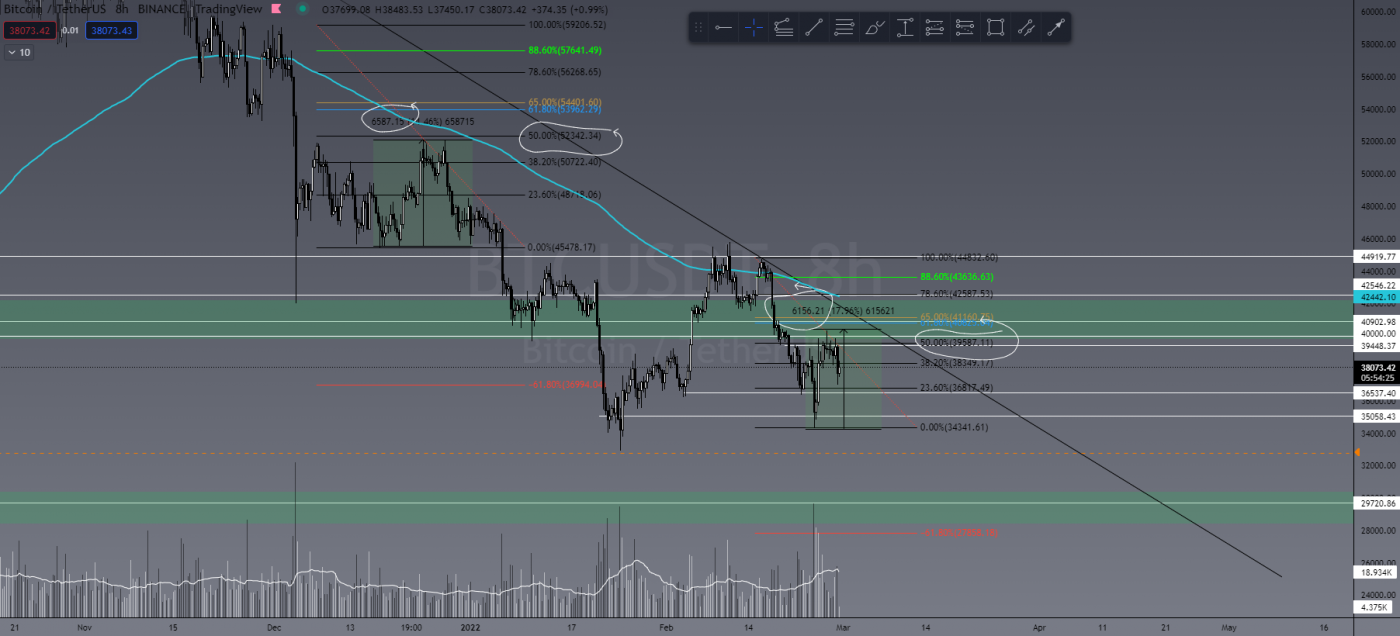
BTC has seen a small pump from US$35,000 to US$40,000 over the past few days, which has seen a lot of crypto socials get excited. But not this guy! Don’t get me wrong – a US$5,000 swing is no small thing, but it’s not big enough yet to really send us to the moon. We saw it happen in December where price action climbed US$6,000 and to the 50 percent Fibonacci level before further downside. This time it’s done almost the exact same movement, pending more downside.

BTC/USDT 4H

I’ve said it a few times recently that I’m not bullish until we see a break above US$46,000. If we reverse here, does that mean I miss the bottom? Yep! But as traders, we aren’t searching for tops and bottoms as such, we are looking for clear directions and changes in market structure. That’s how you safely assure profitable trades.

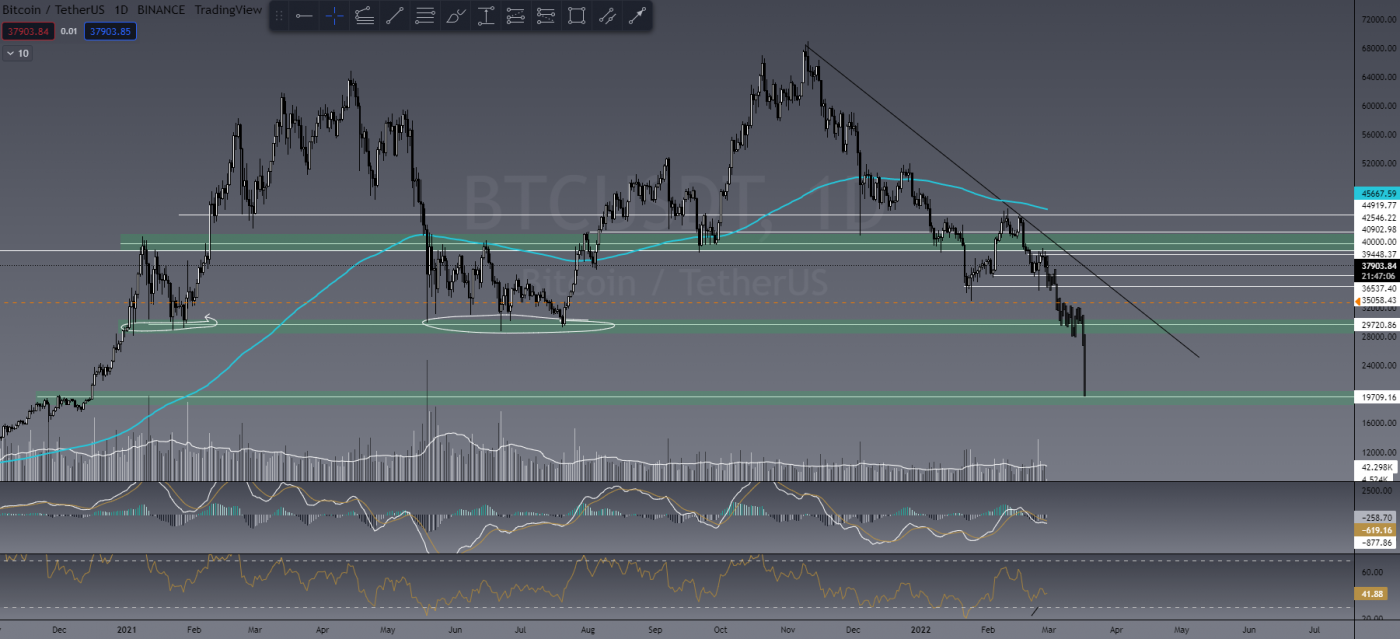
I maintain there is huge potential to see BTC revisit the highs of the 2017/2018 bull run, and the chart below shows just how easily it could happen:

BTC/USDT 1D

With geopolitical tensions changing each day, I don’t see this as out of the question. Gold and oil are both on the rise again after some profit taking, while the SPX is also having a relief rally. This lines up well with BTC having a bit of a run, but it will likely be short-lived.


Last Week’s Performance

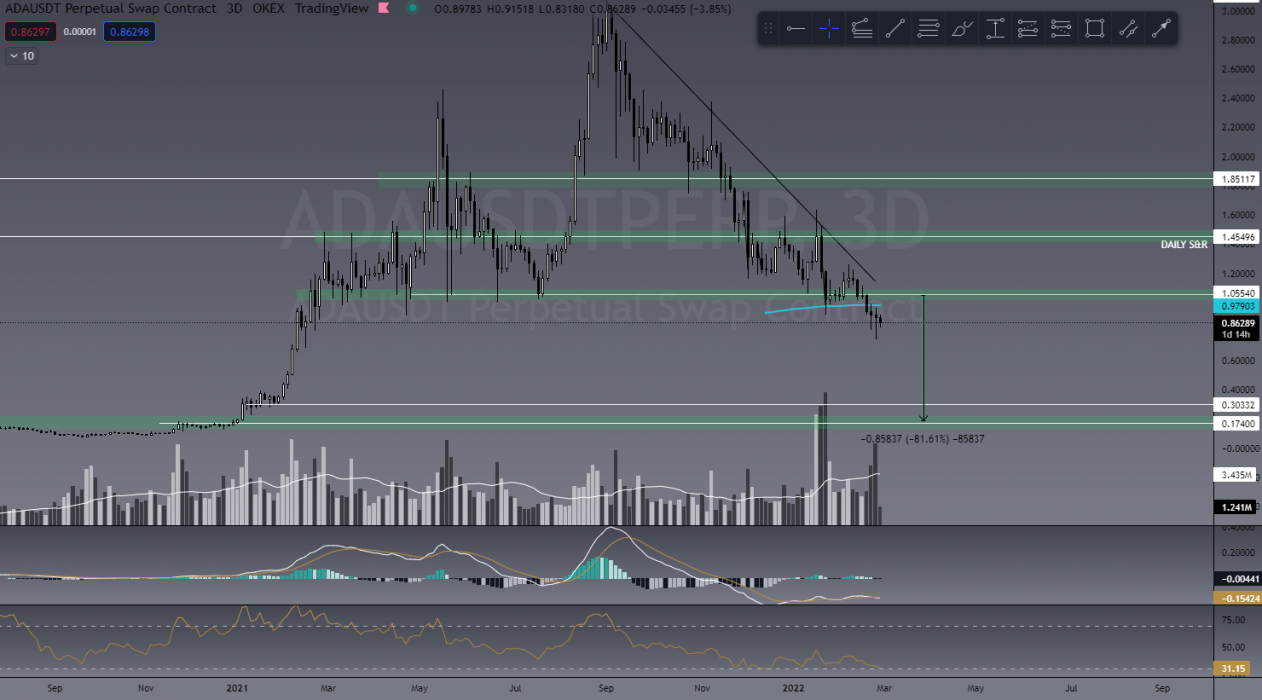
ADA/USDT

Over the past few months and in last week’s article, I’ve outlined my intended trade for ADA, taking a short position at the break of the US$1.00 level. It’s currently down 20 percent from entry with (hopefully for me) a lot more to come. The first big profit-taking target is still US$0.30.

ADA/USDT

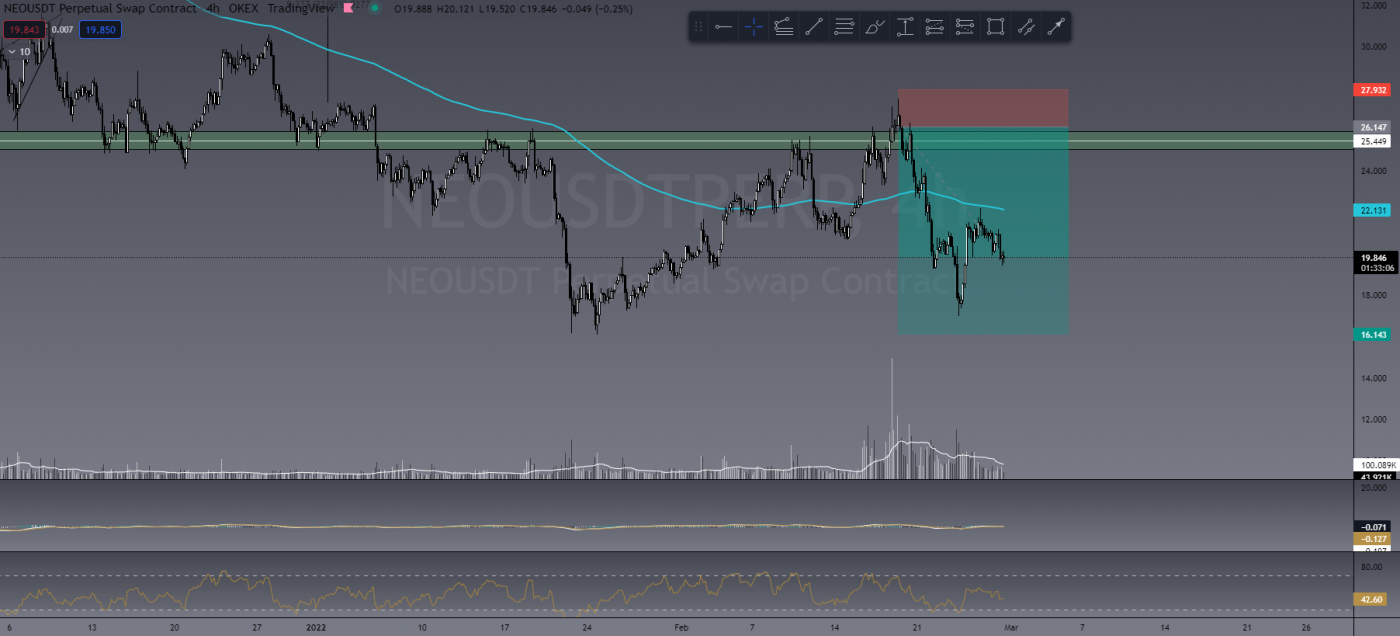
NEO/USDT

I’m still in this Neo short, which is shown clearly in the RR tool on the chart below. I entered at a daily level of resistance and have a TP set for US$16.00. If BTC continues down, I’ll likely let some of this ride.

NEO/USDT

This Week’s Trades

WAVES/USDT

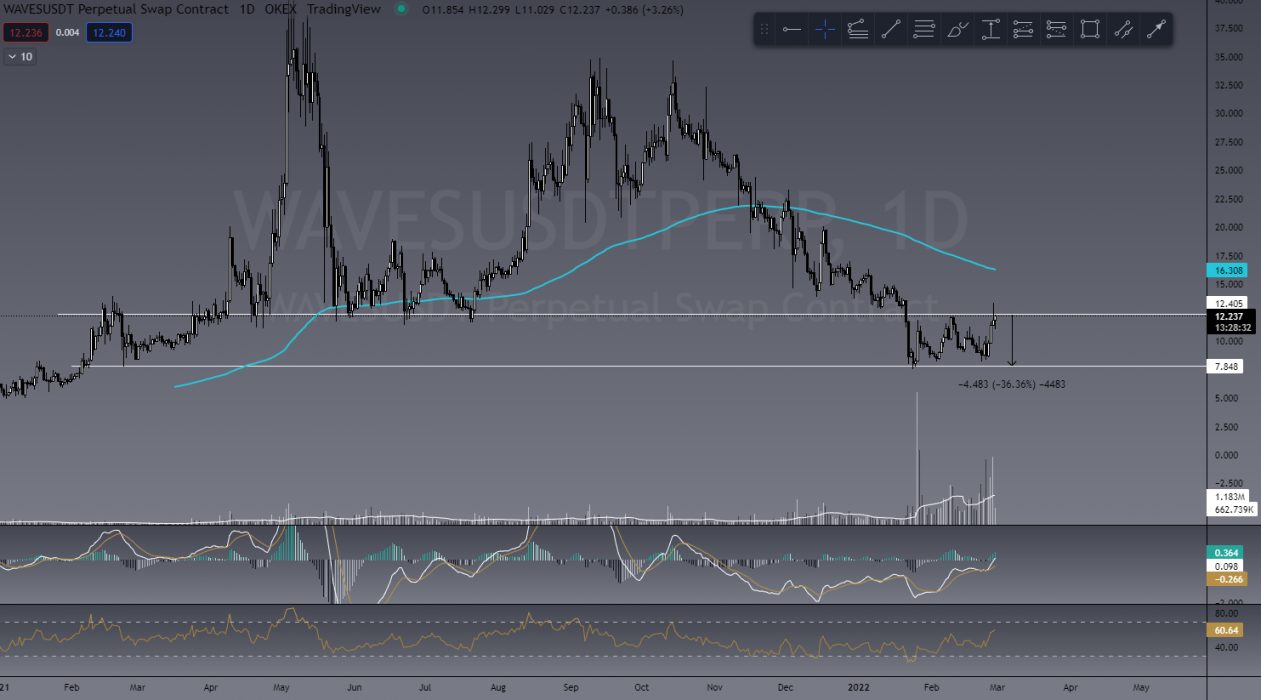
In the group, we’re looking for coins that have seen larger recoveries than others for short positions. One we’re watching at the moment is WAVES, as we’re seeing a buyer exhaustion wick at daily resistance so candlestick analysis is good, showing a potential 36% drop, which for us in the TradeRoom using leverage, that’s potentially a 360% profit. If the trade goes wrong, we’ll have a stop loss put in place to minimise our losses.

WAVES/USDT

SOL/USDT

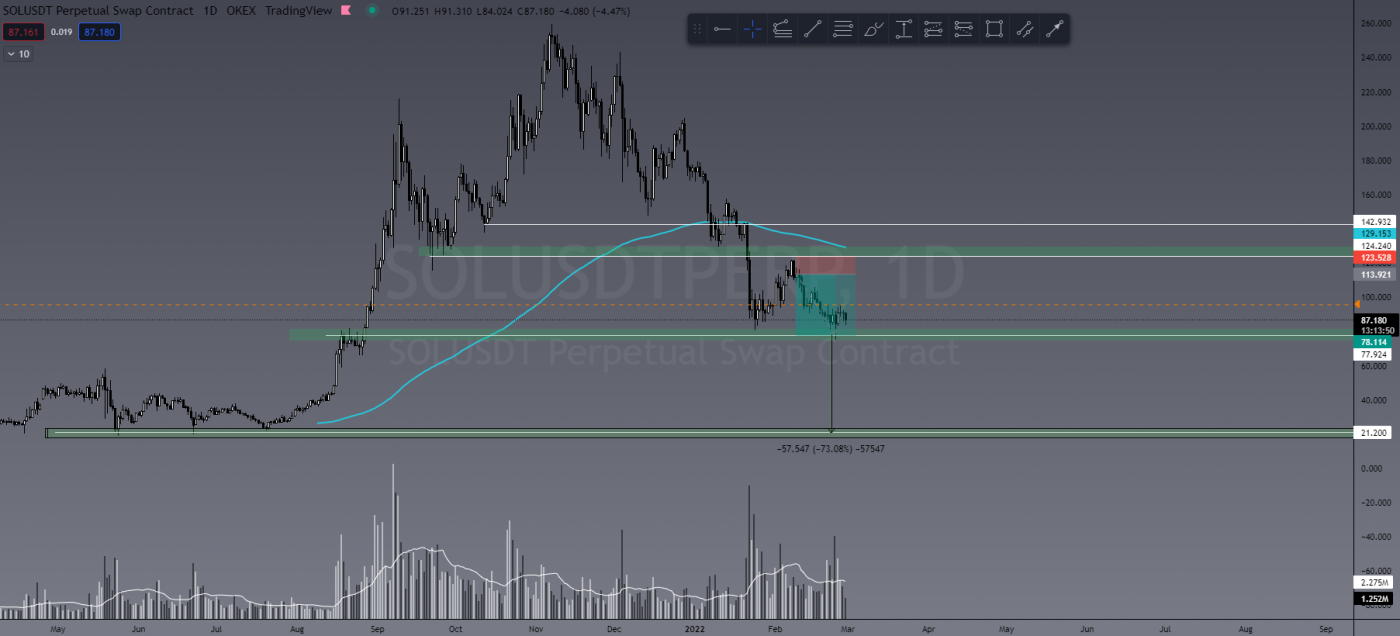
Another big one to watch out for is SOL. If the US$77.00 level breaks, there’s nothing there stopping it revisiting US$21.00 if BTC dumps. I’m already in a short trade on SOL from US$113.00, so won’t be entering any new positions on SOL.

SOL/USDT

Learn to Trade

We are giving away 3 months FREE TradeRoom (valued at $300) to those who join our LIVE Trading Fundamentals course starting TONIGHT at 7pm!

The Crypto Den is holding its first of only two trading courses for 2022 on February 28! That’s right, we will only be running two programs in 2022! What makes us different? Our lessons are LIVE and come with a community where you submit your homework and receive feedback to ensure you understand what we teach!

Duration: 6 week course
Date/Time: Live trading course twice a week – Mon & Wed at 7pm AEST
Frequency: We now run our LIVE course only twice per year
Location: Zoom Webinar
From: February 28 to April 13

The Crypto Den’s Trading Fundamentals trading course is a LIVE interactive course designed to teach you how to trade the crypto markets from absolute beginner level!

Our six-week program teaches you how to set up your trade accounts using reputable exchanges and brokers, how to read the charts using technical analysis, and to protect your capital using effective risk management strategies.

We have taught thousands of students in the past five years how to trade these volatile and highly profitable markets. See our REAL reviews from REAL students.

Using ZOOM twice a week, all of our lessons are LIVE and recorded so you can access them over and over again in our structured course through our website and smartphone app. Lessons come with homework and online quizzes, as well as an amazing online and private community of students.

So what are you waiting for? Join now to start learning!


Already Know How to Trade?

Invite to Join our TradeRoom

If you’d like to become a better trader, you’re invited to join our TradeRoom where we share daily charts and market analysis. In our community we strongly encourage and teach correct risk management strategies to keep our members safe in this new volatile crypto market.
Join our “Apprentice” plan now for your 7-day trial.


The Crypto Den was created in 2017 to help the rapidly growing crypto community learn and understand the fundamentals of digital currencies and how to trade them. 

Since then we have taught thousands of members the basics of technical analysis and trading strategies to further progress and perfect their trading abilities.

In the TradeRoom you will be included in a supportive environment which encourages personal growth, education and community support.

It’s a place to share your trading ideas and follow other experienced traders’ feeds to help keep your finger on the pulse of such a volatile market!

Categories
Ankr Crypto News Dash Enjin Coin Market Analysis Trading

Top 3 Coins to Watch Today: DASH, ENJ, ANKR – February 28 Trading Analysis

Let’s take a closer look at today’s altcoins showing breakout signals. We’ll explain what the coin is, then dive into the trading charts and provide some analysis to help you decide.

1. Dash (DASH)

Dash is an open-source blockchain and cryptocurrency focused on offering a fast, cheap global payments network that is decentralised in nature. According to the project’s white paper, Dash seeks to improve on Bitcoin by providing stronger privacy and faster transactions. Dash’s governance system, or treasury, distributes 10% of the block rewards for the development of the project in a competitive and decentralised way.

DASH Price Analysis

At the time of writing, DASH is ranked the 80th cryptocurrency globally and the current price is US$93.13. Let’s take a look at the chart below for price analysis:

Source: TradingView

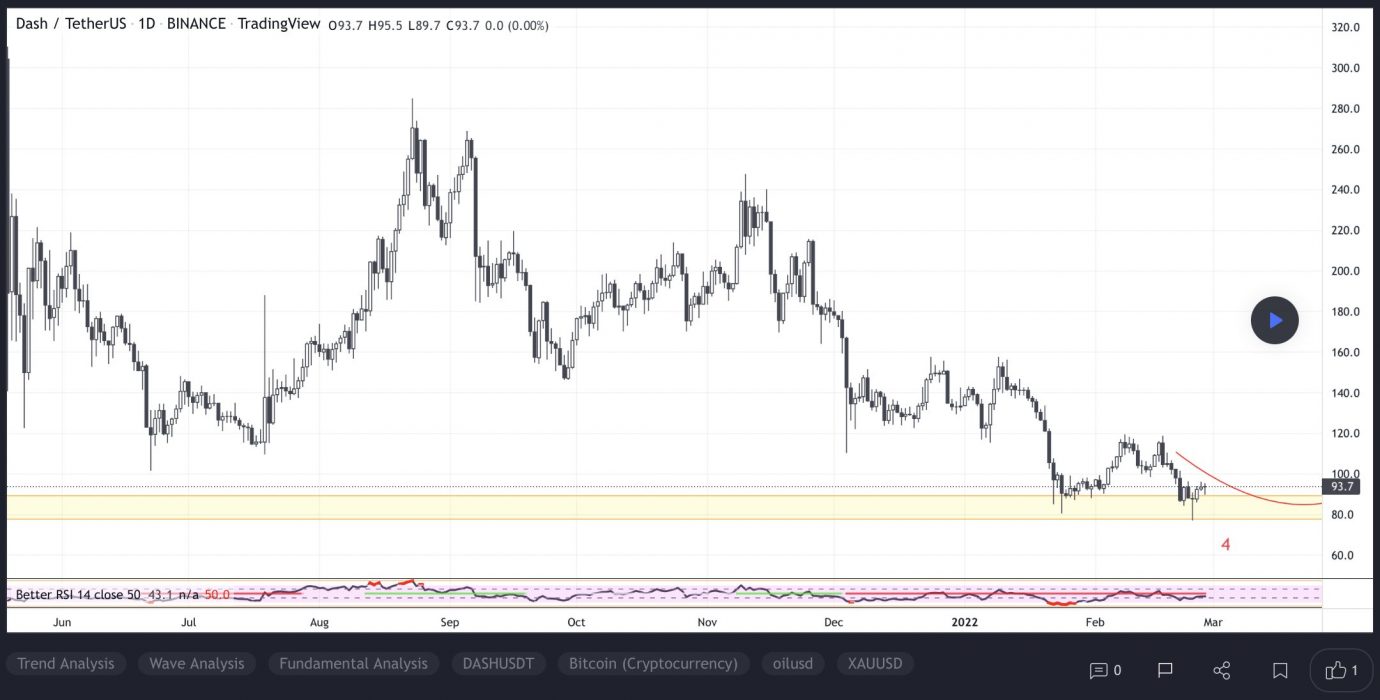
During January, DASH retraced over 45% before finding support near $90.13 Consolidation above this level has created a series of relatively equal lows, which are likely to be swept before any longer-term bullish trend begins. 

In the shorter term, the price might establish support near $92.50 before running the swing high at $106.88. If this bullish move occurs, the price could reach resistance near the weekly open around $115.43, and may even sweep the swing high near $123.22

Some support might exist at the daily gap near $87.12. A move this low would also fill the monthly gap and set the stage for a possible bullish reversal.

2. Enjin Coin (ENJ)

Enjin Coin ENJ is a project of Enjin, a company that provides an ecosystem of interconnected, blockchain-based gaming products. Enjin’s flagship offering is the Enjin Network, a social gaming platform through which users can create websites and clans, chat, and host virtual item stores. Enjin Coin is a digital store of value used to back the value of blockchain assets such as non-fungible tokens (NFTs).

ENJ Price Analysis

At the time of writing, ENJ is ranked the 67th cryptocurrency globally and the current price is US$1.45. Let’s take a look at the chart below for price analysis:

Source: TradingView

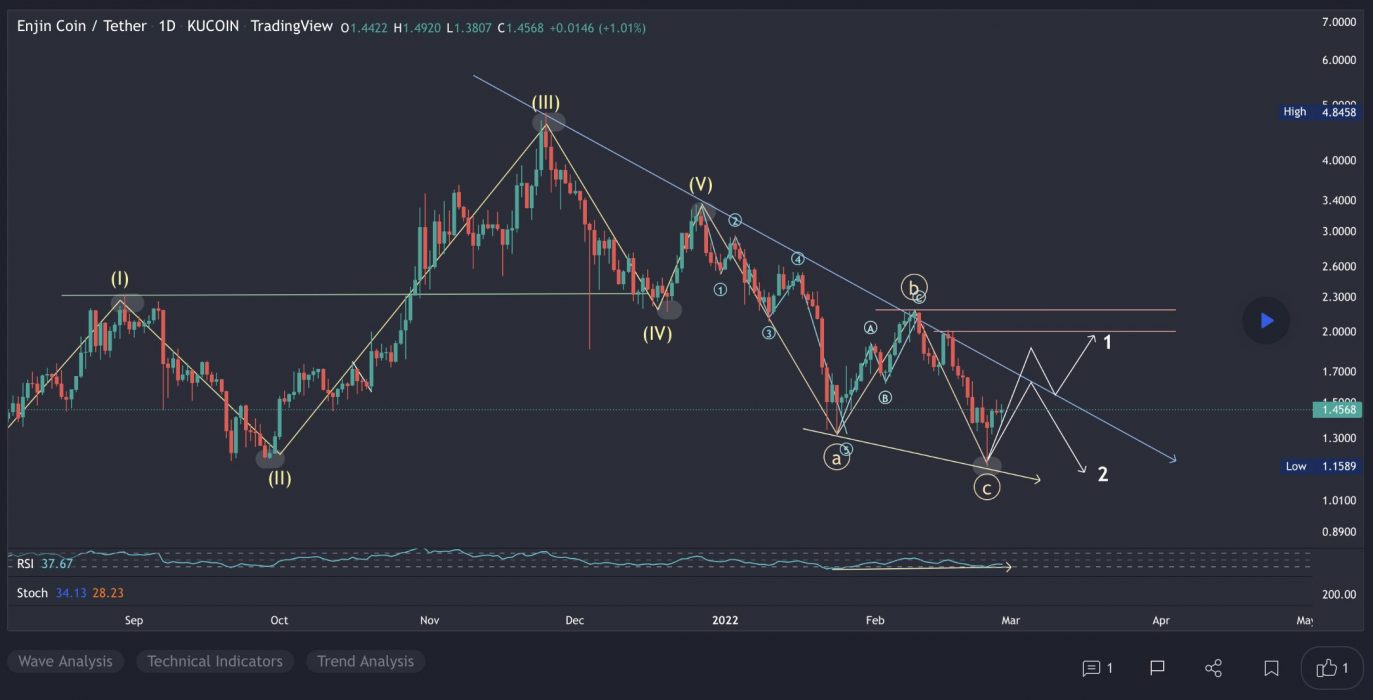
ENJ spent February ranging across the monthly open, reaching 30% over and 23% below. The price is currently consolidating between adjacent resistance and support at $1.45 with no clear higher-timeframe trend. A strong move over the monthly open could signal a run to resistance beginning near $1.95. 

This move would likely target the swing high at $2.12 and relatively equal highs near $2.29. A sustained bullish trend could reach up to the monthly high near $2.35.

Bulls might see a sweep of the relatively equal lows near $1.42 as a chance to buy at a discount. If this level fails to hold, the next significant area for the price to find buyers is likely near the consolidation around $1.38 and $1.30.

3. Ankr (ANKR)

ANKR originates as a solution that utilises shared resources in order to provide easy and affordable blockchain node hosting solutions, it has since built a marketplace for container-based cloud services through the usage of shared resources. It is a platform that enables the sharing economy, where any customer can access resources at a more affordable rate, while also providing enterprises with the ability to monetise their spare computing power that is not being utilised. It is unique in the way that it is the first to use trusted hardware, and this ensures a high level of security.

ANKR Price Analysis

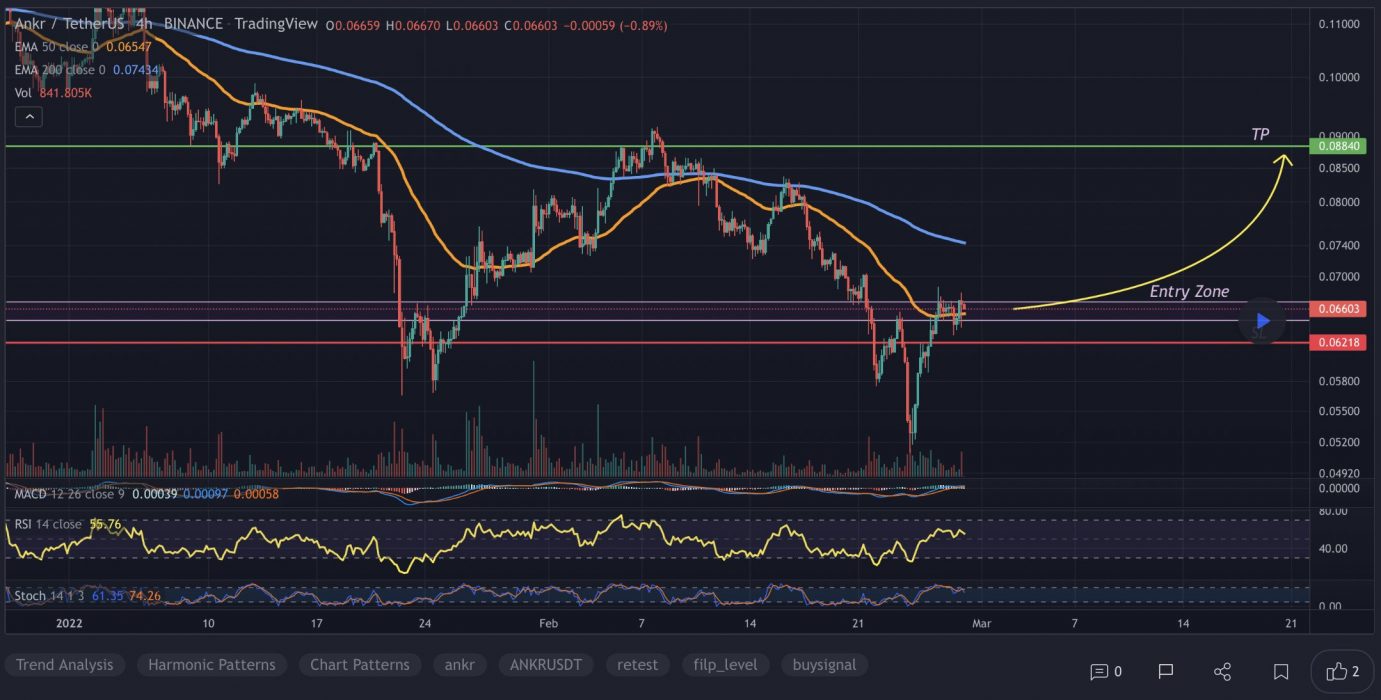
At the time of writing, ANKR is ranked the 107th cryptocurrency globally and the current price is US$0.06559. Let’s take a look at the chart below for price analysis:

Source: TradingView

ANKR continues to set monthly lows in its downward trend.

Support might be found in the daily gap above the monthly open near $0.06295. A deeper retracement is likely to target the relatively equal lows into support near $0.06125. 

The daily gap near $0.05966 could also provide support. However, another gap inside the down candles, around $0.05732, provides the highest chances of solid support while offering a high risk-reward entry.

There is currently no resistance overhead since the price is in discovery. Extensions hint at the areas around $0.06895 and $0.07244 as reasonable take-profit zones.

Learn How to Trade Live!

Join Dave and The Crypto Den Crew and they’ll show you live on a webinar how to take your crypto trading to the next level.

Where to Buy or Trade Altcoins?

These coins have high liquidity on Binance Exchange, so that could help with trading on AUD/USDT/BTC pairs. And if you’re looking at buying and HODLing cryptos, then Swyftx Exchange is an easy-to-use popular choice in Australia.

Categories
ChainLink Crypto News dYdX ICP Market Analysis Trading

Top 3 Coins to Watch Today: LINK, DYDX, ICP – February 25 Trading Analysis

Let’s take a closer look at today’s altcoins showing breakout signals. We’ll explain what the coin is, then dive into the trading charts and provide some analysis to help you decide.

The Chainlink Network LINK is driven by a large open-source community of data providers, node operators, smart contract developers, researchers, security auditors, and more. The company focuses on ensuring that decentralised participation is guaranteed for all node operators and users looking to contribute to the network. Chainlink allows blockchains to securely interact with external data feeds, events and payment methods, providing the critical off-chain information needed by complex smart contracts to become the dominant form of digital agreement.

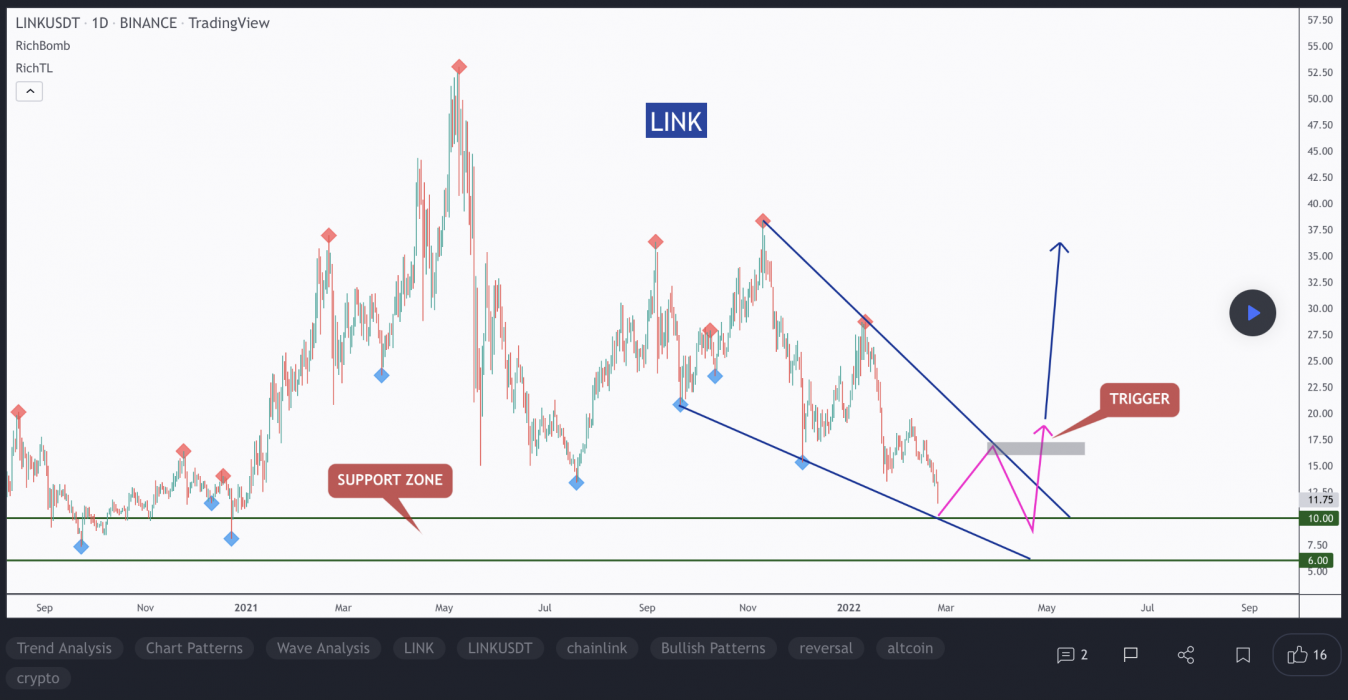
At the time of writing, LINK is ranked the 24th cryptocurrency globally and the current price is US$12.50. Let’s take a look at the chart below for price analysis:

Source: TradingView

LINK‘s early January spike retraced near $12.46 into the consolidation that began the impulse before bouncing to $14.30. 

This consolidation could provide support again, although bears would first have to push the price through possible support near $12.00. The market’s structure may be shifting bearish, with $13.52 likely to provide some resistance if this is the case. A sustained bearish move could reach the swing low near $11.63 before finding support near $10.71.

However, the bullish higher-timeframe trend might prevail, with relatively equal highs near $16.78 potentially giving an attractive target to lure the price over the monthly open. If so, the price could reach for the midpoint of the December wick near $20.58.

2. Dydx (DYDX)

DYDX is a governance token that allows the dYdX community to truly govern the dYdX Layer 2 Protocol. By enabling shared control of the protocol, DYDX allows traders, liquidity providers and partners of dYdX to work collectively towards an enhanced protocol. DYDX enables a robust ecosystem around governance, rewards and staking, each designed to drive future growth and decentralisation of dYdX, resulting in a better experience for users.

DYDX Price Analysis

At the time of writing, DYDX is ranked the 140th cryptocurrency globally and the current price is US$4.83. Let’s take a look at the chart below for price analysis:

Source: TradingView

DYDX consolidates between $4.60 and $5.90 with the bulk of the volume concentrated in the lower half of the range. The price does not indicate a clear longer-term direction yet as stop orders build on both sides of the range.

Range traders will likely take profits or sell near $5.32. A stop run and swift rejection above $5.74 could provide a more favourable risk-to-reward entry for bears. An old 4h gap around $6.35 might cap this stop run.

Bulls will likely accumulate more long positions on a run below the relatively equal lows near $4.70. Little exists below the current range to identify precise support levels. However, the area between $4.58 and $4.50 could also give support during a deeper stop run.

If the price does break out decisively to the upside, the swing high at $6.15 provides a reasonable target. The highs and daily resistance levels between $6.47 and $6.80 may provide a second target.

3. Internet Computer (ICP)

The Internet Computer ICP is the world’s first blockchain that runs at web speed with unbounded capacity. It also represents the third major blockchain innovation, alongside Bitcoin and Ethereum – a blockchain computer that scales smart contract computation and data, runs them at web speed, processes and stores data efficiently, and provides powerful software frameworks to developers. By making this possible, the Internet Computer enables the complete reimagination of software, providing a revolutionary new way to build tokenised internet services, pan-industry platforms, decentralised financial systems, and even traditional enterprise systems and websites.

ICP Price Analysis

At the time of writing, ICP is ranked the 36th cryptocurrency globally and the current price is US$15.64. Let’s take a look at the chart below for price analysis:

Source: TradingView

During January, ICP also turned the corner, breaking a key swing high. This move could suggest a longer-term bullish trend.

The swing high near $26.24 stands out as a bullish target and marks an area of probable resistance. Further continuation could reach into possible resistance starting near $31.35.

Even if the bearish trend continues, a stop run at the recent swing low near $15.00 into possible support beginning near $14.67 is reasonable. If the price reaches further down, the swing low and possible support near $13.97 might provide another downside target. 

The area near $13.25 could also provide support. However, a drop this far could suggest a stop run below the higher-timeframe relatively equal lows near $12.80 into possible support beginning around $12.00.

Learn How to Trade Live!

Join Dave and The Crypto Den Crew and they’ll show you live on a webinar how to take your crypto trading to the next level.

Where to Buy or Trade Altcoins?

These coins have high liquidity on Binance Exchange, so that could help with trading on AUD/USDT/BTC pairs. And if you’re looking at buying and HODLing cryptos, then Swyftx Exchange is an easy-to-use popular choice in Australia.