Categories
Basic Attention Token Crypto News Market Analysis Orion Protocol Trading Zilliqa

Top 3 Coins to Watch Today: BAT, ORN, ZIL – June 27 Trading Analysis

Let’s take a closer look at today’s altcoins showing breakout signals. We’ll explain what the coin is, then dive into the trading charts and provide some analysis to help you decide.

Basic Attention Token BAT is the token that powers a new blockchain-based digital advertising platform designed to fairly reward users for their attention while providing advertisers with a better return on their ad spend. The Basic Attention Token itself is the unit of reward in this advertising ecosystem and is exchanged between advertisers, publishers and users. Advertisers pay for their advertising campaigns in BAT tokens. Out of this budget, a small portion is distributed to advertisers, while 70% is distributed to users – whereas the intermediaries that typically drive up advertising costs are cut out of the equation to improve cost-efficiency.

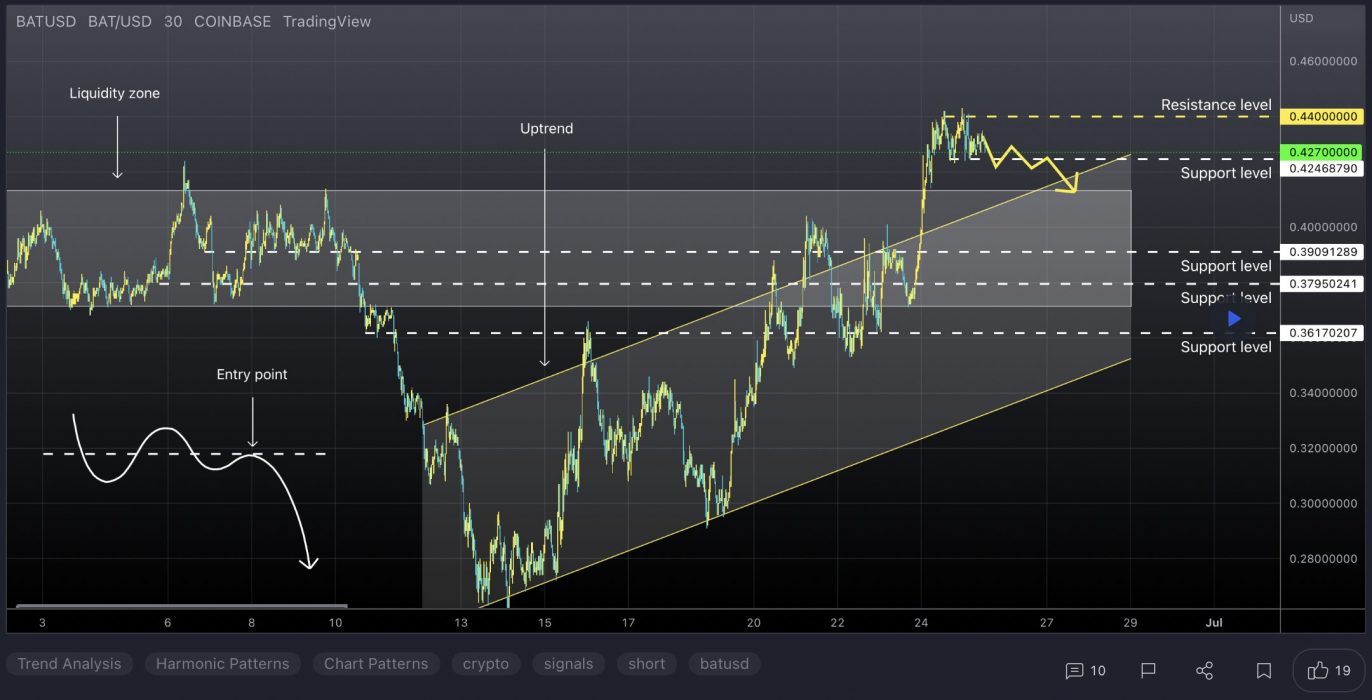
At the time of writing, BAT is ranked the 68th cryptocurrency globally and the current price is US$0.4032. Let’s take a look at the chart below for price analysis:
Source: TradingView

BAT has dropped nearly 70% from its Q2 2022 high and 82% from its November 2021 all-time high.

Support might have formed last week from $0.3834 to $0.3565 and should hold if bulls are ready for a bounce. This zone overlaps with an inefficiently traded area on the weekly chart from $0.3763 to $0.3294.

If this level breaks, bears might target an inefficiently traded area on the monthly chart from $0.3047 to $0.2732. Below this level, $0.2545 to $0.2380 could provide support after a run on bulls’ stops under the Q4 2020 lows into an area of significant accumulation.

The closest resistance begins near $0.4583. This level has confluence with the 9 EMA and a brief consolidation before May 11’s spike downward.

A more significant rally might find resistance near $0.5140. This level is inefficiently traded and has confluence with the lows of last summer’s accumulation and the 18 EMA.

If the market becomes more bullish, $0.6146 may provide the next resistance. This level is slightly above the May monthly open, overlaps with multiple old lows and aligns with the 40 EMA.

2. Orion Protocol (ORN)

Orion ORN aims to solve the difficulties in performing profitable transactions associated with the lack of liquidity on the majority of crypto exchanges. This is the case for both centralised and decentralised exchanges. Orion’s solution to this is to aggregate exchanges’ order books into one simple-to-use-and-understand terminal. The Orion Protocol’s goal is to help users get the best returns out of their investments while also lowering the risks associated with using multiple exchanges.

ORN Price Analysis

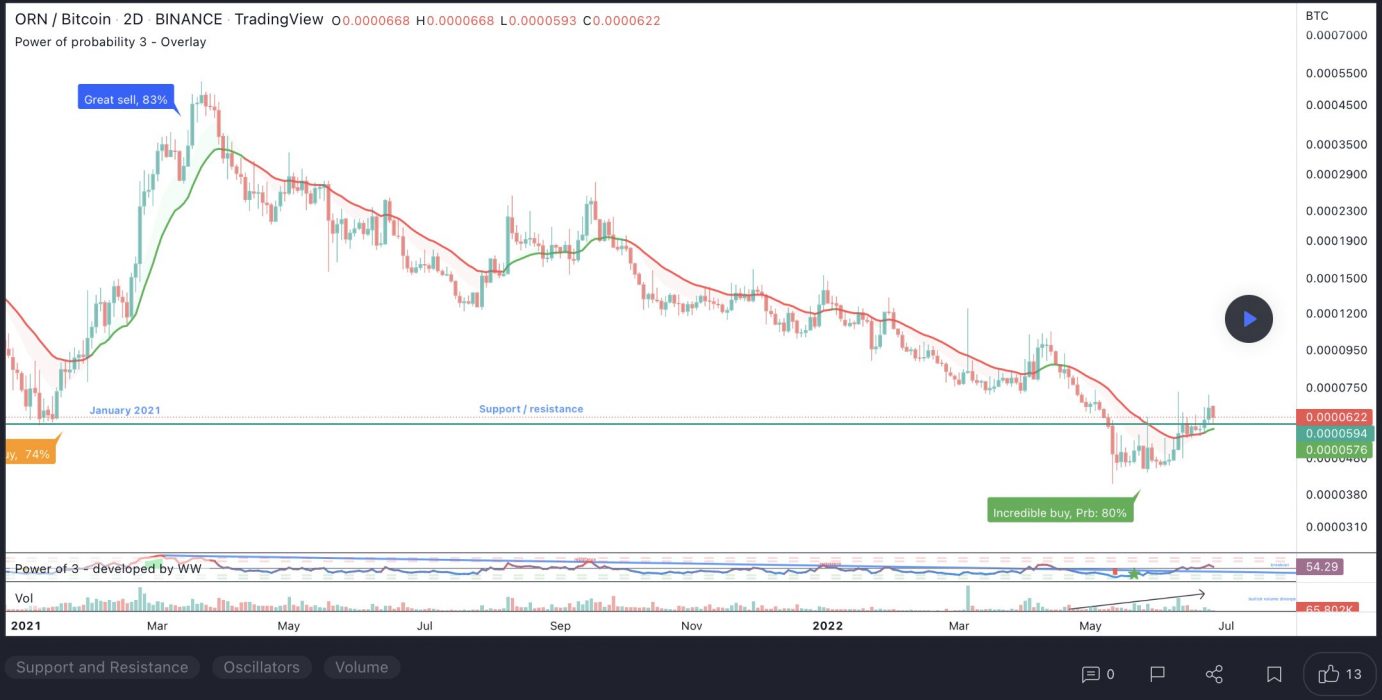
At the time of writing, ORN is ranked the 397th cryptocurrency globally and the current price is US$1.30. Let’s take a look at the chart below for price analysis:
Source: TradingView

After a 75% retracement from its April highs, ORN found a temporary low near $1.20. A recent move above $1.49 could be the first sign of a bullish shift – but could also signal a stop run before the next drop lower. 

If the market adopts a more bullish tone, the price could run through the most recent swing high. If this bounce occurs, it would likely find some resistance near $1.63, possibly reaching up to $1.85.

However, a move below the closest support near $1.25 makes stop runs on the swing lows near $1.21 and $1.18 likely. A confluence of several levels near $1.16 could provide a temporary bounce. Still, a sustained bearish market will likely target $1.12 and even $1.00.

3. Zilliqa (ZIL)

Zilliqa ZIL is a public, permissionless blockchain designed to offer high throughput with the ability to complete thousands of transactions per second. It seeks to solve the issue of blockchain scalability and speed by employing sharding as a second-layer scaling solution. The platform is home to many decentralised applications, and it also allows for staking and yield farming. The native utility token of Zilliqa, ZIL, is used to process transactions on the network and execute smart contracts.

ZIL Price Analysis

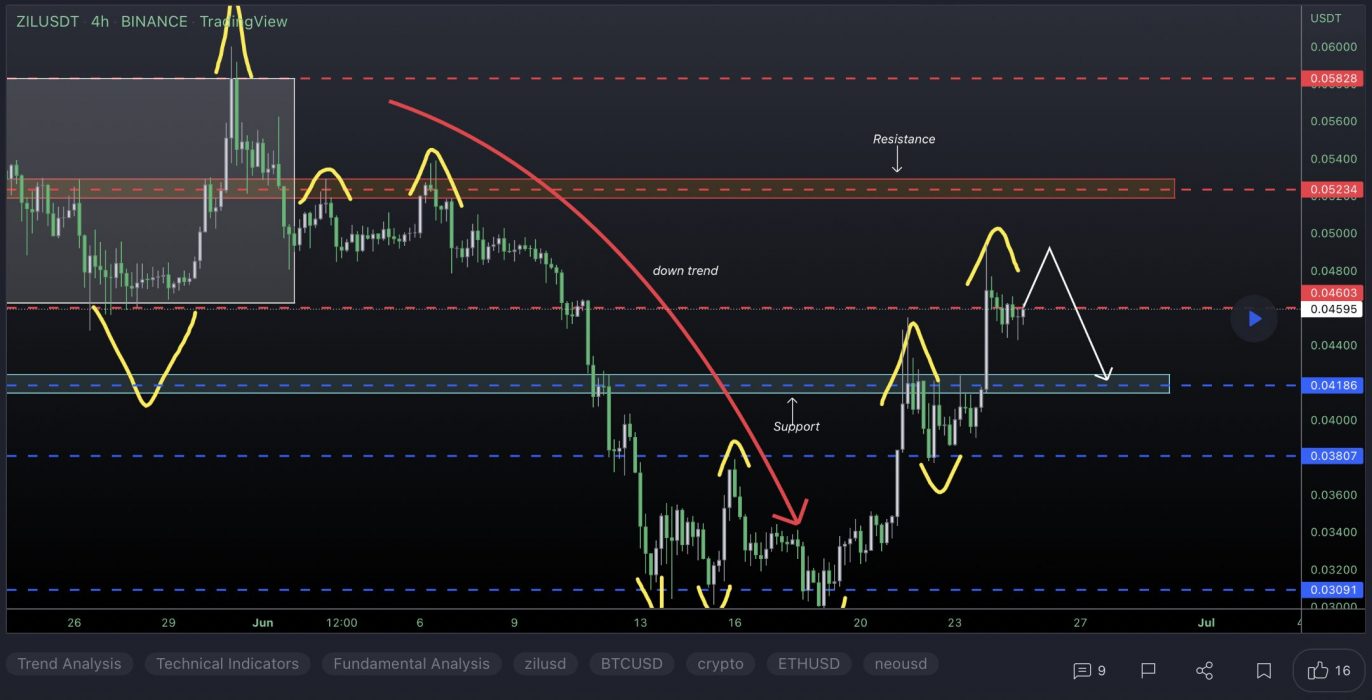
At the time of writing, ZIL is ranked the 67th cryptocurrency globally and the current price is US$0.04687. Let’s take a look at the chart below for price analysis:
Source: TradingView

ZIL‘s 85% drop found a low near $0.03368 before closing over a weekly high around $0.04682. This daily close over the high could signal a shift in market structure that might reach probable resistance near $0.06032.

A sustained bullish move may target the swing high at $0.05860. If this stop run occurs, a run beyond the high into probable resistance near $0.06384 and $0.06645 is possible.

Bulls could buy a retracement to possible support near $0.04258, just above the weekly open. A bearish turn in the marketplace may propel the price toward possible support near $0.03926. 

However, relatively equal lows near $0.03714 and $0.03524 provide an attractive target for bears if the market resumes its bearish trend. A run on these lows might find support between $0.03315 and $0.03069.

Learn How to Trade Live!

Join Dave and The Crypto Den Crew and they’ll show you live on a webinar how to take your crypto trading to the next level.

Where to Buy or Trade Altcoins?

These coins have high liquidity on Binance Exchange, so that could help with trading on AUD/USDT/BTC pairs. And if you’re looking at buying and HODLing cryptos, then Swyftx Exchange is an easy-to-use popular choice in Australia.

Categories
Crypto News Filecoin HedgeTrade Market Analysis Oasis Network Siacoin

Top 3 Coins to Watch Today: ROSE, FIL, SC – June 24 Trading Analysis

Let’s take a closer look at today’s altcoins showing breakout signals. We’ll explain what the coin is, then dive into the trading charts and provide some analysis to help you decide.

1. Oasis Network (ROSE)

The Oasis Network ROSE is the first privacy-enabled blockchain platform for open finance and a responsible data economy. Combined with its high throughput and secure architecture, the Oasis Network is able to power private, scalable DeFi, revolutionising Open Finance and expanding it beyond traders and early adopters to a mass market. Its unique privacy features can not only redefine DeFi but also create a new type of digital asset called Tokenised Data that can enable users to take control of the data they generate and earn rewards for staking it with applications – creating the first-ever responsible data economy.

ROSE Price Analysis

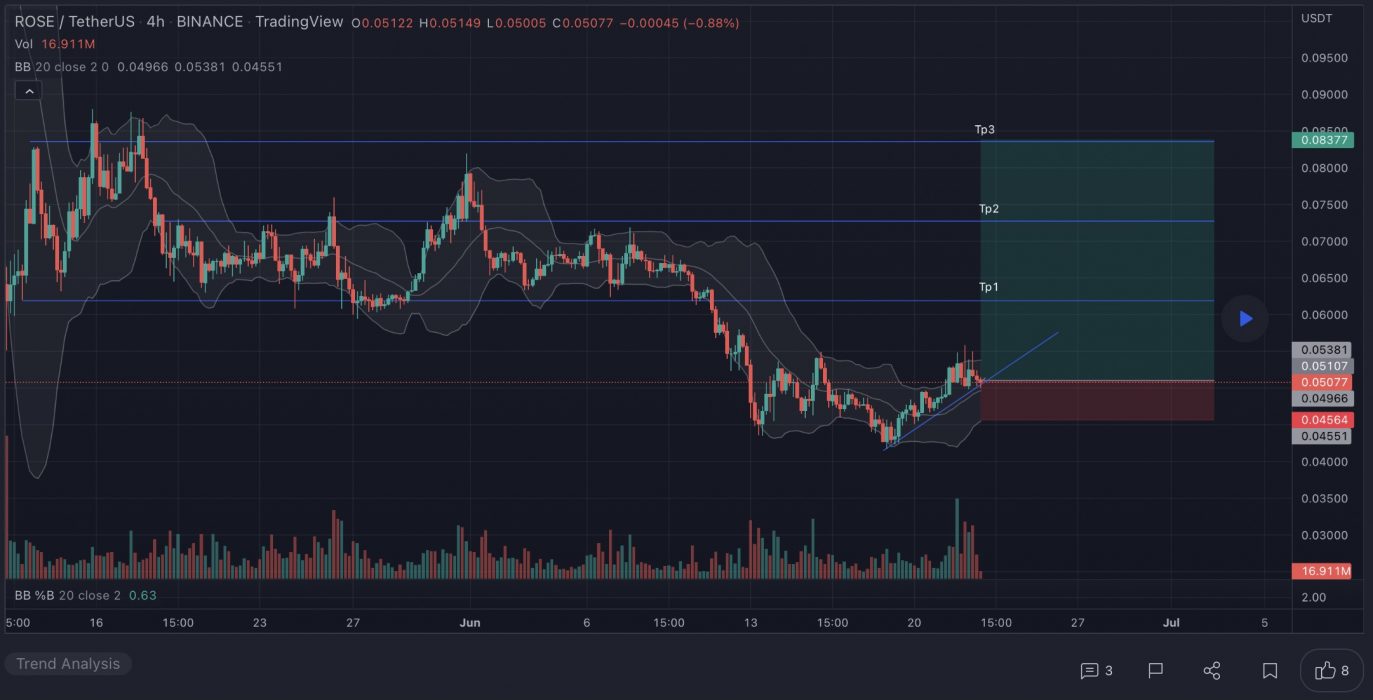
At the time of writing, ROSE is ranked the 107th cryptocurrency globally and the current price is US$0.05164. Let’s take a look at the chart below for price analysis:

Source: TradingView

ROSE climbed 42% from its Q1 low, then dropped nearly 75% into support last week.

The price is currently testing this support again, near $0.04690. It may provide support again and has confluence with the 61.8% and 78.6% retracements.

Resistance begins just above, at $0.05837. This inefficiently traded area, which reaches slightly beyond $0.06462, contains the monthly open, a bearish market structure break on the daily chart, and the 9, 18 and 40 EMAs. 

These confluences often provide strong resistance. Since this resistance is close to the $0.07190 support, the price may enter consolidation before breaking out to the next move.

If the price breaks this resistance, bulls could eye an area of old rejection, near $0.07562, as their next target. Continuation through this level may target another area of bearish rejection on the weekly chart, near the 27% extension from $0.07895 to $0.08065.

A more significant bearish turn in the market may reach for bulls’ stops under the Q2 lows, down to an area of old support in an inefficiently traded area between $0.04341 and $0.03917.

2. Filecoin (FIL)

Filecoin FIL is a decentralised storage system that aims to “store humanity’s most important information”. The project was first described back in 2014 as an incentive layer for the Interplanetary File System (IPFS), a peer-to-peer storage network. Filecoin is an open protocol backed by a blockchain that records commitments made by the network’s participants, with transactions using FIL, the blockchain’s native currency. The blockchain is based on both proof-of-replication and proof-of-spacetime.

FIL Price Analysis

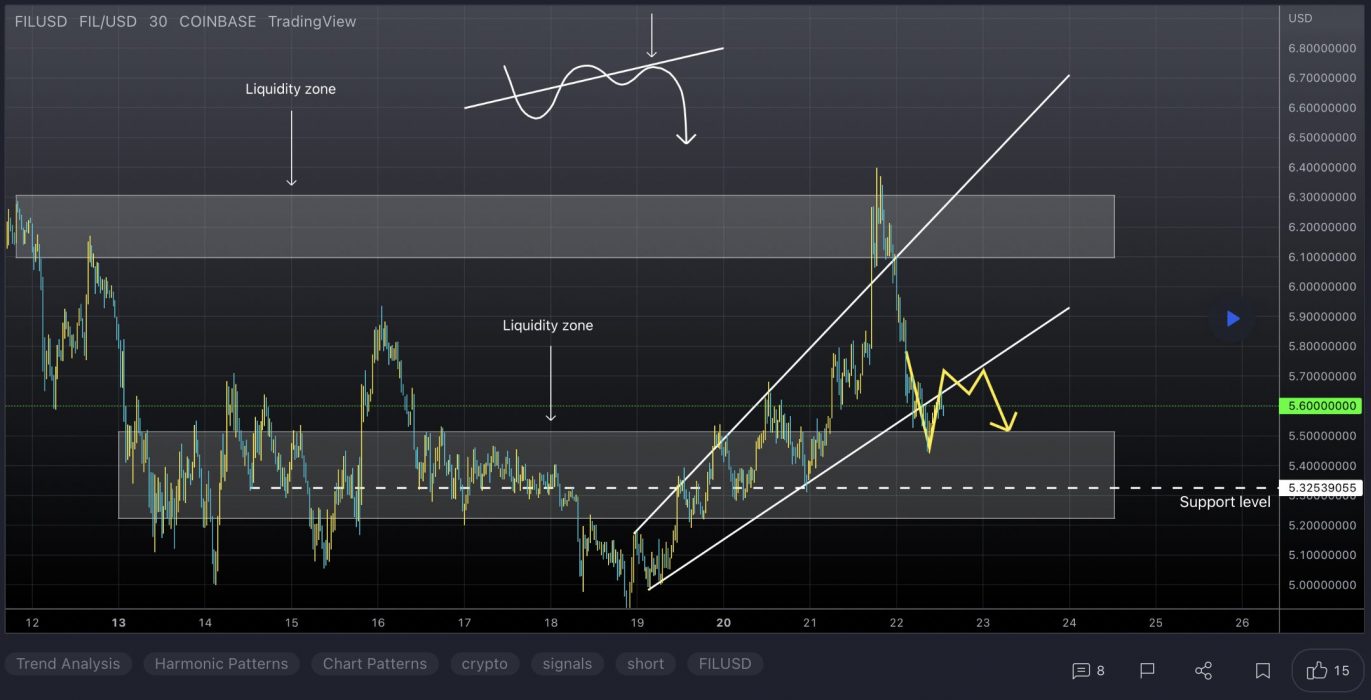
At the time of writing, FIL is ranked the 38th cryptocurrency globally and the current price is US$5.68. Let’s take a look at the chart below for price analysis:

Source: TradingView

FIL has dropped 77% from its early Q2 highs. It’s now 95% down from its March 2021 all-time high. 

The price is currently in a small consolidation range. This range’s lower lows suggest bearishness. 

A rally near $6.50 could set the stage for another move lower. This level would provide a run on bears’ stops above the last daily swing high and is above the June monthly open. 

A break through this level could reach between $7.60 and $8.35. This zone shows inefficient trading on the weekly and daily charts. It also contains the 40 EMA. Relatively equal highs at the bottom of this zone mark bears’ stops. These stops provide bulls with an attractive target.

Bulls should be careful, however. The price is trending lower, and the current market conditions are bearish. Yet a consolidation near $5.63 could provide at least short-term support. This consolidation followed the last drop lower.

Chaotic price action below this level makes precise levels impossible to determine. Still, bulls could look for support near old swing highs formed in late 2019 near $5.14. 

Slightly lower, an area near $4.63 could also cause the formation of a bullish setup. This area is around the midpoint of significant consolidation. It’s also near the origin of 2020’s rally.

3. Siacoin (SC)

Siacoin SC is the native utility token of Sia, a blockchain-based distributed, decentralised cloud storage platform. Sia acts as a secure, trustless marketplace for cloud storage in which users can lease access to their unused storage space. Agreements and transactions are enforced with smart contracts, and Siacoin is the medium of exchange for paying for storage on the network. The main goal of the project is to become the “backbone storage layer of the internet”.

SC Price Analysis

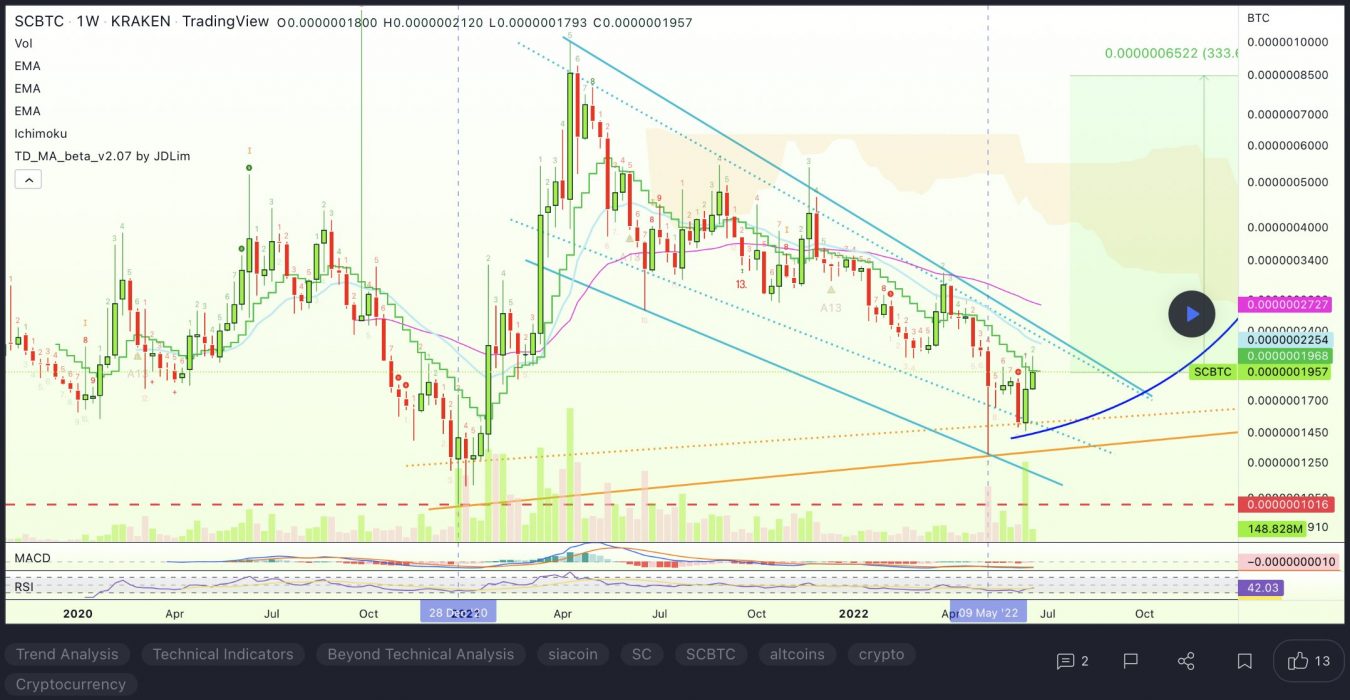
At the time of writing, SC is ranked the 122nd cryptocurrency globally and the current price is US$0.003962. Let’s take a look at the chart below for price analysis:

Source: TradingView

After a 72% decline from April, SC has ranged between $0.003723 and $0.005165.

The recent rally is approaching probable resistance near $0.004930 but could be aiming for stops above the relatively equal highs near $0.005430. Continuation of the bullish move could target the daily gap near $0.006124.

Aggressive bulls might add to positions near $0.003640 and $0.003492. Price action near $0.003272 may be more likely to provide support – if the price reaches it – during any retracements.

Relatively equal lows clustered around $0.003043 seem likely to be swept if the bearish trend resumes. If this move occurs, the price might find support at the significant higher-timeframe level near $0.002675.

Learn How to Trade Live!

Join Dave and The Crypto Den Crew and they’ll show you live on a webinar how to take your crypto trading to the next level.

Where to Buy or Trade Altcoins?

These coins have high liquidity on Binance Exchange, so that could help with trading on AUD/USDT/BTC pairs. And if you’re looking at buying and HODLing cryptos, then Swyftx Exchange is an easy-to-use popular choice in Australia.

Categories
Compound Crypto News Kucoin Market Analysis NEAR Protocol Trading

Top 3 Coins to Watch Today: KCS, NEAR, COMP – June 23 Trading Analysis

Let’s take a closer look at today’s altcoins showing breakout signals. We’ll explain what the coin is, then dive into the trading charts and provide some analysis to help you decide.

1. KuCoin Token (KCS)

KCS is the native token of KuCoin, launched in 2017 as a profit-sharing token that allows traders to draw value from the exchange. It was issued as an ERC-20 token running on the Ethereum network and was supported by most Ethereum wallets. The total supply of KCS was set at 200 million, and there is a planned buyback and burn until just 100 million KCS remain. Sooner or later, as the KuCoin decentralised trading solution goes live, KCS will be the native asset of KuCoin’s decentralised financial services as well as the governance token of the KuCoin community in the future.

KCS Price Analysis

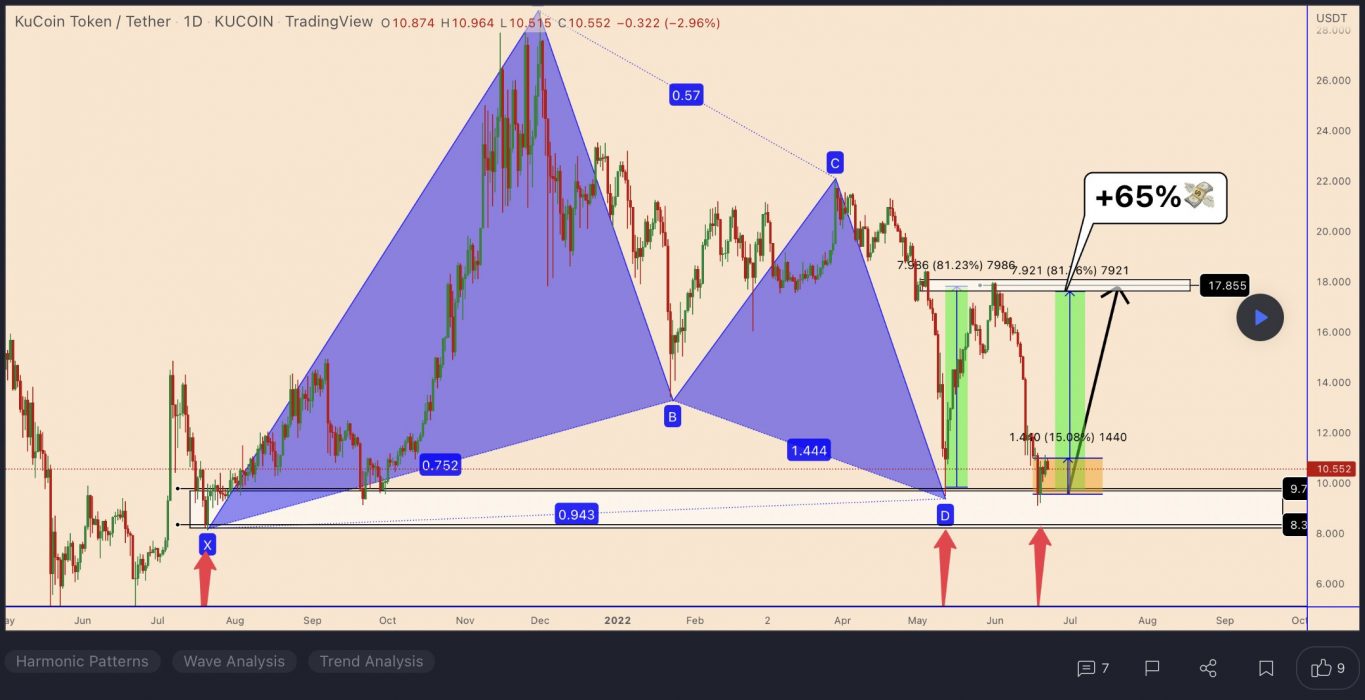
At the time of writing, KCS is ranked the 46th cryptocurrency globally and the current price is US$10.53. Let’s take a look at the chart below for price analysis:

Source: TradingView

KCS has been trading through a massive range during Q2, with the price showing mild bullishness from last week.

Bulls bought near $9.50. The weekly level and daily gap near $10.23 could prompt buyers to step in again as the price challenges the swing high and resistance around $13.50. A strong move and acceptance above this level may reach for the swing highs at $14.75 and $15.66, which mark another area of resistance.

However, rejection from the current area may send the price down to retest support near $10.00. Relatively equal lows around $9.78 provide a rich target for a stop run. Sustained bearishness may reach the low near $8.90 and possibly as low as $7.14 into higher-timeframe support.

2. Near Protocol (NEAR)

NEAR Protocol is a decentralised application platform designed to make apps usable on the web. The network runs on a Proof-of-Stake (PoS) consensus mechanism called Nightshade, which aims to offer scalability and stable fees. NEAR uses human-readable account names, unlike the cryptographic wallet addresses common to Ethereum. NEAR also introduces unique solutions to scaling problems and has its own consensus mechanism, called “Doomslug”.

NEAR Price Analysis

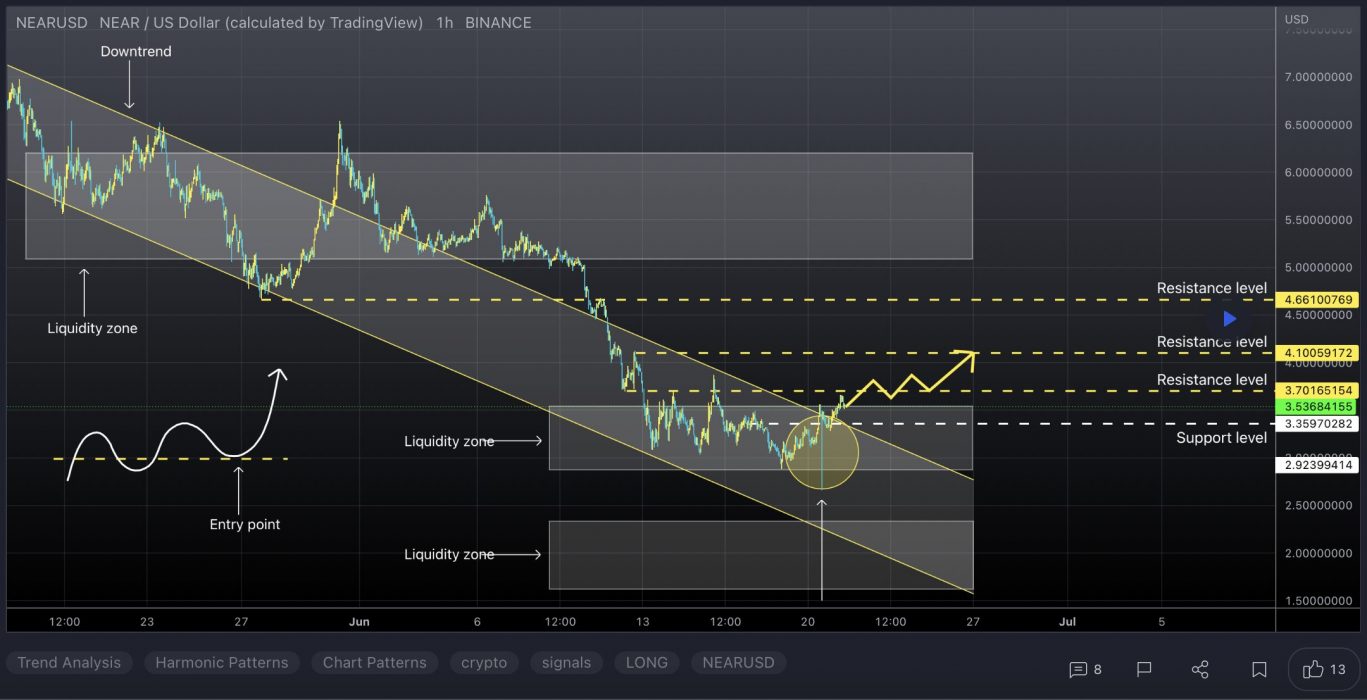
At the time of writing, NEAR is ranked the 25th cryptocurrency globally and the current price is US$3.36. Let’s take a look at the chart below for price analysis:

Source: TradingView

During Q2, NEAR has retraced 70% from its highs to support at the retracement of around $3.10.

The price shifted market structure to run to the consolidation lows near $3.40, just under the monthly open. A continued bearish trend in the market may create support just below, between $3.00 and $2.70.  

On the other hand, if the current resistance breaks, the price might find resistance near $4.83 and $5.14, whereas mid-Q2 buyers may still be trapped in longs.

3. Compound (COMP)

Compound COMP is a DeFi lending protocol that allows users to earn interest on their cryptocurrencies by depositing them into one of several pools supported by the platform. When a user deposits tokens to a Compound pool, they receive cTokens in return. These cTokens represent the individual’s stake in the pool and can be used to redeem the underlying cryptocurrency initially deposited into the pool at any time. These COMP tokens can be bought from third-party exchanges or can be earned by interacting with the Compound protocol, such as by depositing assets or taking out a loan.

COMP Price Analysis

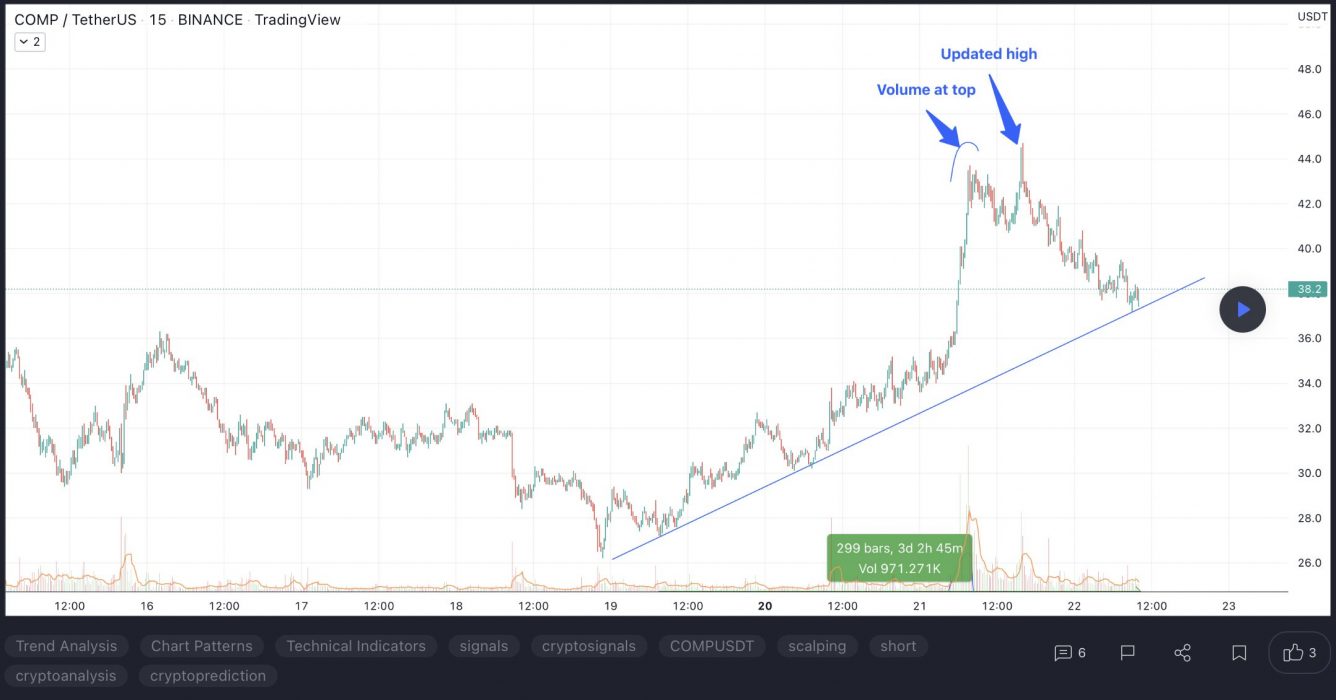
At the time of writing, COMP is ranked the 99th cryptocurrency globally and the current price is US$39.29. Let’s take a look at the chart below for price analysis:

Source: TradingView

After rallying over 55% from its Q1 low, COMP is encountering resistance near $57.43.

This resistance and the monthly open at $40.13 currently have the price trapped. The swing high and resistance near $49.27 provide a likely target before any major bearish market shift, with continuation through this resistance possibly reaching for short stops and resistance near $62.55.

The daily gap at $35.12 could provide support, while the area beginning near $30.49 could see more substantial interest from the bulls. A longer-term bearish shift in the marketplace will likely reach the relatively equal lows near $28.48, possibly finding a floor at possible support beginning near $24.71.

Learn How to Trade Live!

Join Dave and The Crypto Den Crew and they’ll show you live on a webinar how to take your crypto trading to the next level.

Where to Buy or Trade Altcoins?

These coins have high liquidity on Binance Exchange, so that could help with trading on AUD/USDT/BTC pairs. And if you’re looking at buying and HODLing cryptos, then Swyftx Exchange is an easy-to-use popular choice in Australia.
Categories
Crypto News Harmony Horizen Market Analysis SushiSwap Trading

Top 3 Coins to Watch Today: ZEN, SUSHI, ONE – June 22 Trading Analysis

Let’s take a closer look at today’s altcoins showing breakout signals. We’ll explain what the coin is, then dive into the trading charts and provide some analysis to help you decide.

1. Horizen (ZEN)

Horizen ZEN is an interoperable blockchain system, supported by a decentralised node infrastructure. Its sidechain platform focuses on scalable data privacy, and as such enables businesses as well as developers to build private or public blockchains using the unique sidechain technology known as Zendoo. Horizen claims to be completely decentralised, fully customisable with privacy features, and supports low costs associated with building blockchains with configurable revenue models and an unlimited number of tokens and digital assets.

ZEN Price Analysis

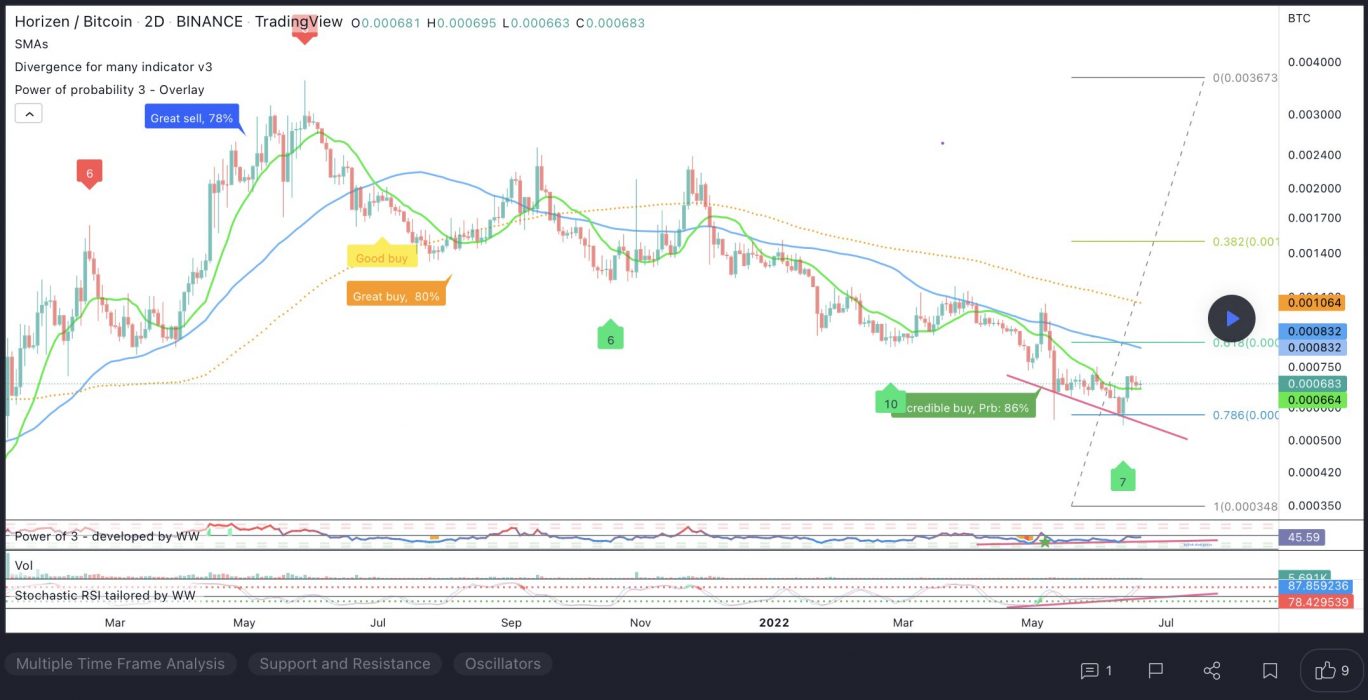
At the time of writing, ZEN is ranked the 135th cryptocurrency globally and the current price is US$14.90. Let’s take a look at the chart below for price analysis:

Source: TradingView

ZEN saw an energetic run during Q1, climbing approximately 75% before cooling off into resistance beginning near $31.85 pinned down last month’s attempt to rally, which is likely to retest possible support near $16.14.

A deeper marketwide retracement could take out the relatively equal lows below the weekly open and support near $14.23. This move may offer entries near probable support between $13.47 and $11.78.

However, more bullish market conditions may prompt a rally to the relatively equal highs near $17.67 into resistance beginning at $21.46. If the price reaches this level, the last high at $24.58 gives the next likely target before price discovery begins.

2. SushiSwap (SUSHI)

SushiSwap SUSHI is an example of an automated market maker (AMM). An increasingly popular tool among cryptocurrency users, AMMs are decentralised exchanges that use smart contracts to create markets for any given pair of tokens. SushiSwap aims to diversify the AMM market and also add features not previously present on Uniswap, such as increased rewards for network participants via its in-house token, SUSHI.

SUSHI Price Analysis

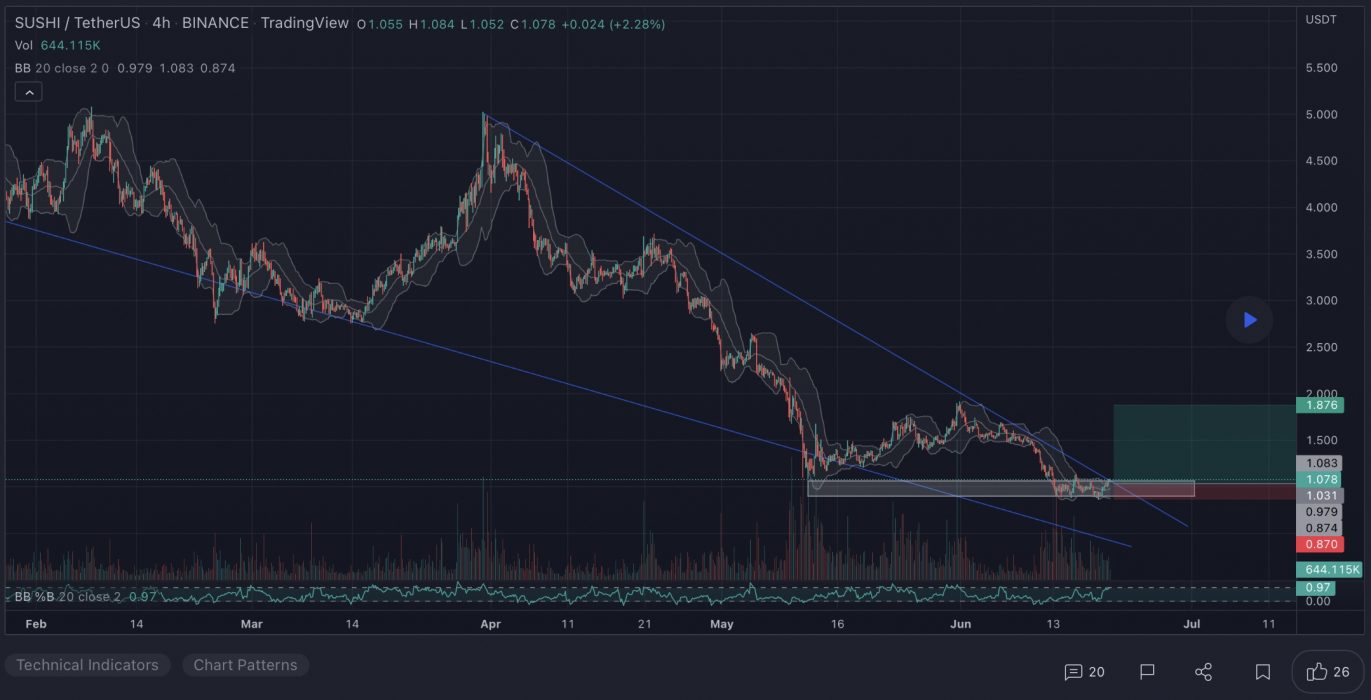
At the time of writing, SUSHI is ranked the 145th cryptocurrency globally and the current price is US$1.20. Let’s take a look at the chart below for price analysis:

Source: TradingView

After retracing nearly 80% from its Q1 highs, SUSHI set a low near $0.9210 as it formed its current range.

Last week, the price swept highs near $1.37, which now also marks the previous monthly high. Relatively equal daily highs near $1.43 provide a reasonable target, although resistance beginning near $1.55 could cap the move. A break of this resistance is likely to target the swing high near $1.64 into higher-timeframe resistance beginning near $1.72.

The current area near $1.20 could provide support, although bulls may be more likely to buy around the price fractal near $1.14 if a retracement reaches this level. A break of this area could continue down to sweep the low near $1.00 into possible support beginning near $0.8702.

3. Harmony (ONE)

Harmony ONE is a blockchain platform designed to facilitate the creation and use of decentralised applications (DApps). The network aims to innovate the way decentralised applications work by focusing on random state sharding, which allows creating blocks in seconds. Harmony was expected to introduce cross-shard contracts and a cross-chain infrastructure by the end of 2021.

ONE Price Analysis

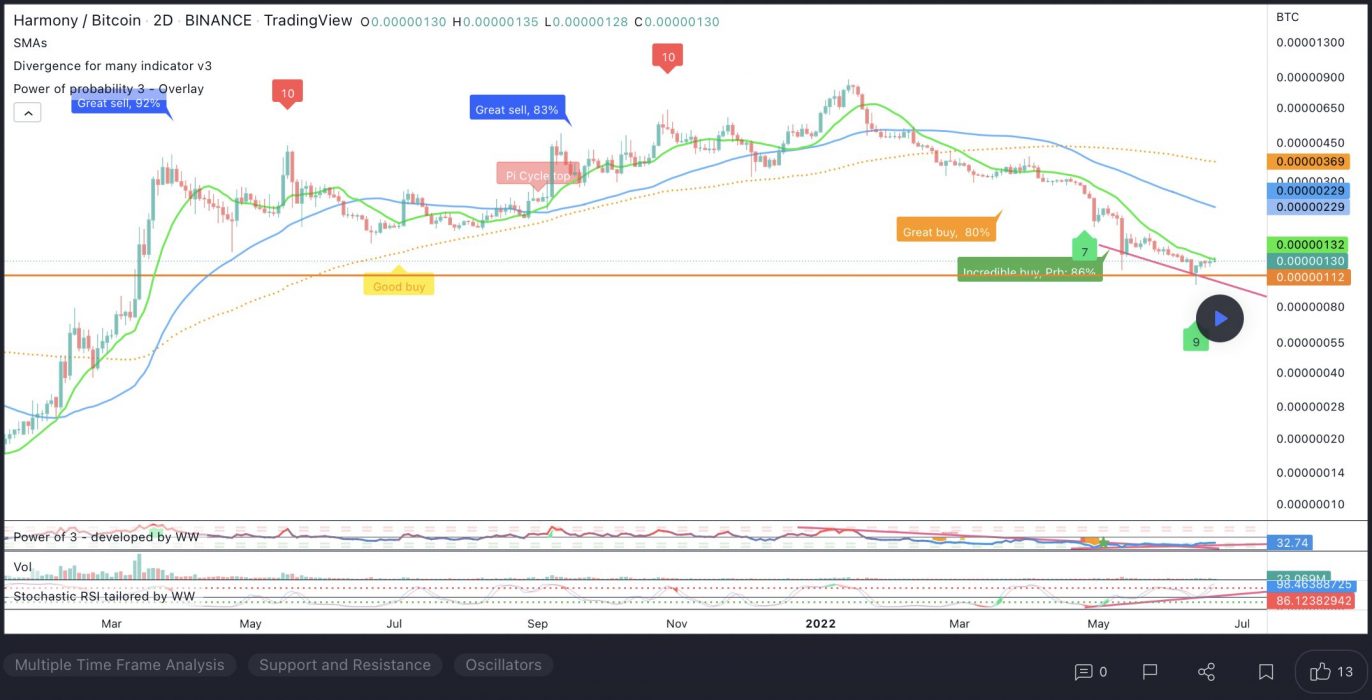
At the time of writing, ONE is ranked the 89th cryptocurrency globally and the current price is US$0.02878. Let’s take a look at the chart below for price analysis:

Source: TradingView

ONE bulls have had to endure a 79% drop since early Q2 until the price set a low and began a range in June.

Currently, the price is aggressively moving toward possible resistance, beginning near $0.03621. Stops above the swing high at $0.04135 might be the target before a downwards retracement. Multiple old lows mark this resistance, which is near the 78.6% retracement level of a recent significant bearish swing.

If the price continues through this high, it could be reaching for an inefficient area near $0.04472. Moving to this level would run bears’ stops above the swing high at the same level. A more substantial rally might reach an old swing high and inefficiently traded area between $0.04875 and $0.05038, which surrounds the yearly open.

If the price stays above Monday’s low of $0.02695, this price could support a run above the $0.02935 swing high. Just below, at $0.02554, bulls might eye the consolidation high as more substantial support. This zone contains the 9 and 40 EMAs.

A deeper retracement might retest the accumulation area between $0.02425 and $0.02280. If this level breaks, bears may be targeting an inefficiently traded area on higher timeframes beginning near $0.01980. This area overlaps the 37% extension of a recent significant bearish swing.

Learn How to Trade Live!

Join Dave and The Crypto Den Crew and they’ll show you live on a webinar how to take your crypto trading to the next level.

Where to Buy or Trade Altcoins?

These coins have high liquidity on Binance Exchange, so that could help with trading on AUD/USDT/BTC pairs. And if you’re looking at buying and HODLing cryptos, then Swyftx Exchange is an easy-to-use popular choice in Australia.
Categories
Crypto News Market Analysis The Crypto Den

TradeRoom: Our Weekly Crypto Trades Analysis – Jun 20, 2022

Welcome to this weekly series from the TradeRoom. My name is Dave and I’m the founder of The Crypto Den, an Australian-based crypto trading and education community aiming to give you the knowledge to take your trading game to the next level.

Crypto Market Outlook

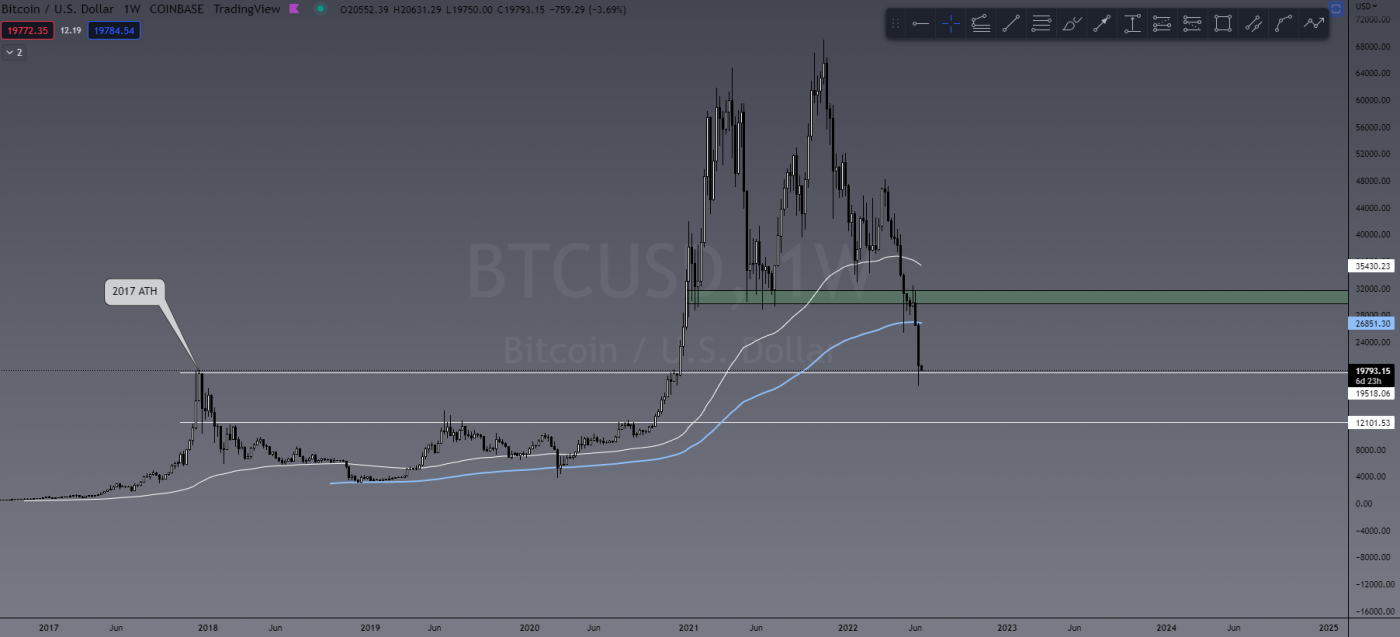
BTC finally retested the all-time high from 2017 and from here it’s very simple: we either confirm a new floor or break through it to US$12,000.

BTC weekly chart

For the US$20,000 level to be confirmed as the bottom, it takes more than just a few candles. We need to see solid market structure with volume behind it. This will take a little time for the market to produce, and could take days or even weeks.

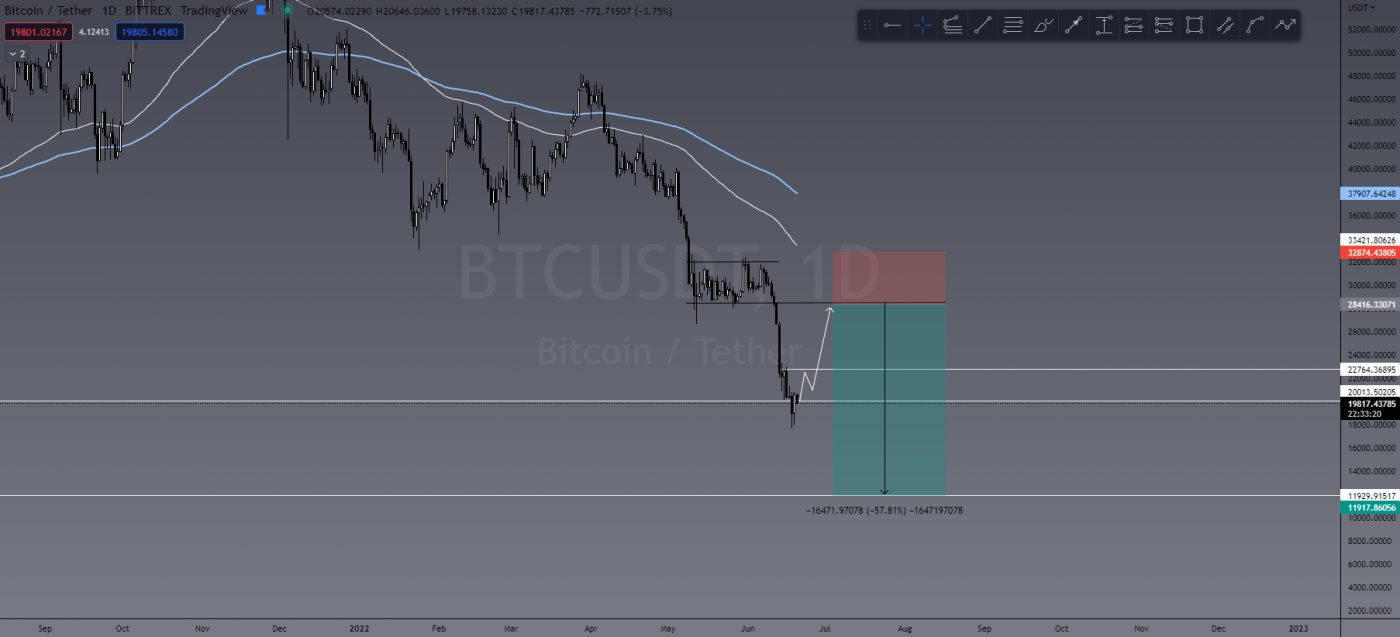
Once again, however, my opinion is we have more red to come (sorry! I know it’s been six months of bearish bias!). That said, we may see a relief rally to around US$28,000 and should that happen I plan to add to my short position and perhaps we visit US$12,000. If we don’t get a pullback in PA, then I’ll continue to ride my open shorts.

BTC trade action plan

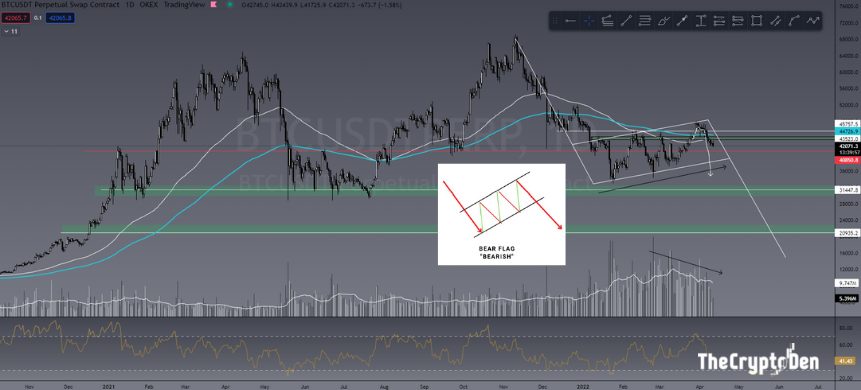
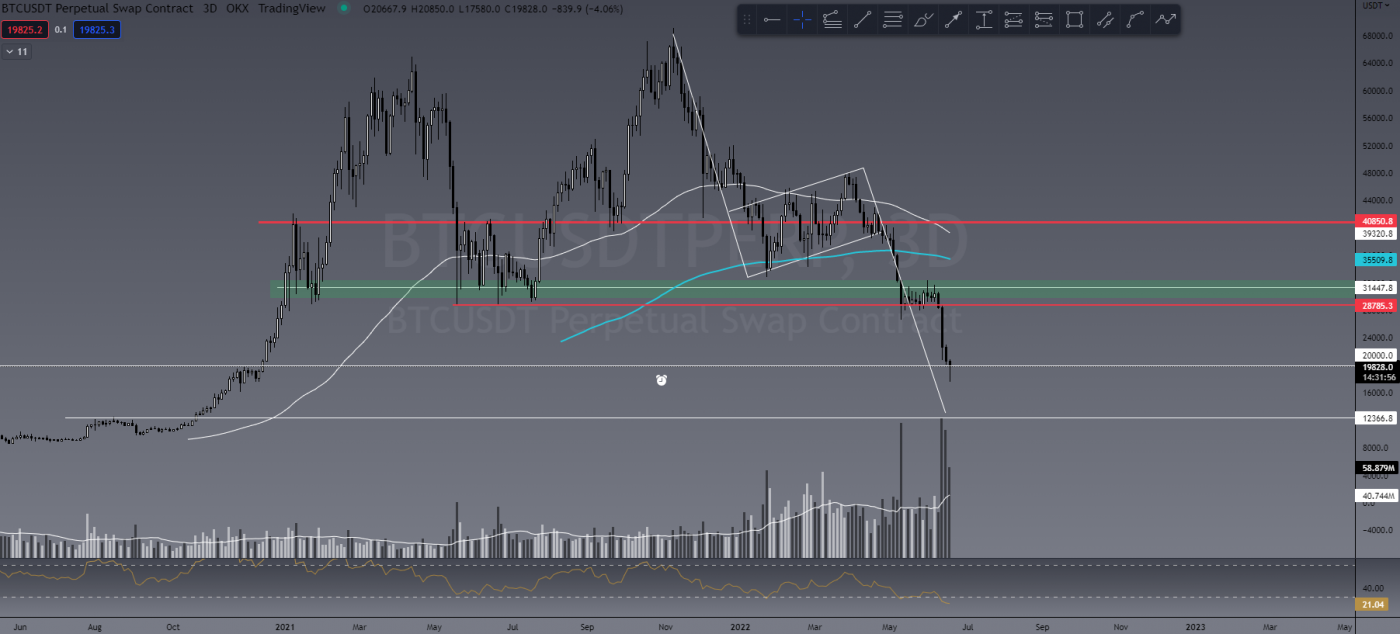
I still very much believe the entire bear flag I wrote about on April 11 will play out to the end at minimum. And dare I say we may even go further if the world economic climate doesn’t see a vast change in the coming months. How does buying BTC at US$6,000 sound?

Image from Apr 11 article
Current BTC 3D chart

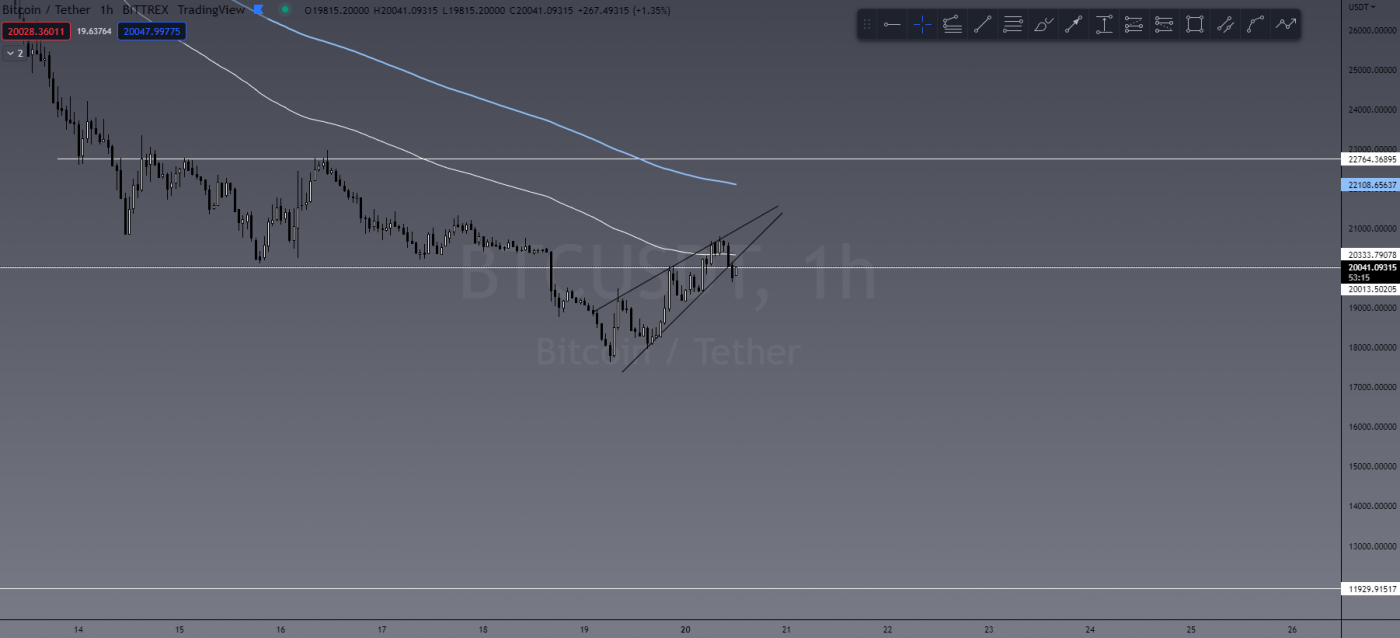
Even if we zoom in on the 1H charts for our day traders, we see a failure to break and hold above 100 EMA confluent with the peak of a 1H rising wedge (bearish candlestick pattern).


This Week’s Trades

Because I still have a bearish outlook on the market, entering long trades or buy orders on ALT coins is high-risk and short-lived. So instead, what I’m looking for is ALTs that have seen a significant pump and in turn yield higher percentage gains if the market dumps again. Remember, you can still make serious ROI in a downtrending market.

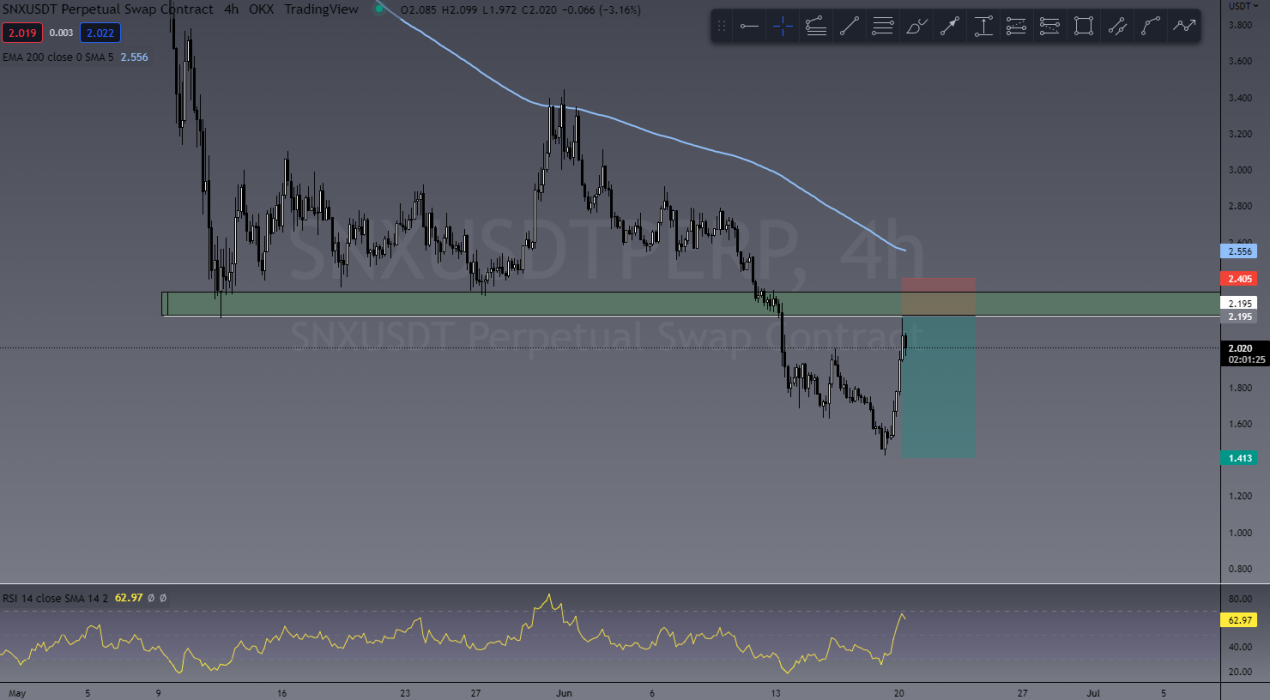
Setups similar to the below chart of SNX is what I’m looking for – a clear retest and rejection from a new level of resistance (previously support). There are a few ALT setups like this already in play.

To enter before BTC decides if it’ll dead-cat bounce has higher risk and far more aggressive entries. Best practice would be to “wait and see”. If BTC pulls back – find entries. If BTC doesn’t – do nothing.


Introducing TCD’s New Social Platform

The Crypto Den now has a FREE purpose-built social platform to share investment ideas, trade chat, connect with like-minded people, share info and more, without the censorship of Facebook. The platform is designed for those more focused on the investment/profitable side of the crypto world.


The Crypto Den was created in 2017 to help the rapidly growing crypto community learn and understand the fundamentals of digital currencies and how to trade them. 

Since then we have taught thousands of members the basics of technical analysis and trading strategies to further progress and perfect their trading abilities.

In the TradeRoom, you will be included in a supportive environment which encourages personal growth, education and community support.

It’s a place to share your trading ideas and follow other experienced traders’ feeds to help keep your finger on the pulse of such a volatile market!

Categories
Cardano Crypto News Internet Computer Market Analysis MXC Trading

Top 3 Coins to Watch Today: ADA, ICP, MXC – June 21 Trading Analysis

Let’s take a closer look at today’s altcoins showing breakout signals. We’ll explain what the coin is, then dive into the trading charts and provide some analysis to help you decide.

1. Cardano (ADA)

Cardano ADA is a proof-of-stake blockchain platform whose stated goal is to allow “changemakers, innovators, and visionaries” to bring about positive global change. The open-source project also aims to “redistribute power from unaccountable structures to the margins to individuals”, helping to create a society that is more secure, transparent, and fair. Cardano is used by agricultural companies to track fresh produce from field to fork, while other products built on the platform allow educational credentials to be stored in a tamper-proof way, and retailers to clamp down on counterfeit goods.

ADA Price Analysis

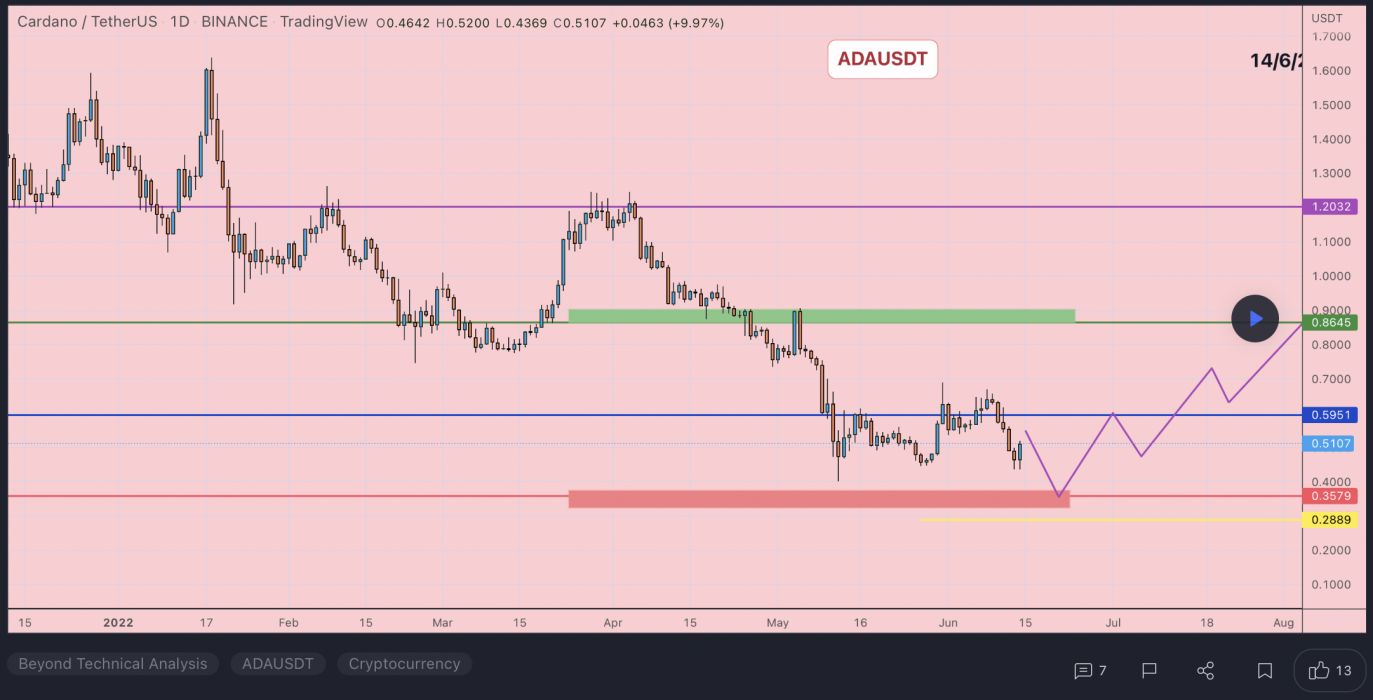
At the time of writing, ADA is ranked the 7th cryptocurrency globally and the current price is US$0.4913. Let’s take a look at the chart below for price analysis:

Source: TradingView

From its March high to early May, ADA dropped nearly 68% before finding support near $0.4549. The price has been consolidating since it set this low and is currently testing support near $0.4549. This level has held as support despite the larger market’s sharp downturn since mid-June.

It’s reasonable to expect the price to briefly drop through this level to run bulls’ stops below the swing lows at $0.4206 and $0.4019 before any potential rally. If so, an old accumulation and inefficiently traded area on the weekly chart near $0.3972 could provide support.

If this region holds as support, bulls might find the first resistance near $0.5610. Here, the 40 EMA and an inefficiently traded area converge in the upper half of the local range. 

A break of this resistance may retest resistance just above the June monthly open, near $0.6696. This level holds many bears’ stops, is near old broken support, and is inefficiently traded on the monthly and daily charts.

However, bulls should be cautious of the bearish market conditions and a potential hardfork delay. A break of the two closest support levels could lead to a much more significant drop near $0.2288. This level, near the 2021 yearly open, is inefficiently traded on the monthly and weekly charts.

2. Internet Computer (ICP)

The Internet Computer ICP is the world’s first blockchain that runs at web speed with unbounded capacity. It also represents the third major blockchain innovation, alongside Bitcoin and Ethereum – a blockchain computer that scales smart contract computation and data, runs them at web speed, processes and stores data efficiently, and provides powerful software frameworks to developers. By making this possible, the Internet Computer enables the complete reimagination of software, providing a revolutionary new way to build tokenised internet services, pan-industry platforms, decentralised financial systems, and even traditional enterprise systems and websites.

ICP Price Analysis

At the time of writing, ICP is ranked the 36th cryptocurrency globally and the current price is US$5.67. Let’s take a look at the chart below for price analysis:

Source: TradingView

ICP has dropped 53% from its most recent June high as it continues its nine-month downtrend.

The edge of the recent swing’s lower candle bodies could provide the closest support, near $5.15. This level overlaps with the 100% extension of June’s opening rally.

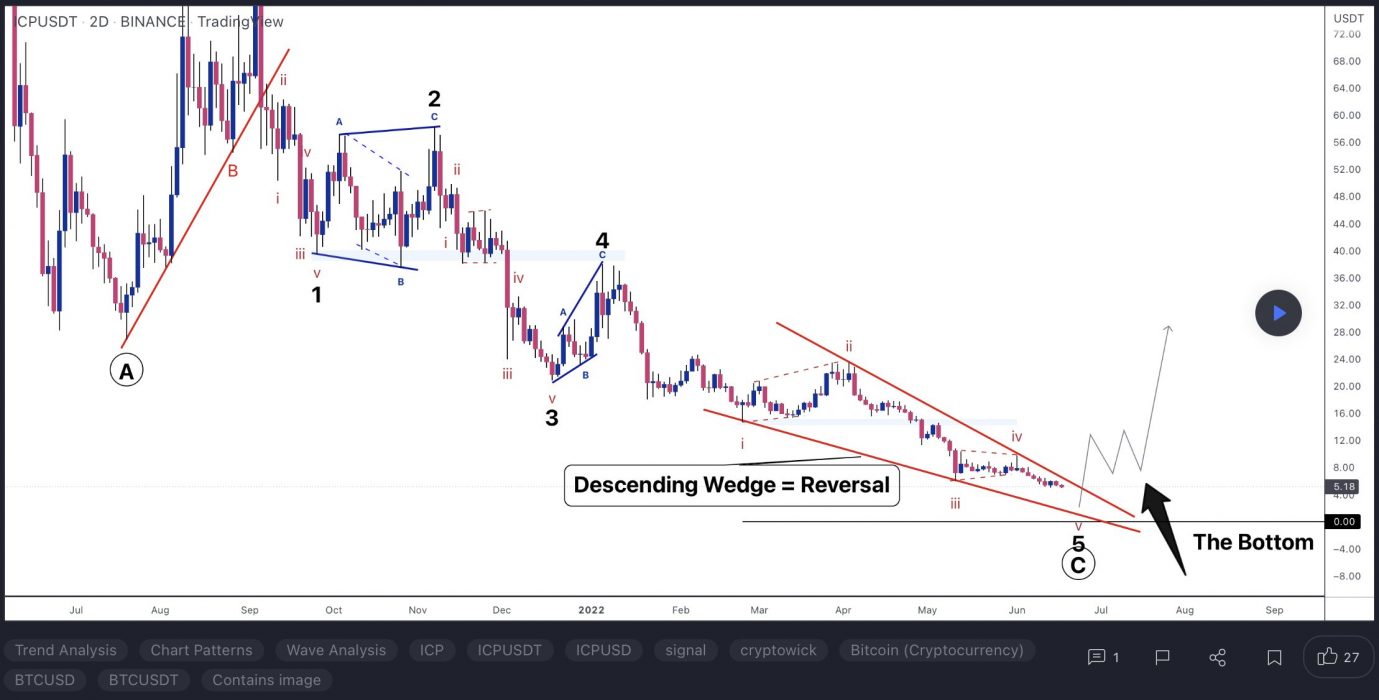
Currently, the price is testing possible resistance near $5.43. This level has confluence with the 9 EMA. It is unclear if it will hold as resistance, but it’s reasonable to anticipate a run above bears’ stops at $6.06.

If the price breaks through this resistance, it may find its next resistance near $6.59. This level is near the midpoint of May 12’s swing low and the midpoint of an inefficiently traded area on the weekly chart.

A rally this high may reach slightly higher, near $6.82. This area formed the base of the June opening rally, shows inefficient trading on the daily chart, and is at the low end of May’s accumulation range.

Below, there is no historical price action to suggest possible support. The next downside targets may be near $4.00 and $2.80. These approximate levels are near the 150% and 200% extensions of June’s opening rally.

3. Meta Connect (MXC)

Meta X Connect MXC is a utility token allowing for the increased frequency of data transactions and idiosyncratic data flows within the AI and blockchain markets. The MXProtocol ensures networks are created and connected via a decentralised and robust protocol using an interchain data market, encouraging participation via Proof of Participation (“PoP”) Mining. The mechanism also allows for the provisioning of any tangible smart Internet of Things (IoT) devices with minimal cost, creating a framework for data providers and receivers to produce their own GDPR-safe AI and blockchain NFTs.

MXC Price Analysis

At the time of writing, MXC is ranked the 132nd cryptocurrency globally and the current price is US$0.06589. Let’s take a look at the chart below for price analysis:

Source: TradingView

MXC bulls suffered a sharp 51.65% drop during the second week of May. Since then, the price has consolidated in the lower half of the range created by this drop.

A level near $0.06508 has been providing support on each recent retest. This level has confluence with the bottom of the candle bodies created in May’s significant swing low. It could continue to provide support for a run to or beyond the closest resistance.

Bulls may find their next resistance near $0.06938. Here, a recent swing high, an inefficiently traded area on the daily chart, and the 9 EMA could attract the price.

A break through this level may find its resistance in the upper half of the local range, near $0.07631. This level contains the 40 EMA and previously supported the price as it formed the base of late May and early June’s rally.

A significantly higher move could retest resistance near $0.09245. This level shows inefficient trading on the weekly and daily charts. It also provided support during March and April’s consolidation. A run to this level would sweep many bears’ stops above the swing high at $0.09245.

An eventual move below the 2022 yearly open into a zone from $0.05245 to $0.04329 is reasonable to expect. Moving to this zone would sweep bulls’ stops under two relatively equal major swing lows. This level also saw accumulation before December’s rally.

If the downtrend resumes, bears might next target possible support near $0.03428. This level is near the midpoint and lower half of 2021’s massive consolidation. It would also provide bears with a shot at bulls’ stops under the significant swing low at $0.03229. 

Learn How to Trade Live!

Join Dave and The Crypto Den Crew and they’ll show you live on a webinar how to take your crypto trading to the next level.

Where to Buy or Trade Altcoins?

These coins have high liquidity on Binance Exchange, so that could help with trading on AUD/USDT/BTC pairs. And if you’re looking at buying and HODLing cryptos, then Swyftx Exchange is an easy-to-use popular choice in Australia.
Categories
Crypto News Market Analysis Tezos Trading Uniswap VeChain

Top 3 Coins to Watch Today: UNI, XTZ, VET – June 20 Trading Analysis

Let’s take a closer look at today’s altcoins showing breakout signals. We’ll explain what the coin is, then dive into the trading charts and provide some analysis to help you decide.

1. Uniswap (UNI)

Uniswap UNI is a popular decentralised trading protocol known for its role in facilitating the automated trading of decentralised finance (DeFi) tokens. Uniswap aims to keep token trading automated and completely open to anyone who holds tokens while improving the efficiency of trading versus that on traditional exchanges. Uniswap creates more efficiency by solving liquidity issues with automated solutions, avoiding the problems that plagued the first decentralised exchanges.

UNI Price Analysis

At the time of writing, UNI is ranked the 21st cryptocurrency globally and the current price is US$4.00. Let’s take a look at the chart below for price analysis:

Source: TradingView

UNI‘s 70% retracement from its April highs set a low near $3.65 during its consolidation that began in early May.

Relatively equal highs near $4.46 could be the current target if the price breaks through resistance beginning near $4.97. Bullish continuation might reach through the next significant swing high near $5.26 into the daily gap near $5.47.

If bullish strength continues, the zones just below the monthly open near $5.88 and $6.11 could halt any retracement. 

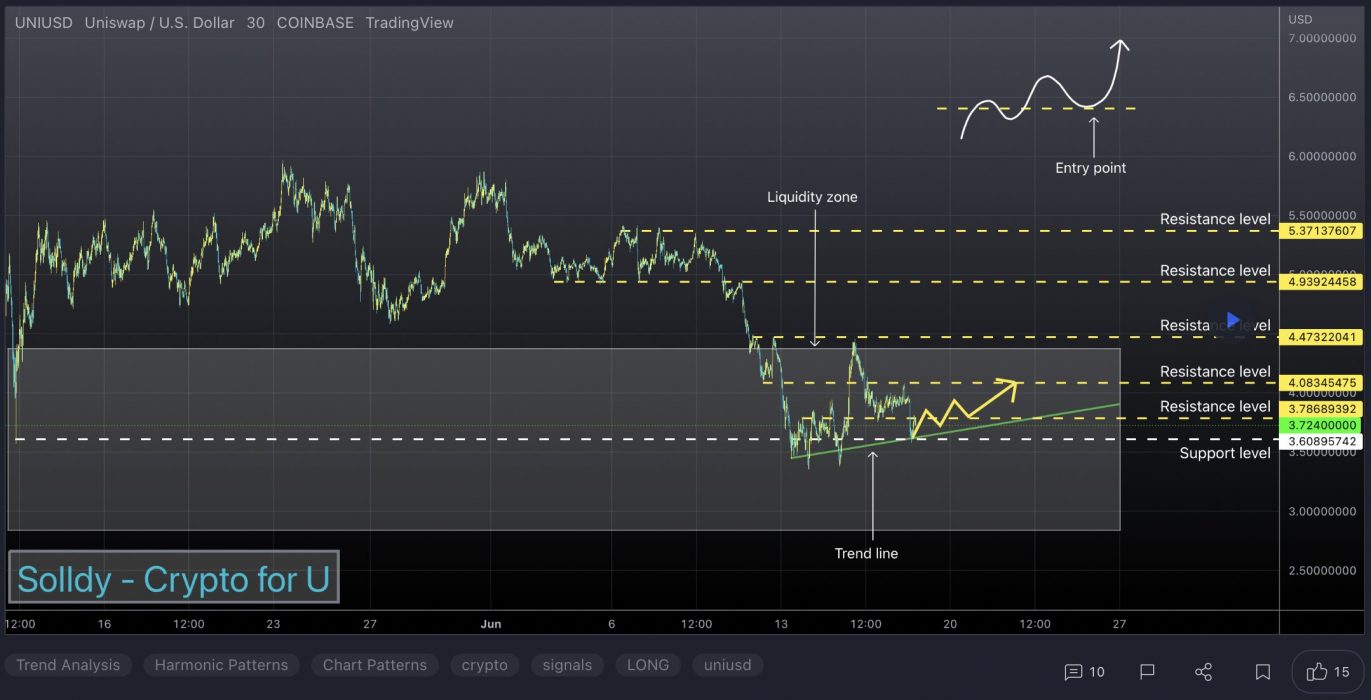
A bearish shift in the market might seek the relatively equal lows near $3.90 into possible support near $3.62. If this down move occurs, the swing low near $3.43 and possible support near $3.12 may be the primary objective.

2. Tezos (XTZ)

Tezos XTZ is a blockchain network that’s based on smart contracts in a way that’s not too dissimilar to Ethereum. However, there’s a big difference: Tezos aims to offer infrastructure that is more advanced – meaning it can evolve and improve over time without any danger of a hard fork. This is something both Bitcoin and Ethereum have suffered since they were created. People who hold XTZ can vote on proposals for protocol upgrades that have been put forward by Tezos developers.

XTZ Price Analysis

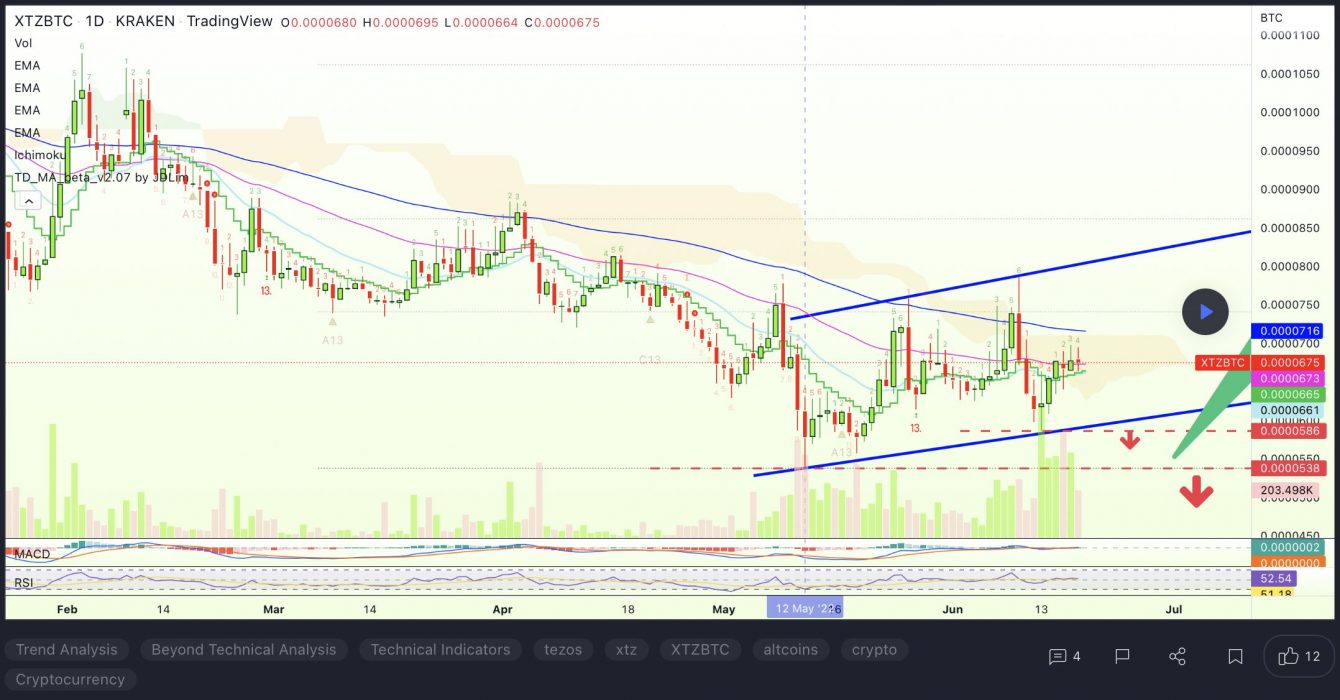
At the time of writing, XTZ is ranked the 38th cryptocurrency globally and the current price is US$1.32. Let’s take a look at the chart below for price analysis:

Source: TradingView

XTZ‘s 70% drop since April saw a second leg after last month’s market-wide drop ran the previous consolidation’s stops.

The level near $2.10 is providing some resistance. However, continuation through the monthly high at $2.18 is not out of the question. Aggressive bulls might bid in the current region near $1.40. 

If the price runs the recent swing low, bulls might bid in the gap near $1.20. A deeper retracement could reach near the early monthly level and a gap near $1.00. The region near $0.93 and $0.84 may also provide some support during a deeper retracement.

3. VeChain (VET)

VeChain VET is a blockchain-powered supply chain platform. VeChain aims to use distributed governance and Internet of Things (IoT) technology to create an ecosystem that solves some of the major problems with supply chain management. The platform uses two in-house tokens, VET and VTHO, to manage and create value based on its VeChainThor public blockchain. The idea is to boost the efficiency, traceability and transparency of supply chains while reducing costs and placing more control in the hands of individual users.

VET Price Analysis

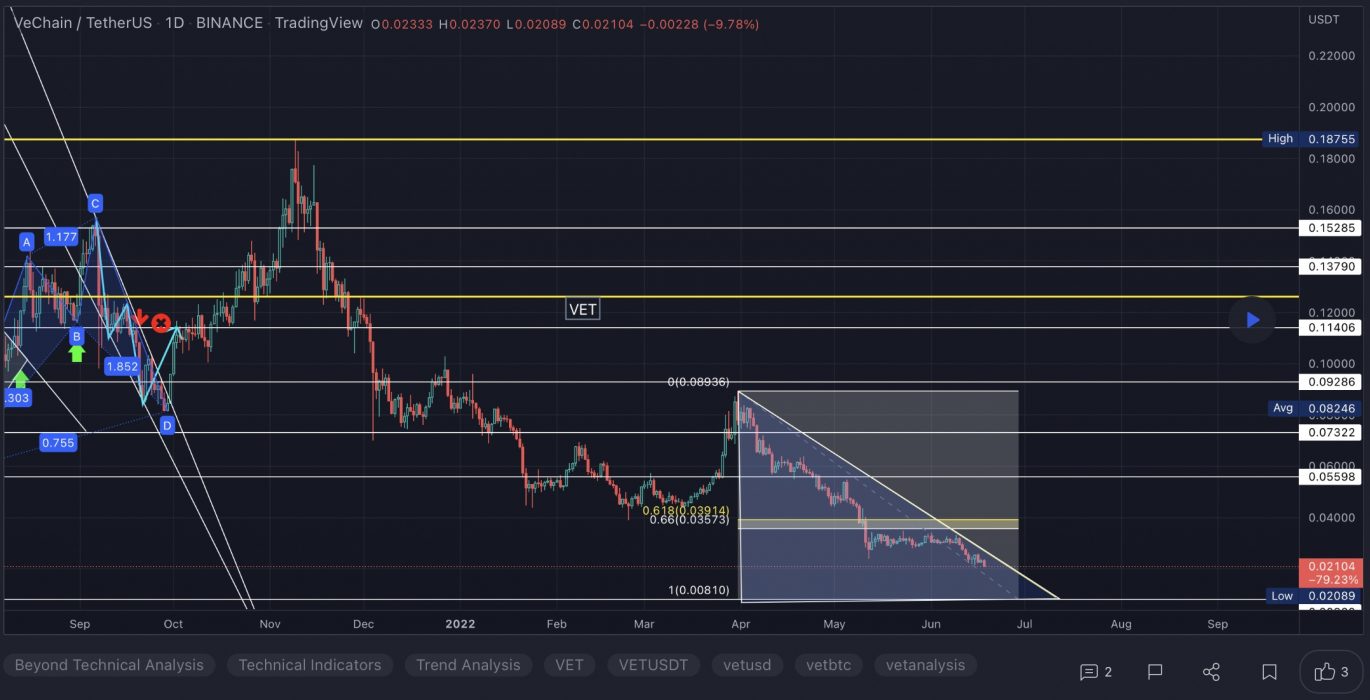
At the time of writing, VET is ranked the 31st cryptocurrency globally and the current price is US$0.02281. Let’s take a look at the chart below for price analysis:

Source: TradingView

VET‘s 50% move during late Q1 ran into resistance near $0.08120, at the 35% extension of the Q1 swing.

An old high and the 18 EMA have provided support near $0.02283 and may give support again on a retest. This area also has confluence with the 55% and 68.9% retracements of November’s swing.

Just below, near $0.02043, the 50.8% retracement of the current Q1 swing might also mark an area of support. 

If the market turns bearish, $0.01742 is unlikely to be revisited but could see interest from bulls during any deeper retracement.

An area near $0.02948, at the 50% extension of the last week swing, could see some profit-taking if bulls break the current resistance near $0.03478. Above, old consolidations near $0.03825 and $0.04372 may also provide some resistance before another round of price discovery.

Learn How to Trade Live!

Join Dave and The Crypto Den Crew and they’ll show you live on a webinar how to take your crypto trading to the next level.

Where to Buy or Trade Altcoins?

These coins have high liquidity on Binance Exchange, so that could help with trading on AUD/USDT/BTC pairs. And if you’re looking at buying and HODLing cryptos, then Swyftx Exchange is an easy-to-use popular choice in Australia.
Categories
Avalanche Crypto News Litecoin Market Analysis Ripple Trading

Top 3 Coins to Watch Today: LTC, AVAX, XRP – June 17 Trading Analysis

Let’s take a closer look at today’s altcoins showing breakout signals. We’ll explain what the coin is, then dive into the trading charts and provide some analysis to help you decide.

1. Litecoin (LTC)

Litecoin LTC is a cryptocurrency designed to provide fast, secure and low-cost payments by leveraging the unique properties of blockchain technology. The cryptocurrency was created based on the Bitcoin protocol but it differs in terms of the hashing algorithm used, hard cap, block transaction times, and a few other factors. Litecoin has a block time of just 2.5 minutes and extremely low transaction fees, making it suitable for micro-transactions and point-of-sale payments.

LTC Price Analysis

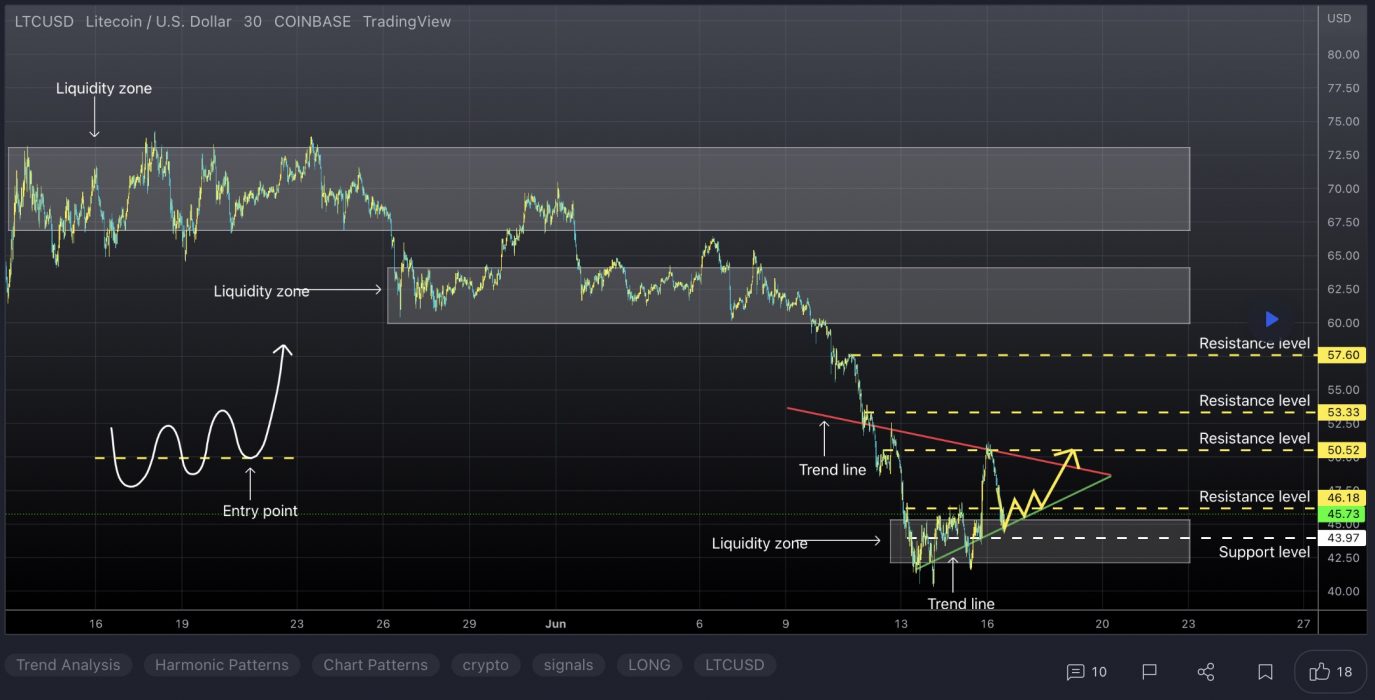
At the time of writing, LTC is ranked the 18th cryptocurrency globally and the current price is US$45.81. Let’s take a look at the chart below for price analysis:

Source: TradingView

After setting a low last week, LTC kicked off a with recovery trend to break the weekly highs.

The following 70% plummet found support near $40.36, sweeping under the 40 EMA into the 61.8% retracement level before bouncing to resistance beginning at $52.73.

This area could continue to provide resistance, possibly causing a retracement to the 9 EMA and 18 EMA near $60.12, where aggressive bulls might begin bidding. The level near $69.18, which has confluence with the 40 EMA, may see more interest from bulls loading up for an attempt on probable resistance beginning near $75.13. 

However, if Bitcoin continues its sideways trend, much lower prices could be seen. The old support near $40.18 could provide at least a short-term bounce. If this level fails, the old monthly lows near $37.23 may also give support and see the start of a new bullish cycle after retesting these support levels.

2. Avalanche (AVAX)

Avalanche AVAX is the fastest smart contracts platform in the blockchain industry, as measured by time-to-finality, and has the most validators securing its activity of any proof-of-stake protocol. Avalanche is also low-cost, and green. Any smart contract-enabled application can outperform its competition on Avalanche. AVAX is the native token of Avalanche. It is a hard-capped, scarce asset that is used to pay for fees, secure the platform through staking, and provide a basic unit of account between the multiple subnets created on Avalanche.

AVAX Price Analysis

At the time of writing, AVAX is ranked the 16th cryptocurrency globally and the current price is US$16.27. Let’s take a look at the chart below for price analysis:

Source: TradingView

AVAX‘s gains in Q2 ended with an almost 71% retracement as the rest of the altcoin market dropped from early this month. Bulls stepped in near the 62.8% retracement of Q2’s move, creating a consolidation that ended with the bullish impulse to resistance near $34.35.

With the 9, 18 and 40 EMAs stacked bullish and a bullish higher-timeframe trend, it’s reasonable to anticipate retracement to possible support before further bullish expansion. 

Near the 40 EMA, a broad zone from $19.15 to $17.45 could see interest from bulls before further expansion. Bears might capitalise on any sharp moves down in Bitcoin, aiming for possible support near the 75% retracement, at $16.70, and potentially lower to a higher-timeframe support zone between $14.42 and $13.80.

If the higher-timeframe recovery trend resumes and the current resistance near $22.35 breaks, the wicks near $26.84 and the new monthly highs may see profit-taking.

3. Ripple (XRP)

Ripple XRP is the currency that runs on a digital payment platform called RippleNet, on top of a distributed ledger database called XRP Ledger. While RippleNet is run by a company called Ripple, the XRP Ledger is open-source and not based on a blockchain, but rather the aforementioned distributed ledger database.

XRP Price Analysis

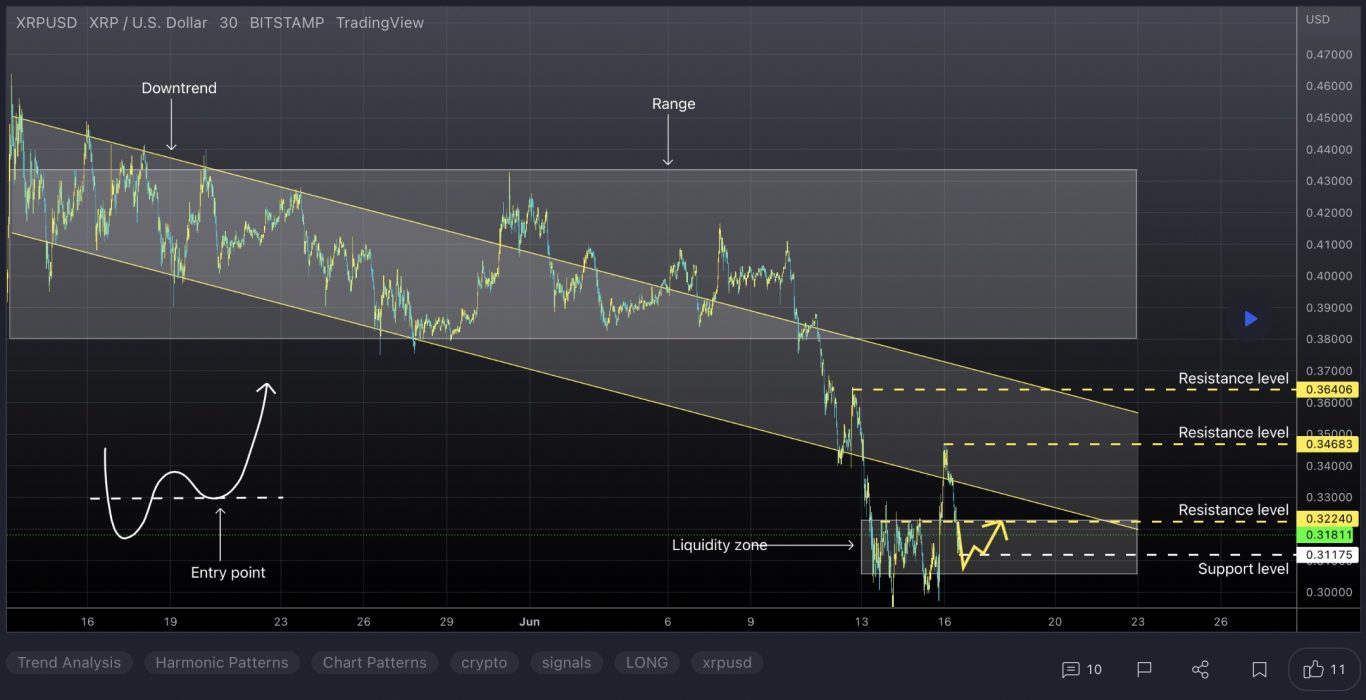
At the time of writing, XRP is ranked the 8th cryptocurrency globally and the current price is US$0.3199. Let’s take a look at the chart below for price analysis:

Source: TradingView

XRP printed some gains during Q1 and Q2 after moving sideways for the past few weeks. The price is in a downtrend, with the 9, 18 and 40 EMAs providing resistance on each attempt to rally.

However, bulls are showing some interest at the 80.6% retracement, near $0.3472. If this level breaks, a move into possible support – just below the lows near $0.2952 – seems likely.

If the price does rally through the swing high at $0.3855 – perhaps triggered by a sudden surge in Bitcoin – bulls might find some resistance at the 61.8% retracement level near $0.4150. 

Overlapping swing highs and lows near $0.4526 might provide the next target, where bears immediately forced the price down in late December.

More bullish market conditions could shift targets up near the midpoint of Q1’s consolidation, near $0.5017, where higher timeframes show an inefficiently traded zone.

Learn How to Trade Live!

Join Dave and The Crypto Den Crew and they’ll show you live on a webinar how to take your crypto trading to the next level.

Where to Buy or Trade Altcoins?

These coins have high liquidity on Binance Exchange, so that could help with trading on AUD/USDT/BTC pairs. And if you’re looking at buying and HODLing cryptos, then Swyftx Exchange is an easy-to-use popular choice in Australia.
Categories
Crypto News Fantom Market Analysis Polygon The Sandbox Trading

Top 3 Coins to Watch Today: MATIC, FTM, SAND – June 16 Trading Analysis

Let’s take a closer look at today’s altcoins showing breakout signals. We’ll explain what the coin is, then dive into the trading charts and provide some analysis to help you decide.

1. Polygon (MATIC)

Polygon MATIC is the first well-structured, easy-to-use platform for Ethereum scaling and infrastructure development. Its core component is Polygon SDK, a modular, flexible framework that supports building multiple types of applications. The MATIC token will continue to exist and will play an increasingly important role in securing the system and enabling governance.

MATIC Price Analysis

At the time of writing, MATIC is ranked the 20th cryptocurrency globally and the current price is US$0.3749. Let’s take a look at the chart below for price analysis:

Source: TradingView

Since its Q1 highs, MATIC has been in a steady bearish trend, retracing nearly 75%. The price found support near $0.3520, at the 65.8% retracement level.

Last week’s sharp impulse up might have marked the start of a new trend. If so, higher timeframes suggest that $0.3639, near the 65.8% retracement and the 9, 18 and 40 EMAs, may see interest from bulls. The price could reach lower, near $0.3320, and still find support.

Currently, the price is contesting a region between $0.3039 and $0.3135. Closes over this level could confirm it as new support, leading to a move higher.

However, bulls are contending with probable resistance near $0.4631, while $0.5470 is also likely to be sensitive with the nearest support and resistance this close together.

2. Fantom (FTM)

Fantom FTM is a directed acyclic graph (DAG) smart contract platform providing decentralised finance (DeFi) services to developers using its own bespoke consensus algorithm. Together with its in-house token FTM, Fantom aims to solve problems associated with smart-contract platforms – specifically transaction speed, which developers say they have reduced to under two seconds.

FTM Price Analysis

At the time of writing, FTM is ranked the 64th cryptocurrency globally and the current price is US$0.2189. Let’s take a look at the chart below for price analysis:

Source: TradingView

FTM‘s bounce during Q2 ran into resistance near the old monthly highs. This rejection created a set of relatively equal highs near $0.4267, possibly forming the next bullish leg’s target.

Currently, the price is testing possible support near the weekly open, around $0.2061. This level also has confluence with the 80.6% retracement of the current local range and the 18 and 40 EMAs. 

If this level fails to provide support, a zone from $0.1834 to $0.1730 might mark a possible swing low or consolidation area. This zone is between the 65.8% and 78.6% retracement of August 2021’s swing.

A more bearish tone in the market could propel the price lower. The lows, near $0.1530, may mark an area of possible support as well as a bearish target.

3. The Sandbox (SAND)

The Sandbox SAND is a blockchain-based virtual world allowing users to create, build, buy and sell digital assets in the form of a game. By combining the powers of decentralised autonomous organisations (DAOs) and non-fungible tokens (NFTs), the Sandbox creates a decentralised platform for a thriving gaming community. The Sandbox employs the powers of blockchain technology by introducing the SAND utility token, which facilitates transactions on the platform.

SAND Price Analysis

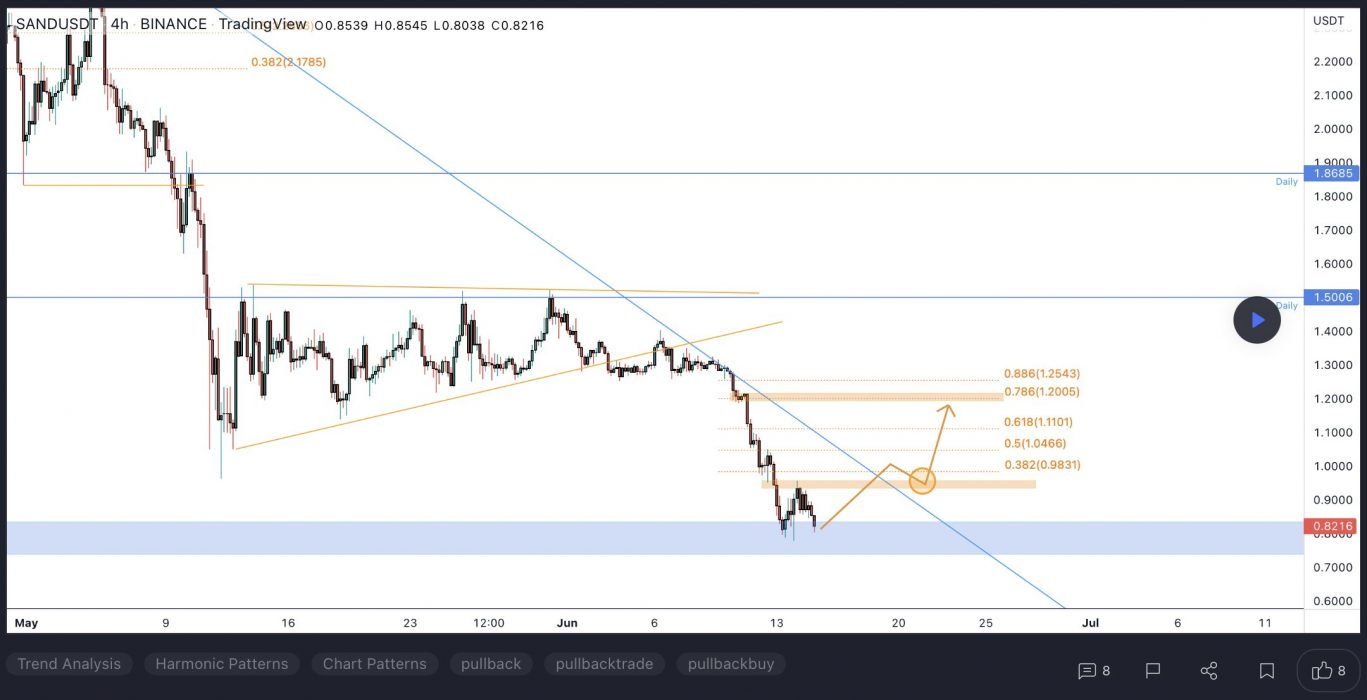
At the time of writing, SAND is ranked the 42nd cryptocurrency globally and the current price is US$0.8427. Let’s take a look at the chart below for price analysis:

Source: TradingView

SAND‘s impressive gains during Q1 halted at $2.38 before retracing 80% of the move. This price action created several areas of possible higher-timeframe resistance in the process.

The price found resistance on its last swing upward near $1.15 – an area that could provide resistance again. If this swing high breaks, the price might find resistance near $1.26. If this area does provide resistance, it would suggest the formation of a higher-timeframe consolidation.

The fast move up left little higher-timeframe support. However, a vast zone between $0.8890 and $0.8146 has provided support before and could give support again on a retest. This zone is between the 71.8%-to-88.6% retracement levels of 2021 Q4’s parabolic move.

Continuation downward through this level, especially if the overall market remains bearish, could retrace most of Q2’s move to the next higher-timeframe support near $0.7055.

Learn How to Trade Live!

Join Dave and The Crypto Den Crew and they’ll show you live on a webinar how to take your crypto trading to the next level.

Where to Buy or Trade Altcoins?

These coins have high liquidity on Binance Exchange, so that could help with trading on AUD/USDT/BTC pairs. And if you’re looking at buying and HODLing cryptos, then Swyftx Exchange is an easy-to-use popular choice in Australia.
Categories
Axie Infinity Cardano Crypto News Market Analysis Solana Trading

Top 3 Coins to Watch Today: SOL, ADA, AXS – June 15 Trading Analysis

Let’s take a closer look at today’s altcoins showing breakout signals. We’ll explain what the coin is, then dive into the trading charts and provide some analysis to help you decide.

1. Solana (SOL)

Solana SOL is a highly functional open-source project that banks on blockchain technology’s permissionless nature to provide decentralised finance (DeFi) solutions. The Solana protocol is designed to facilitate decentralised app (DApp) creation. It aims to improve scalability by introducing a proof-of-history (PoH) consensus combined with the underlying proof-of-stake (PoS) consensus of the blockchain.

SOL Price Analysis

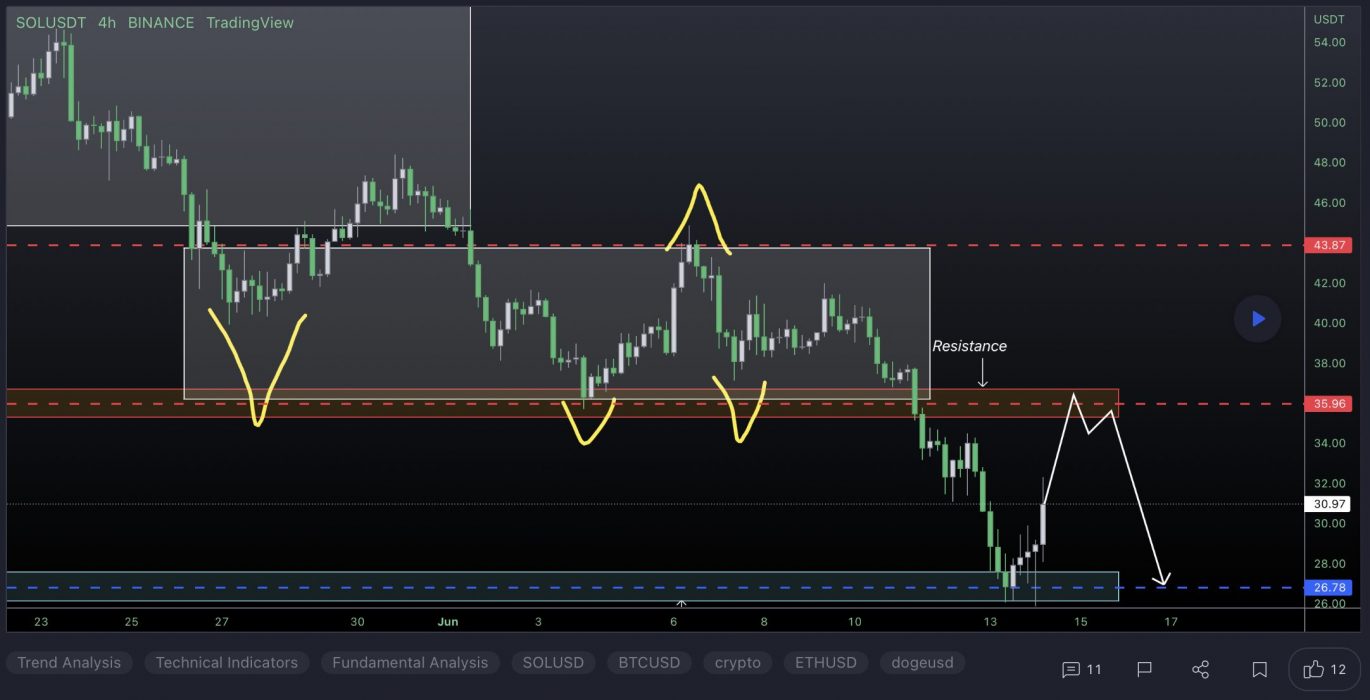
At the time of writing, SOL is ranked the 9th cryptocurrency globally and the current price is US$30.10. Let’s take a look at the chart below for price analysis:

Source: TradingView

SOL has retraced 87% from its Q2 highs and reached possible support last week near $26.34. Resistance might begin near $33.64, which has confluence with the 9 and 18 EMAs.

A more substantial rally might reach near the swing high at $37.23 and the 40 EMA. This high is less likely to break if bears plan to continue the downtrend without a lengthier consolidation.

While not highly probable in the current market conditions, a more animated move upward could reach a wide resistance area between $40.42 and $45.94. This zone is where the last movement down accumulated positions before breaking down. 

Possible support rests near $25.34, which showed sensitivity on the last test. While it could provide support again, the higher-timeframe bearish trend is more likely to propel the price into an inefficient area between $23.10 and $20.54. If the price reaches this zone, the Q1 2021 swing high near $17.12 might mark a more sensitive level.

2. Cardano (ADA)

Cardano ADA is a proof-of-stake blockchain platform whose stated goal is to allow “changemakers, innovators, and visionaries” to bring about positive global change. The open-source project also aims to “redistribute power from unaccountable structures to the margins to individuals”, helping to create a society that is more secure, transparent, and fair. Cardano is used by agricultural companies to track fresh produce from field to fork, while other products built on the platform allow educational credentials to be stored in a tamper-proof way, and retailers to clamp down on counterfeit goods.

ADA Price Analysis

At the time of writing, ADA is ranked the 7th cryptocurrency globally and the current price is US$0.4951. Let’s take a look at the chart below for price analysis:

Source: TradingView

ADA‘s near 60% drop during Q2 found a low near $0.4335 during early June before closing over a short-term high.

This daily close over the high could signal a shift in market structure that may reach probable resistance near $0.5915. A sustained bullish move may target the swing high at $0.6322. If this stop run occurs, a run beyond the high into probable resistance near $0.7210 and $0.7719 is possible.

Bulls could buy a retracement to possible support near $0.4570, just above the weekly open. A bearish turn in the marketplace may propel the price toward possible support near $0.4325. 

However, relatively equal lows near $0.4057 and $0.3922 provide an attractive target for bears if the market resumes its bearish trend. A run on these lows might find support between $0.3647 and $0.3552.

3. Axie Infinity (AXS)

Axie Infinity AXS is a blockchain-based trading and battling game that is partially owned and operated by its players. The Axie Infinity ecosystem has its own unique governance token, known as Axie Infinity Shards AXS. These are used to participate in key governance votes and give holders a say in how funds in the Axie Community Treasury are spent.

AXS Price Analysis

At the time of writing, AXS is ranked the 49th cryptocurrency globally and the current price is US$14.05. Let’s take a look at the chart below for price analysis:

Source: TradingView

AXS‘s relatively small 20% range could suggest that a recovery is setting up in June.

Aggressive bulls could look for entries at the most recent area of support formed near $13.34. However, equal lows near $12.42 make a tempting target for a stop run into this support. This move could reach support near $11.90. 

A decisive move to the downside could run stops below the second set of relatively equal lows near $11.20, possibly reaching support at an old swing high and a daily gap near $10.58.

A recent level near $17.84 provided resistance and caused a swing high to form near $19.88, offering first targets. A move through this high may arrive at new monthly high levels near $20.31 and $23.50.

Learn How to Trade Live!

Join Dave and The Crypto Den Crew and they’ll show you live on a webinar how to take your crypto trading to the next level.

Where to Buy or Trade Altcoins?

These coins have high liquidity on Binance Exchange, so that could help with trading on AUD/USDT/BTC pairs. And if you’re looking at buying and HODLing cryptos, then Swyftx Exchange is an easy-to-use popular choice in Australia.