Categories
Audius Crypto News ICP Market Analysis The Sandbox Trading

Top 3 Coins to Watch Today: AUDIO, ICP, SAND – August 23 Trading Analysis

Let’s take a closer look at today’s altcoins showing breakout signals. We’ll explain what the coin is, then dive into the trading charts and provide some analysis to help you decide.

1. Audius (AUDIO)

Audius AUDIO is a decentralised music-sharing and streaming protocol that facilitates direct transactions between listeners and creators, giving everyone the freedom to distribute, monetise, and stream any audio content. Audius aims to align the interests of artists, fans and node operators through its platform powered by its native AUDIO token. Artists can upload music, stored and distributed by content and discovery nodes, that fans can listen to for free.

AUDIO Price Analysis

At the time of writing, AUDIO is ranked the 122nd cryptocurrency globally and the current price is US$0.2989. Let’s take a look at the chart below for price analysis:
Source: TradingView

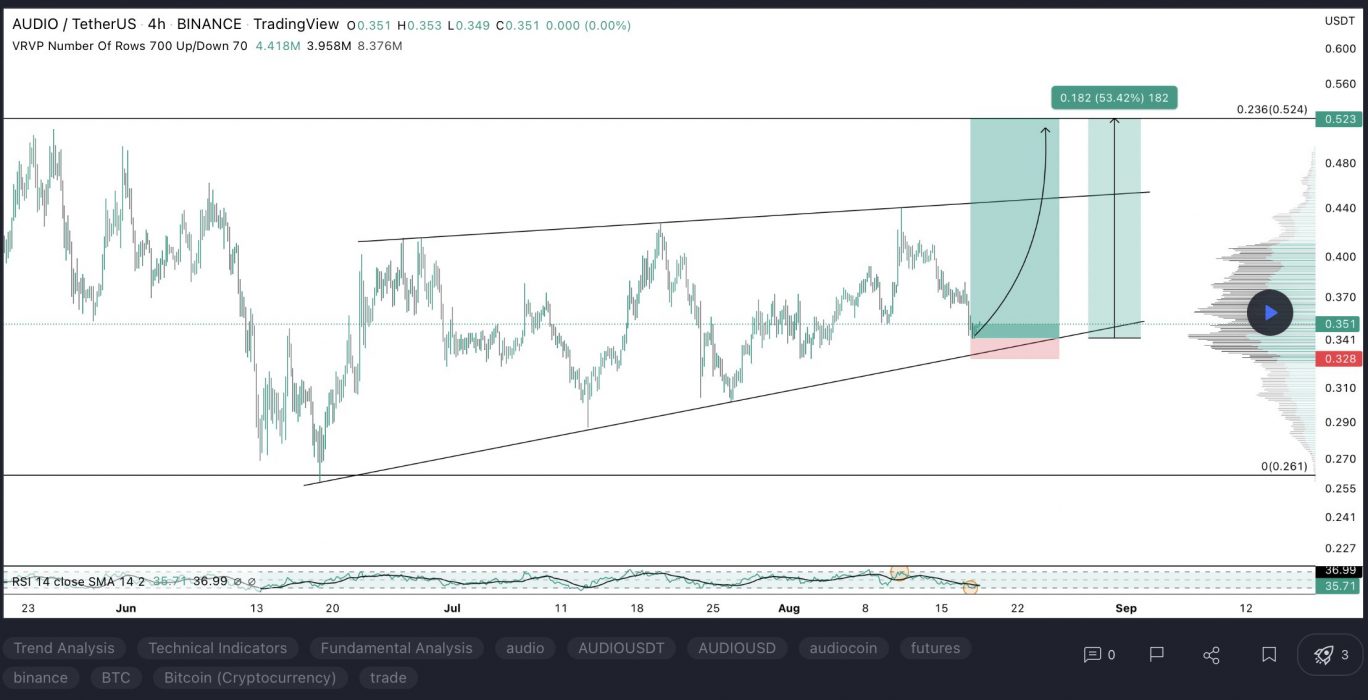
AUDIO has been consolidating between approximately $0.509 and $0.282 since early May 2022. The high end of this range, from $0.496 to $0.563, could provide significant resistance. A rally to this level would partially fill an area of inefficient trading on the monthly, weekly, and daily charts. It would also run bears’ stops above the summer’s consolidation.

The swing high near $0.440 could provide a closer resistance. If the price can reach this level, it will run bears’ stops above the recent sharp move downward. It’s also near the June monthly open.

The closest resistance may be an area between $0.352 and $0.377. This level shows buying before August 11’s run on bears’ stops, contains the 40 EMA, and has inefficient trading on the daily chart.

Currently, the price is testing possible support near $0.306. At this level, bulls rejected bears in mid-June near the bottom of inefficient trading on the monthly chart. The price has already swept some bulls’ stops as it creates relative equal lows. 

These relative equal lows may suggest that this level will later break. Yet, in the short term, it could prompt a rally toward resistance.

If the price breaks down from its consolidation range, $0.215 may provide the next higher-timeframe support. Here, the weekly chart shows accumulation before early 2021’s rally.

A sustained downtrend could reach $0.077 or below, where the monthly chart shows inefficient trading. Higher-timeframe support below this level is unclear due to a lack of historical price action.

2. Internet Computer (ICP)

The Internet Computer ICP is the world’s first blockchain that runs at web speed with unbounded capacity. It also represents the third major blockchain innovation alongside Bitcoin and Ethereum. The Internet Computer scales smart contract computation and data, runs them at web speed, processes and stores data efficiently, and provides powerful software frameworks to developers. By making this possible, it enables the complete re-imagination of software, providing a revolutionary new way to build tokenised internet services, pan-industry platforms, decentralised financial systems, and even traditional enterprise systems and websites.

ICP Price Analysis

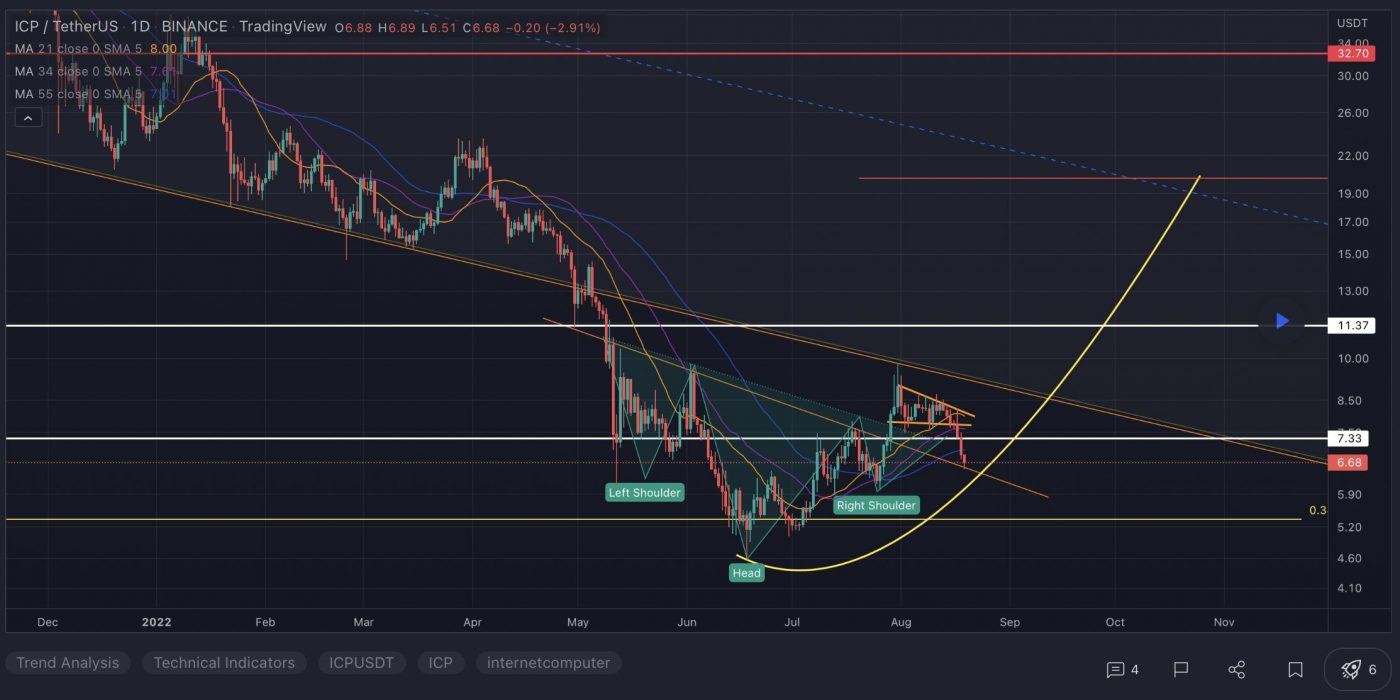
At the time of writing, ICP is ranked the 35th cryptocurrency globally and the current price is US$6.22. Let’s take a look at the chart below for price analysis:
Source: TradingView

ICP has consolidated since mid-May and is approaching the bottom of this range. An area near $5.95 could provide support. It’s below relative equal lows, offering bears an attractive target, and shows inefficient trading on the daily chart.

A run to this level may drop slightly lower, near $5.54, to touch the midpoint of accumulation on the weekly chart. No historical price action exists to suggest support below this area. The 50% extension on late July’s bullish impulse could hint at possible support and a bearish target near $4.25.

The closest resistance might exist between $7.17 and $7.60. This area shows inefficient trading on the daily chart above the midpoint of the recent drop. It also contains the 18 and 40 EMAs. If the price does break through this level, it could retest the August monthly open near $8.99. Bears rejected bulls here on all timeframes.

A more substantial rally may run bears’ stops above relative equal highs near $9.80. This potential move could reach into an area of inefficient trading on the monthly and weekly charts above, up to $11.28. Stronger resistance might begin near $10.24, where the daily chart showed brief distribution on May 10.

3. The Sandbox (SAND)

The Sandbox SAND is a blockchain-based virtual world allowing users to create, build, buy and sell digital assets in the form of a game. By combining the powers of decentralised autonomous organisations (DAOs) and non-fungible tokens (NFTs), the Sandbox creates a decentralised platform for a thriving gaming community. The Sandbox employs the powers of blockchain technology by introducing the SAND utility token, which facilitates transactions on the platform.

SAND Price Analysis

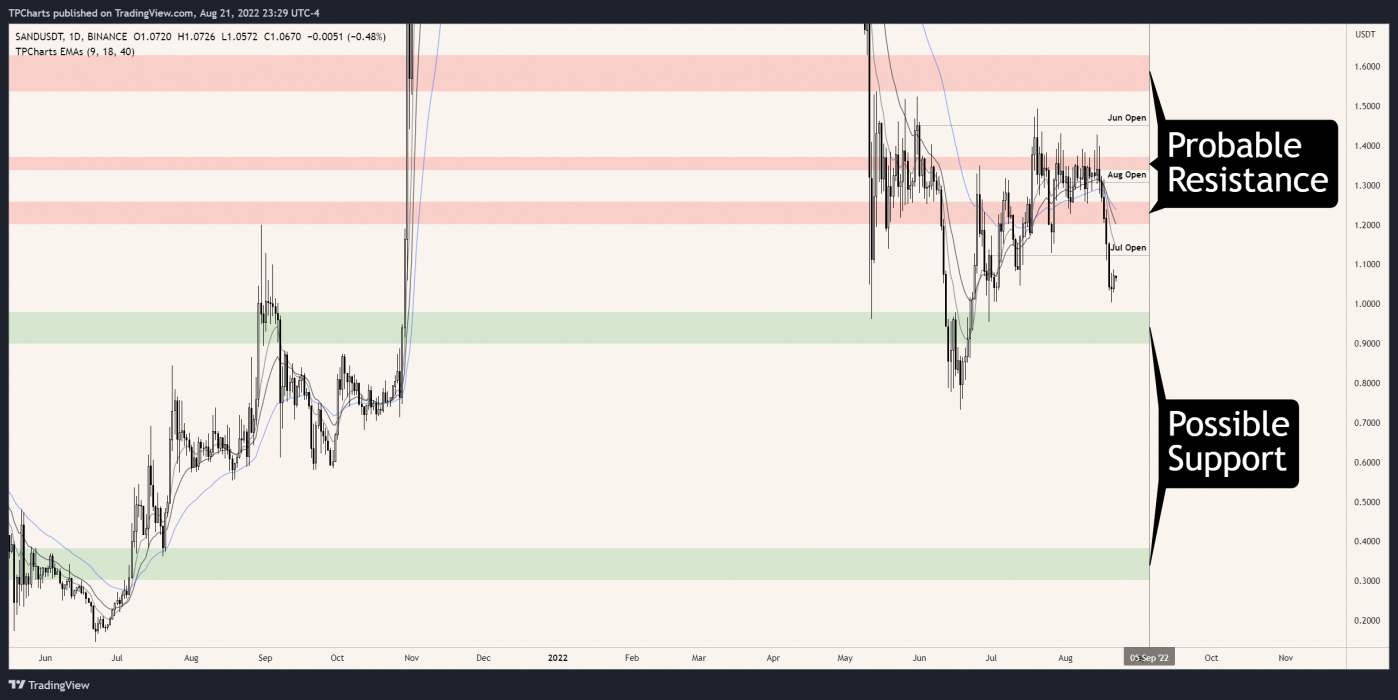
At the time of writing, SAND is ranked the 38th cryptocurrency globally and the current price is US$1.02. Let’s take a look at the chart below for price analysis:
Source: TradingView

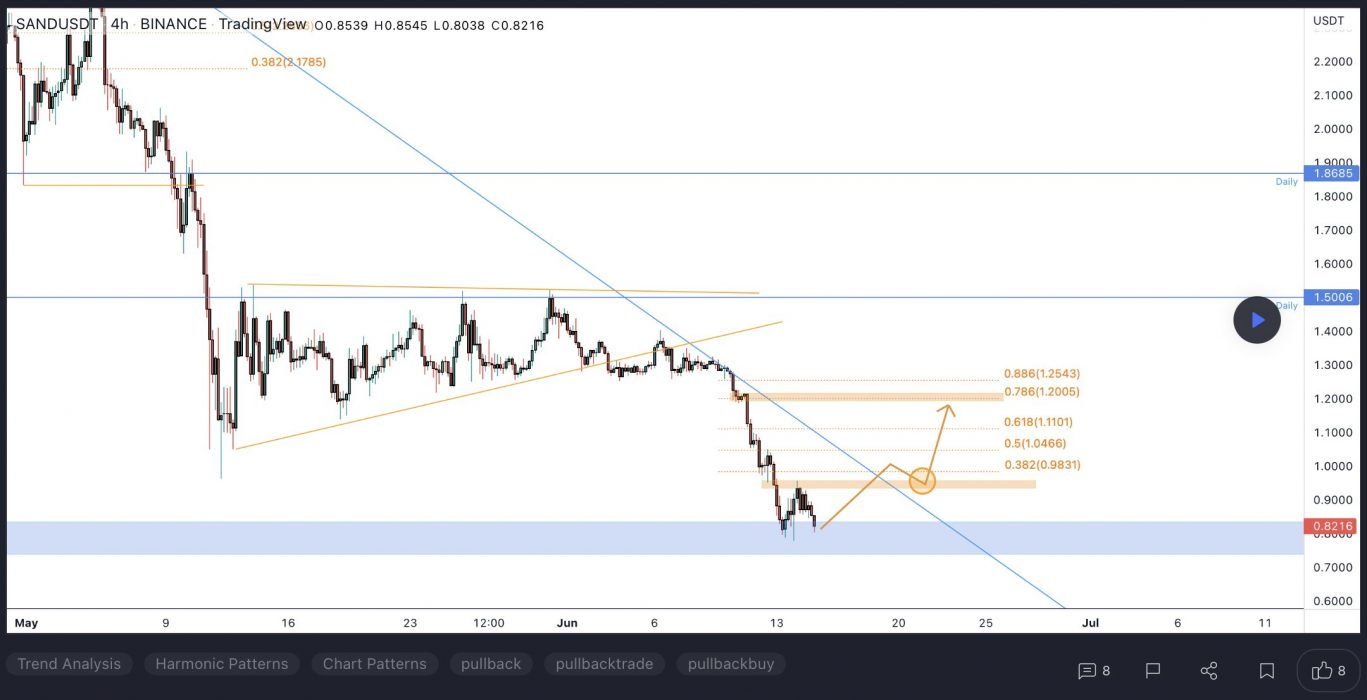
SAND has also been consolidating since mid-May and is retesting its range lows. An area between $0.9798 and $0.8995 offers the highest odds of holding if bulls want to keep the price in its range. This area near the range’s lows is the upper half of accumulation on the weekly chart. It also ran stops under early May’s swing low. 

If the downtrend resumes, the price may reach as low as $0.3827. This area shows inefficient trading formed on the weekly chart as July 2021’s rally kicked off. The price has not yet indicated that it will head for this level.

Inefficient trading near $1.2026 may provide the first resistance. This area contains the 18 and 40 EMAs and overlaps with old swing lows.

Bears rejected bulls in late July and early August near $1.3384. This area, just above the August monthly open, could provide resistance again.

An area of inefficient trading from $1.5373 to $1.6298 offers an attractive target to bulls and could provide significant resistance. Reaching this gap would allow bulls to run many bears’ stops above the summer’s range highs.

Learn How to Trade Live!

Join Dave and The Crypto Den Crew and they’ll show you live on a webinar how to take your crypto trading to the next level.

Where to Buy or Trade Altcoins?

These coins have high liquidity on Binance Exchange, so that could help with trading on AUD/USDT/BTC pairs. And if you’re looking at buying and HODLing cryptos, then Swyftx Exchange is an easy-to-use popular choice in Australia.

Categories
Crypto News Fantom Litecoin Market Analysis The Sandbox Trading

Top 3 Coins to Watch Today: LTC, FTM, SAND – August 11 Trading Analysis

Let’s take a closer look at today’s altcoins showing breakout signals. We’ll explain what the coin is, then dive into the trading charts and provide some analysis to help you decide.

1. Litecoin (LTC)

Litecoin LTC is a cryptocurrency designed to provide fast, secure and low-cost payments by leveraging the unique properties of blockchain technology. The cryptocurrency was created based on the Bitcoin protocol but it differs in terms of the hashing algorithm used, hard cap, block transaction times, and a few other factors. Litecoin has a block time of just 2.5 minutes and extremely low transaction fees, making it suitable for micro-transactions and point-of-sale payments.

LTC Price Analysis

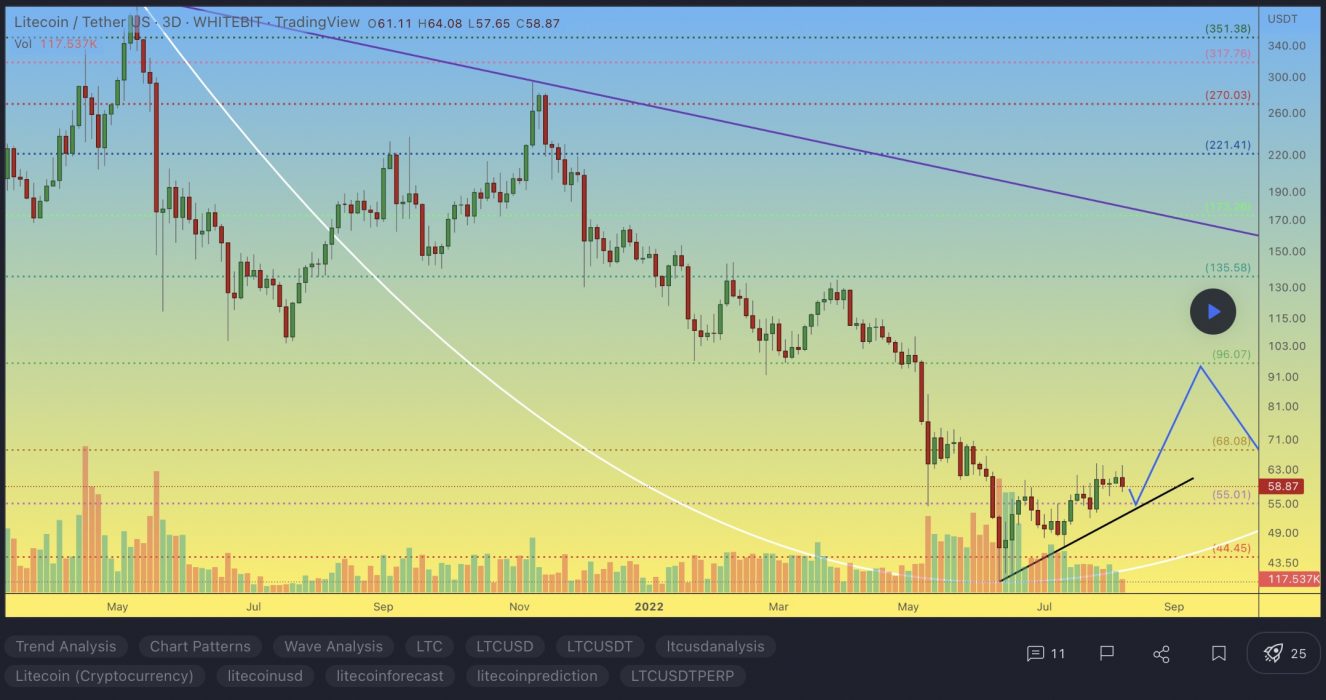
At the time of writing, LTC is ranked the 22nd cryptocurrency globally and the current price is US$62.03. Let’s take a look at the chart below for price analysis:

Source: TradingView

After setting a low last month, LTC kicked off a with recovery trend to break the weekly highs. The following 70% plummet found support near $44.36, sweeping under the 40 EMA into the 65.8% retracement level before bouncing to resistance beginning at $65.73.

This area could continue to provide resistance, possibly causing a retracement to the 9 EMA and 18 EMA near $69.12, where aggressive bulls might begin bidding. The level near $76.18, which has confluence with the 40 EMA, may see more interest from bulls loading up for an attempt on probable resistance beginning near $82.13. 

However, if Bitcoin continues its sideways trend, much lower prices could be seen. The old support near $56.18 could provide at least a short-term bounce. If this level fails, the old monthly lows near $48.65 may also give support and see the start of a new bullish cycle after retesting these support levels.

2. Fantom (FTM)

Fantom FTM is a directed acyclic graph (DAG) smart contract platform providing decentralised finance (DeFi) services to developers using its own bespoke consensus algorithm. Together with its in-house token FTM, Fantom aims to solve problems associated with smart-contract platforms – specifically transaction speed, which developers say they have reduced to under two seconds.

FTM Price Analysis

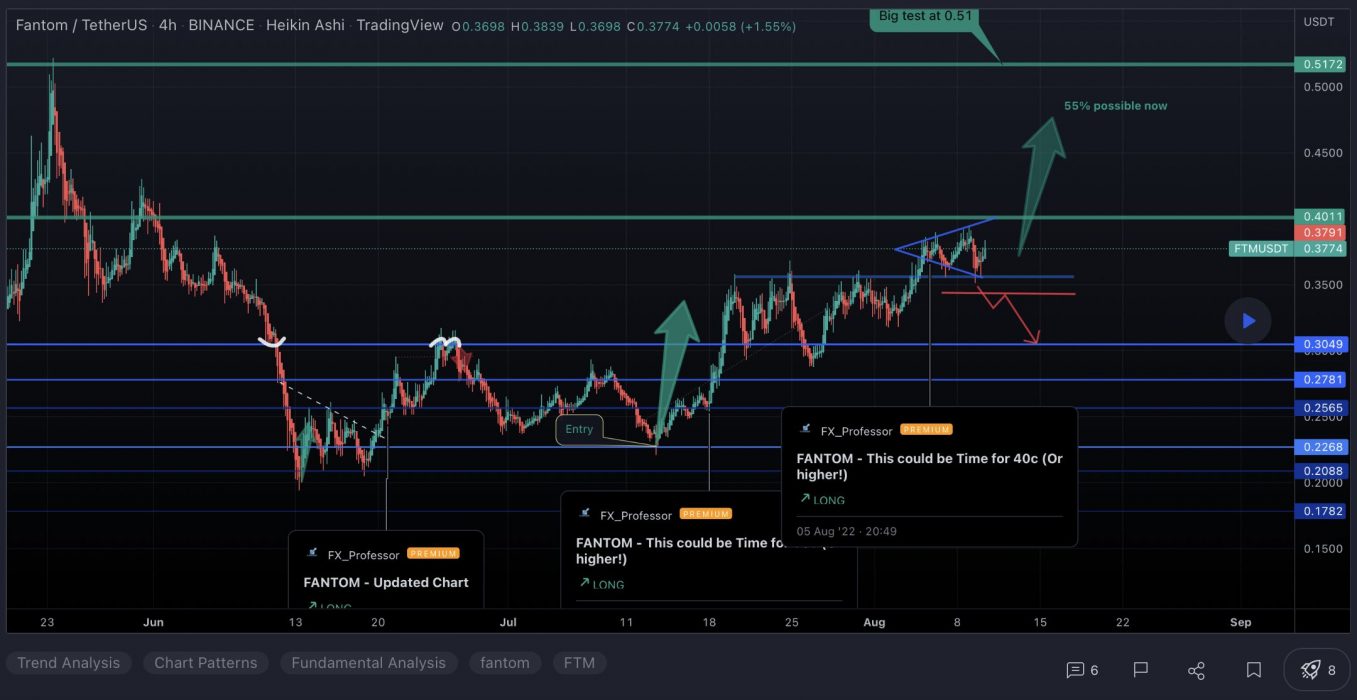
At the time of writing, FTM is ranked the 53rd cryptocurrency globally and the current price is US$0.4118. Let’s take a look at the chart below for price analysis:

Source: TradingView

FTM‘s bounce during Q2 ran into resistance near the old monthly highs. This rejection created a set of relatively equal highs near $0.5067, possibly forming the next bullish leg’s target.

Currently, the price is testing possible support near the weekly open, around $0.3865. This level also has confluence with the 80.6% retracement of the current local range and the 18 and 40 EMAs. 

If this level fails to provide support, a zone from $0.3574 to $0.3320 might mark a possible swing low or consolidation area. This zone is between the 65.8% and 78.6% retracement of August 2021’s swing.

A more bearish tone in the market could propel the price lower. The lows, near $0.3070, may mark an area of possible support as well as a bearish target.

3. The Sandbox (SAND)

The Sandbox SAND is a blockchain-based virtual world allowing users to create, build, buy and sell digital assets in the form of a game. By combining the powers of decentralised autonomous organisations (DAOs) and non-fungible tokens (NFTs), the Sandbox creates a decentralised platform for a thriving gaming community. The Sandbox employs the powers of blockchain technology by introducing the SAND utility token, which facilitates transactions on the platform.

SAND Price Analysis

At the time of writing, SAND is ranked the 37th cryptocurrency globally and the current price is US$1.34. Let’s take a look at the chart below for price analysis:

Source: TradingView

SAND‘s impressive gains during Q1 halted at $3.00 before retracing 85% of the move. This price action created several areas of possible higher-timeframe resistance in the process.

The price found resistance on its last swing upward near $1.40 – an area that could provide resistance again. If this swing high breaks, the price may find resistance near $1.58. If this area does provide resistance, it would suggest the formation of a higher-timeframe consolidation.

The fast move up left little higher-timeframe support. However, a vast zone between $1.28 and $1.24 has provided support before and could give support again on a retest. This zone is between the 71.8%-to-88.6% retracement levels of 2021 Q4’s parabolic move.

Continuation downward through this level, especially if the overall market remains bearish, could retrace most of Q2’s move to the next higher-timeframe support near $1.10.

Learn How to Trade Live!

Join Dave and The Crypto Den Crew and they’ll show you live on a webinar how to take your crypto trading to the next level.

Where to Buy or Trade Altcoins?

These coins have high liquidity on Binance Exchange, so that could help with trading on AUD/USDT/BTC pairs. And if you’re looking at buying and HODLing cryptos, then Swyftx Exchange is an easy-to-use popular choice in Australia.
Categories
Crypto News Market Analysis Ripple The Sandbox Trading TRON

Top 3 Coins to Watch Today: XRP, SAND, TRX – July 6 Trading Analysis

Let’s take a closer look at today’s altcoins showing breakout signals. We’ll explain what the coin is, then dive into the trading charts and provide some analysis to help you decide.

1. Ripple (XRP)

Ripple XRP is the currency that runs on a digital payment platform called RippleNet, on top of a distributed ledger database called XRP Ledger. While RippleNet is run by a company called Ripple, the XRP Ledger is open-source and not based on a blockchain, but rather the aforementioned distributed ledger database.

XRP Price Analysis

At the time of writing, XRP is ranked the 7th cryptocurrency globally and the current price is US$0.3249. Let’s take a look at the chart below for price analysis:

Source: TradingView

XRP printed some gains during Q1 and Q2 after moving sideways for the past few weeks. The price is in a downtrend, with the 9, 18 and 40 EMAs providing resistance on each attempt to rally.

However, bulls are showing some interest at the 80% retracement, near $0.3210. If this level breaks, a move into possible support – just below the lows near $0.2932 – seems likely.

If the price does rally through the swing high at $0.3755 – perhaps triggered by a sudden surge in Bitcoin – bulls might find some resistance at the 61.8% retracement level near $0.4050. 

Overlapping swing highs and lows near $0.4426 may provide the next target, where bears immediately forced the price down in late December.

More bullish market conditions could shift targets up near the midpoint of Q1’s consolidation, near $0.5032, where higher timeframes show an inefficiently traded zone.

2. The Sandbox (SAND)

The Sandbox SAND is a blockchain-based virtual world allowing users to create, build, buy and sell digital assets in the form of a game. By combining the powers of decentralised autonomous organisations (DAOs) and non-fungible tokens (NFTs), the Sandbox creates a decentralised platform for a thriving gaming community. The Sandbox employs the powers of blockchain technology by introducing the SAND utility token, which facilitates transactions on the platform.

SAND Price Analysis

At the time of writing, SAND is ranked the 34th cryptocurrency globally and the current price is US$1.19. Let’s take a look at the chart below for price analysis:

Source: TradingView

SAND‘s impressive gains during Q1 halted at $3.10 before retracing 85% of the move. This price action created several areas of possible higher-timeframe resistance in the process.

The price found resistance on its last swing upward near $1.27 – an area that could provide resistance again. If this swing high breaks, the price might find resistance near $1.40. If this area does provide resistance, it would suggest the formation of a higher-timeframe consolidation.

The fast move up left little higher-timeframe support. However, a vast zone between $0.9890 and $0.9146 has provided support before and could give support again on a retest. This zone is between the 71.8%-to-88.6% retracement levels of 2021 Q4’s parabolic move.

Continuation downward through this level, especially if the overall market remains bearish, could retrace most of Q2’s move to the next higher-timeframe support near $0.8645.

3. Tron (TRX)

Tron TRX is a blockchain-based operating system that aims to ensure this technology is suitable for daily use. Whereas Bitcoin can handle up to six transactions per second, and Ethereum up to 25, TRON claims that its network has a capacity for 2,000 TPS. This project is best described as a decentralised platform focused on content sharing and entertainment, and to this end, one of its biggest acquisitions was the file-sharing service BitTorrent in 2018. Overall, TRON has divided its goals into six phases. These include delivering simple distributed file sharing and driving content creation through financial rewards.

TRX Price Analysis

At the time of writing, TRX is ranked the 13th cryptocurrency globally and the current price is US$0.06821. Let’s take a look at the chart below for price analysis:

Source: TradingView

TRX accompanied the rest of the market during the Q2 drop, falling nearly 54% from mid-May until it found a low last week.

Price action formed a weekly support level near $0.06254, which has so far held up the price. The most recent swing low inside this range, near $0.06049, may be the target for any future stop runs. After this low, the swing low near $0.05689 and the gap beginning near $0.05126 mark possible higher-timeframe support.

The price is currently battling with significant higher-timeframe resistance levels, with the closest probable resistance resting near $0.08492, just over the previous monthly open. A sweep of the relatively equal highs above this resistance might find sellers near $0.09235 but could reach as high as $0.1093.

Learn How to Trade Live!

Join Dave and The Crypto Den Crew and they’ll show you live on a webinar how to take your crypto trading to the next level.

Where to Buy or Trade Altcoins?

These coins have high liquidity on Binance Exchange, so that could help with trading on AUD/USDT/BTC pairs. And if you’re looking at buying and HODLing cryptos, then Swyftx Exchange is an easy-to-use popular choice in Australia.
Categories
Crypto News Fantom Market Analysis Polygon The Sandbox Trading

Top 3 Coins to Watch Today: MATIC, FTM, SAND – June 16 Trading Analysis

Let’s take a closer look at today’s altcoins showing breakout signals. We’ll explain what the coin is, then dive into the trading charts and provide some analysis to help you decide.

1. Polygon (MATIC)

Polygon MATIC is the first well-structured, easy-to-use platform for Ethereum scaling and infrastructure development. Its core component is Polygon SDK, a modular, flexible framework that supports building multiple types of applications. The MATIC token will continue to exist and will play an increasingly important role in securing the system and enabling governance.

MATIC Price Analysis

At the time of writing, MATIC is ranked the 20th cryptocurrency globally and the current price is US$0.3749. Let’s take a look at the chart below for price analysis:

Source: TradingView

Since its Q1 highs, MATIC has been in a steady bearish trend, retracing nearly 75%. The price found support near $0.3520, at the 65.8% retracement level.

Last week’s sharp impulse up might have marked the start of a new trend. If so, higher timeframes suggest that $0.3639, near the 65.8% retracement and the 9, 18 and 40 EMAs, may see interest from bulls. The price could reach lower, near $0.3320, and still find support.

Currently, the price is contesting a region between $0.3039 and $0.3135. Closes over this level could confirm it as new support, leading to a move higher.

However, bulls are contending with probable resistance near $0.4631, while $0.5470 is also likely to be sensitive with the nearest support and resistance this close together.

2. Fantom (FTM)

Fantom FTM is a directed acyclic graph (DAG) smart contract platform providing decentralised finance (DeFi) services to developers using its own bespoke consensus algorithm. Together with its in-house token FTM, Fantom aims to solve problems associated with smart-contract platforms – specifically transaction speed, which developers say they have reduced to under two seconds.

FTM Price Analysis

At the time of writing, FTM is ranked the 64th cryptocurrency globally and the current price is US$0.2189. Let’s take a look at the chart below for price analysis:

Source: TradingView

FTM‘s bounce during Q2 ran into resistance near the old monthly highs. This rejection created a set of relatively equal highs near $0.4267, possibly forming the next bullish leg’s target.

Currently, the price is testing possible support near the weekly open, around $0.2061. This level also has confluence with the 80.6% retracement of the current local range and the 18 and 40 EMAs. 

If this level fails to provide support, a zone from $0.1834 to $0.1730 might mark a possible swing low or consolidation area. This zone is between the 65.8% and 78.6% retracement of August 2021’s swing.

A more bearish tone in the market could propel the price lower. The lows, near $0.1530, may mark an area of possible support as well as a bearish target.

3. The Sandbox (SAND)

The Sandbox SAND is a blockchain-based virtual world allowing users to create, build, buy and sell digital assets in the form of a game. By combining the powers of decentralised autonomous organisations (DAOs) and non-fungible tokens (NFTs), the Sandbox creates a decentralised platform for a thriving gaming community. The Sandbox employs the powers of blockchain technology by introducing the SAND utility token, which facilitates transactions on the platform.

SAND Price Analysis

At the time of writing, SAND is ranked the 42nd cryptocurrency globally and the current price is US$0.8427. Let’s take a look at the chart below for price analysis:

Source: TradingView

SAND‘s impressive gains during Q1 halted at $2.38 before retracing 80% of the move. This price action created several areas of possible higher-timeframe resistance in the process.

The price found resistance on its last swing upward near $1.15 – an area that could provide resistance again. If this swing high breaks, the price might find resistance near $1.26. If this area does provide resistance, it would suggest the formation of a higher-timeframe consolidation.

The fast move up left little higher-timeframe support. However, a vast zone between $0.8890 and $0.8146 has provided support before and could give support again on a retest. This zone is between the 71.8%-to-88.6% retracement levels of 2021 Q4’s parabolic move.

Continuation downward through this level, especially if the overall market remains bearish, could retrace most of Q2’s move to the next higher-timeframe support near $0.7055.

Learn How to Trade Live!

Join Dave and The Crypto Den Crew and they’ll show you live on a webinar how to take your crypto trading to the next level.

Where to Buy or Trade Altcoins?

These coins have high liquidity on Binance Exchange, so that could help with trading on AUD/USDT/BTC pairs. And if you’re looking at buying and HODLing cryptos, then Swyftx Exchange is an easy-to-use popular choice in Australia.
Categories
Binance Coin Crypto News Market Analysis The Sandbox Trading Waves

Top 3 Coins to Watch Today: BNB, WAVES, SAND – May 11 Trading Analysis

Let’s take a closer look at today’s altcoins showing breakout signals. We’ll explain what the coin is, then dive into the trading charts and provide some analysis to help you decide.

1. Binance Coin (BNB)

Binance BNB is the biggest cryptocurrency exchange globally, based on daily trading volume. Binance aims to bring cryptocurrency exchanges to the forefront of world financial activity. Aside from being the largest cryptocurrency exchange, Binance has launched a whole ecosystem of functionalities for its users. The Binance network includes the Binance Chain, Binance Smart Chain, Binance Academy, Trust Wallet, and Research projects, which all employ the powers of blockchain technology to bring new-age finance to the world. Binance Coin is an integral part of the successful functioning of many of the Binance sub-projects.

BNB Price Analysis

At the time of writing, BNB is ranked the 4th cryptocurrency globally and the current price is US$323.70. Let’s take a look at the chart below for price analysis:

Source: TradingView

After a 30% decline from last week, BNB has ranged between $310 and $358. The recent price recovery was approaching probable resistance near $375 but could be aiming for stops above the relatively equal highs near $380. Continuation of the trend could target the daily gap near $394.

Aggressive bulls might add to positions near $320 and $316. Price action near $310 may be more likely to provide support – if it gets there – during any retracements.

Relatively equal lows clustered around $300 seem likely to be swept if the bearish trend resumes. If this move occurs, the price might find support at the significant higher-timeframe level near $290.

2. Waves (WAVES)

WAVES is a multi-purpose blockchain platform that supports various use cases, including decentralised applications (DApps) and smart contracts. The platform has undergone various changes and added new spin-off features to build on its original design. Waves’ native token is WAVES, an uncapped supply token used for standard payments such as block rewards. Waves initially set out to improve on the first blockchain platforms by increasing speed, utility, and user-friendliness.

WAVES Price Analysis

At the time of writing, WAVES is ranked the 55th cryptocurrency globally and the current price is US$12.14. Let’s take a look at the chart below for price analysis:

Source: TradingView

During Q1 high, WAVES‘ slight drop marks the current range as a reasonable area to expect accumulation.

The recent bearish flip of the 9, 18 and 40 EMAs might cause bulls to be less aggressive in bidding. However, possible support near $14.12 and $12.10 – between the 41.8% and 46.6% retracements – could see at least a short-term bounce. 

Long-term consolidation suggests that the areas near $25.45 and $30.61 may be more likely to cause a longer-term trend reversal.

Bears are likely to add to their shorts at probable resistance beginning near $20.77, which has confluence with the 18 EMA. A fast break of this resistance could trigger more selling near $23.42, the start of the bearish move.

3. The Sandbox (SAND)

The Sandbox SAND is a blockchain-based virtual world allowing users to create, build, buy and sell digital assets in the form of a game. By combining the powers of decentralised autonomous organisations (DAOs) and non-fungible tokens (NFTs), the Sandbox creates a decentralised platform for a thriving gaming community. The Sandbox employs the powers of blockchain technology by introducing the SAND utility token, which facilitates transactions on the platform.

SAND Price Analysis

At the time of writing, SAND is ranked the 39th cryptocurrency globally and the current price is US$1.76. Let’s take a look at the chart below for price analysis:

Source: TradingView

SAND‘s impressive gains during Q1 halted at $4.95 before retracing 70% of the move. This price action created several areas of possible higher-timeframe resistance in the process.

The price found resistance on its last swing upward near $2.43 – an area that could provide resistance again. If this swing high breaks, the price might find resistance near $2.85. If this area does provide resistance, it would suggest the formation of a higher-timeframe consolidation.

The fast move up left little higher-timeframe support. However, a vast zone between $1.90 and $1.72 has provided support before and could give support again on a retest. This zone is between the 61.8%-to-78.6% retracement levels of 2021 Q4’s parabolic move.

Continuation downward through this level, especially if the overall market remains bearish, could retrace most of Q4’s move to the next higher-timeframe support near $1.55.

Learn How to Trade Live!

Join Dave and The Crypto Den Crew and they’ll show you live on a webinar how to take your crypto trading to the next level.

Where to Buy or Trade Altcoins?

These coins have high liquidity on Binance Exchange, so that could help with trading on AUD/USDT/BTC pairs. And if you’re looking at buying and HODLing cryptos, then Swyftx Exchange is an easy-to-use popular choice in Australia.

Categories
Australia Blockchain Crypto News The Sandbox

Sandbox Creator Buys a Major Stake in Australian Digital Agency ‘Be Media’

Australian digital marketing agency ‘Be Media’ has sold a significant stake in the company to Animoca Brands, the crypto investment giant behind the Sandbox. Be Media is said to be already filling positions for blockchain-based development:

Hong Kong-based Animoca Brands now has a particularly large stake in the Perth-based digital marketing agency. This comes as the company pivots towards crypto after prioritising the provision of Web2 companies for its digital strategies.

Be Media Stake Part of Animoca Expansion Plan

Animoca appears to have purchased its stake as part of its incursion into Australia with aspirations of inducting more companies into Web3. Although Be Media is not strictly crypto-related, the agency makes a good starting point for Animoca’s expansion plan. Be Media has already begun “aggressive hiring” for project management and blockchain-based development positions.

Be Media founder and CEO Jordan Fogarty will retain his current role and a minor stake in the company. Fogarty is reportedly enthusiastic about the pairing and “honoured” to be a part of the introduction of Web3 to local companies.

High Performing Sales

The Sandbox’s token SAND has performed well since its release, hitting an all-time high in November 2021. Animoca announced its intention to release Metaverse Alpha the following month, which had a knock-on effect on token sales. The play-to-earn game hosted the event for just a month.

More recently, NFT gaming platform Balthazar raised US$3 million through an Animoca Brands token sale. The sale valued the DAO at US$30 million and elevated Balthazar to its status as one of the leading platforms in the metaverse.

Animoca has also partnered with the Australian Football League to mint its new NFT collection.

Categories
Crypto News Market Analysis Ocean Protocol Ripple The Sandbox Trading

Top 3 Coins to Watch Today: XRP, OCEAN, SAND – April 20 Trading Analysis

Let’s take a closer look at today’s altcoins showing breakout signals. We’ll explain what the coin is, then dive into the trading charts and provide some analysis to help you decide.

1. Ripple (XRP)

Ripple XRP is the currency that runs on a digital payment platform called RippleNet, on top of a distributed ledger database called XRP Ledger. While RippleNet is run by a company called Ripple, the XRP Ledger is open-source and not based on a blockchain, but rather the aforementioned distributed ledger database.

XRP Price Analysis

At the time of writing, XRP is ranked the 6th cryptocurrency globally and the current price is US$0.7720. Let’s take a look at the chart below for price analysis:

Source: TradingView

XRP printed some gains during early April after moving sideways for the past few months. The price was in a downtrend, with the 9, 18 and 40 EMAs providing resistance on each attempt to rally.

However, bulls are showing some interest at the 70.6% retracement, near $0.7372. If this level breaks, a move into possible support – just below the lows near $0.6852 – seems likely.

If the price does rally through the swing high at $0.8255 – perhaps triggered by a sudden surge in Bitcoin – bulls might find some resistance at the 61.8% retracement level near $0.8650. 

Overlapping swing highs and lows near $0.9046 might provide the next target, where bears immediately forced the price down in late December.

More bullish market conditions could shift targets up near the midpoint of Q3’s consolidation, near $0.9717, where higher timeframes show an inefficiently traded zone.

2. Ocean Protocol (OCEAN)

Ocean Protocol OCEAN is a blockchain-based ecosystem that allows individuals and businesses to easily unlock the value of their data and monetise it through the use of ERC-20 based datatokens. OCEAN is a utility token that is used for community governance and staking on data, in addition to buying and selling data as the basic unit of exchange on the Ocean Market. The price of these datatokens is set by an OCEAN-datatoken AMM pool, which adjusts the price of the datatoken as it is bought and sold based on supply and demand.

OCEAN Price Analysis

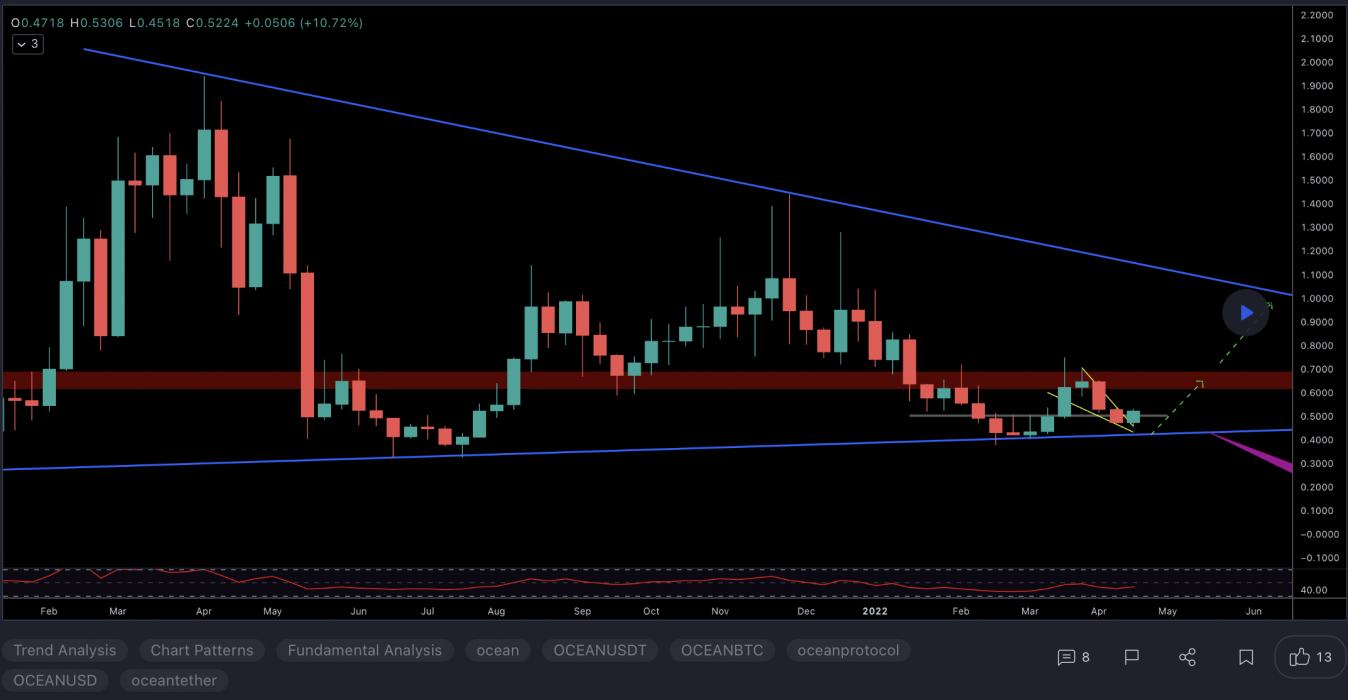
At the time of writing, OCEAN is ranked the 164th cryptocurrency globally and the current price is US$0.5427. Let’s take a look at the chart below for price analysis:

Source: TradingView

During March, OCEAN broke several swing highs that could be the signal for a new bullish trend.

Last week’s break of the most recent swing low could suggest some downside in the short term. It formed probable resistance near $0.6023 and may target the swing low and possible support near $0.5165.

The swing low and possible support near $0.4834 could be the second bearish target if the move down continues. The relatively equal lows near $0.4655 and possible support underneath near $0.4490 could provide more substantial support.

The last swing high near $0.6625 gives a near-term target if bullish conditions continue. However, resistance beginning around $0.6915 could cap this move. A break of this resistance might continue to probable resistance near $0.7428 and reach above the cluster of relatively equal highs near $0.8035.

3. The Sandbox (SAND)

The Sandbox SAND is a blockchain-based virtual world allowing users to create, build, buy and sell digital assets in the form of a game. By combining the powers of decentralised autonomous organisations (DAOs) and non-fungible tokens (NFTs), the Sandbox creates a decentralised platform for a thriving gaming community. The Sandbox employs the powers of blockchain technology by introducing the SAND utility token, which facilitates transactions on the platform.

SAND Price Analysis

At the time of writing, SAND is ranked the 40th cryptocurrency globally and the current price is US$2.92. Let’s take a look at the chart below for price analysis:

Source: TradingView

SAND‘s impressive gains during February halted at $5.10 before retracing 70% of the move. This price action created several areas of possible higher-timeframe resistance in the process.

The price found resistance on its last swing upward near $3.60 – an area that could provide resistance again. If this swing high breaks, the price might find resistance near $3.85. If this area does provide resistance, it would suggest the formation of a higher-timeframe consolidation.

The fast move up left little higher-timeframe support. However, a vast zone between $2.90 and $3.82 has provided support before and could give support again on a retest. This zone is between the 61.8%-to-78.6% retracement levels of 2021 Q4’s parabolic move.

Inside this zone, the consolidation high near $2.78 to $2.73 might see more sensitivity and mark the bearish target.

Continuation downward through this level, especially if the overall market remains bearish, could retrace most of Q4’s move to the next higher-timeframe support near $2.60.

Learn How to Trade Live!

Join Dave and The Crypto Den Crew and they’ll show you live on a webinar how to take your crypto trading to the next level.

Where to Buy or Trade Altcoins?

These coins have high liquidity on Binance Exchange, so that could help with trading on AUD/USDT/BTC pairs. And if you’re looking at buying and HODLing cryptos, then Swyftx Exchange is an easy-to-use popular choice in Australia.

Categories
Banking Industries Metaverse Sports The Sandbox

$3 Trillion Financial Services Giant HSBC Enters the Metaverse with Sandbox

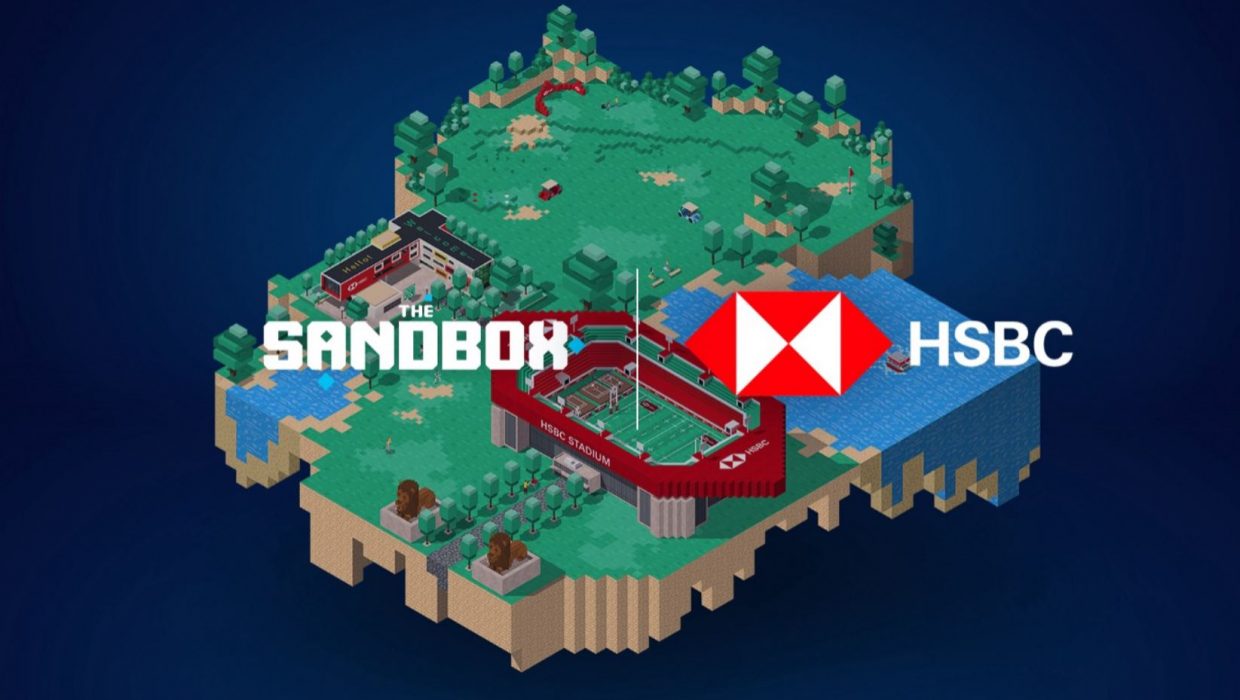
One of the world’s largest banking and financial services organisations – with assets worth US$2,958 billion as at December 31, 2021 – has bought space in the metaverse. HSBC aims to take sports engagements to the next level by buying plots of LAND in The Sandbox (SAND) and dedicating it to esports and gaming enthusiasts.

According to a blog post from Sandbox, the banking giant will be purchasing a considerable amount of LAND in the metaverse to create a space where esports and gaming enthusiasts can connect.

HSBC plot of LAND. Source: Medium

Sandbox hopes this will open the doors for other institutions to join the metaverse as a new platform to reach out and create better-gamified offerings. HSBC joins over 200 existing partnerships including Gucci, Warner Music Group, Ubisoft, The Walking Dead, Snoop Dogg and Adidas, among some other big names.

Through our partnership with The Sandbox we are making our foray into the metaverse, allowing us to create innovative brand experiences for new and existing customers. We’re excited to be working with our sports partners, brand ambassadors, and Animoca Brands to co-create experiences that are educational, inclusive and accessible.

Suresh Balaji, chief marketing officer, Asia-Pacific, HSBC

With the metaverse market forecast to grow from US$45.4 billion in 2019 to a staggering US$1.5 trillion in 2030, according to PWC, other institutions are trying to find their niche in the metaverse.

SAND Token Spikes After News

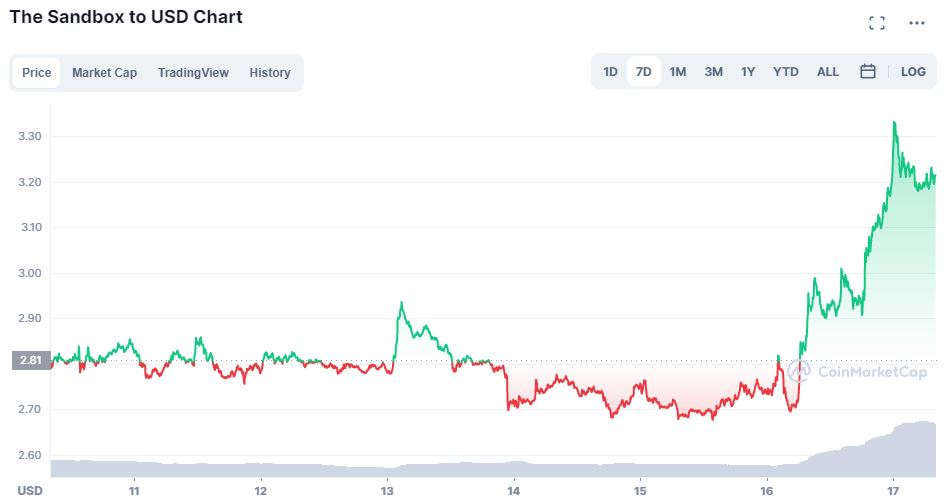
The native SAND token from the Sandbox project saw a spike up from the US$2.80 zone where it has been ranging for the past few days. At the time of writing the coin had gone up to US$3.21, a near 15 per cent increase. However, the coin is still 65 per cent down from its all-time high in November.

SAND/USDT price. Source: CoinMarketCap

HSBC Bans Binance Crypto Purchases

To some extent, HSBC still has its reservations toward crypto. Since August 2021, the bank has suspended payments to Binance and has also barred its clients from investing in stocks of companies that hold bitcoin, such as Microstrategy or Block:

In early 2021 the bank said it had “no plans to launch a cryptocurrency trading desk” or offer cryptocurrencies as investments to customers, Reuters reported.

As the adoption of crypto steadily increases, more and more large institutions are opting to embrace it. In November 2021, ING, the Dutch financial service giant – with US$1 trillion under management – started looking into DeFi, while Australia’s CBA is also supporting crypto purchases, making it the first bank down under to do so.

Categories
Crypto News EOS Linear Market Analysis The Sandbox Trading

Top 3 Coins to Watch Today: SAND, EOS, LINA – March 18 Trading Analysis

Let’s take a closer look at today’s altcoins showing breakout signals. We’ll explain what the coin is, then dive into the trading charts and provide some analysis to help you decide.

1. The Sandbox (SAND)

The Sandbox SAND is a blockchain-based virtual world allowing users to create, build, buy and sell digital assets in the form of a game. By combining the powers of decentralised autonomous organisations (DAOs) and non-fungible tokens (NFTs), the Sandbox creates a decentralised platform for a thriving gaming community. The Sandbox employs the powers of blockchain technology by introducing the SAND utility token, which facilitates transactions on the platform.

SAND Price Analysis

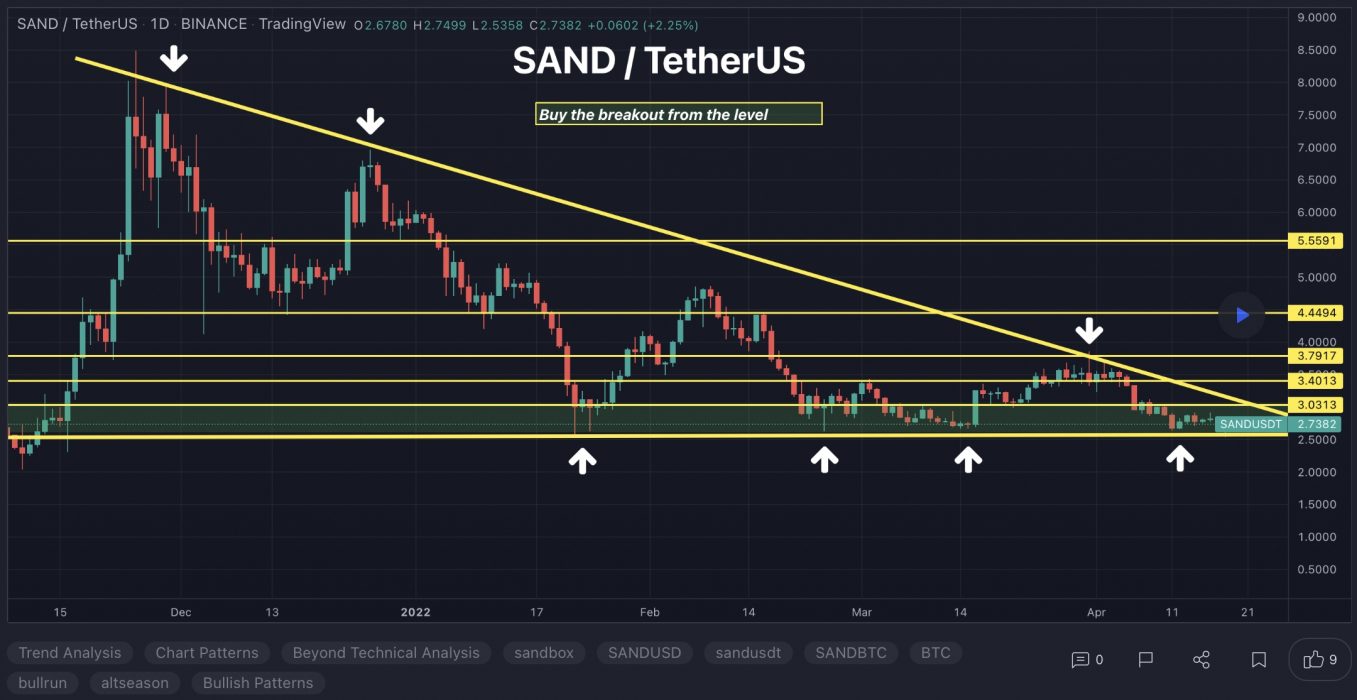
At the time of writing, SAND is ranked the 34th cryptocurrency globally and the current price is US$3.19. Let’s take a look at the chart below for price analysis:

Source: TradingView

SAND‘s impressive gains during February halted at $5.04 before retracing 68% of the move. This price action created several areas of possible higher-timeframe resistance in the process.

The price found resistance on its last swing upward near $3.68 – an area that could provide resistance again. If this swing high breaks, the price might find resistance near $3.89. If this area does provide resistance, it would suggest the formation of a higher-timeframe consolidation.

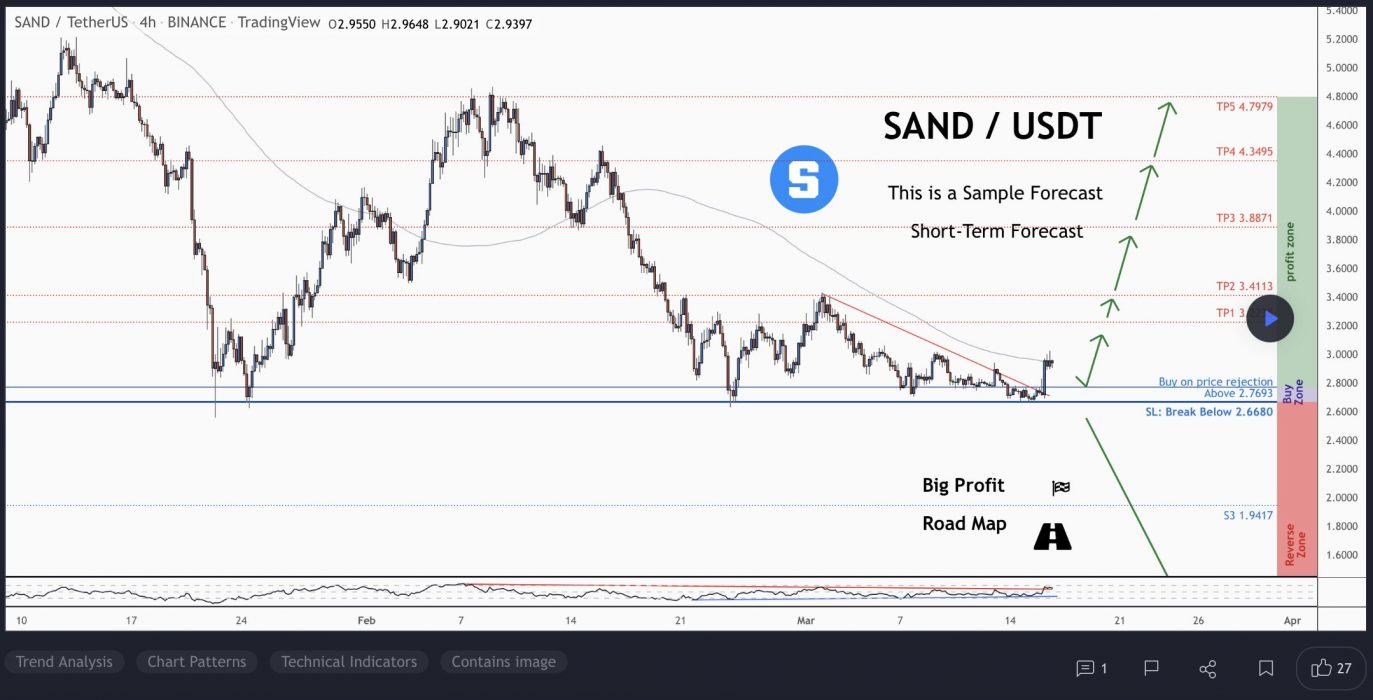
The fast move up left little higher-timeframe support. However, a vast zone between $3.11 and $3.02 has provided support before and could give support again on a retest. This zone is between the 61.8%-to-78.6% retracement levels of 2021 Q4’s parabolic move.

Inside this zone, the consolidation high near $2.90 to $2.82 might see more sensitivity and mark the bearish target.

Continuation downward through this level, especially if the overall market remains bearish, could retrace most of Q4’s move to the next higher-timeframe support near $2.67.

2. Eos (EOS)

EOS is a platform designed to allow developers to build decentralised apps. The project’s goal is relatively simple: to make it as straightforward as possible for programmers to embrace blockchain technology and ensure the network is easier to use than rivals. As a result, tools and a range of educational resources are provided to support developers who want to build functional apps quickly. EOS also aims to improve the experience for users and businesses. While the project tries to deliver greater security and less friction for consumers, it also vies to unlock flexibility and compliance for enterprises.

EOS Price Analysis

At the time of writing, EOS is ranked the 50th cryptocurrency globally and the current price is US$2.07. Let’s take a look at the chart below for price analysis:

Source: TradingView

EOS has been in an overall decline for the past 10 months and has reached 87% below its mid-May 2021 high.

Just above the current price, near $2.12, might be the bears’ first line of resistance in the upcoming weeks. This level is near the 9 EMA and consolidation highs that formed after the low sweep at $1.98.

Resistance could be found between $2.23 and $2.39, with the lower half of this range possibly proving stronger. This range has confluence with the 40 EMA and accumulation area for the early February run on bears’ stops.

While less likely, a more extended rally might reach probable resistance near $2.57. This area is in the upper half of a significant consolidation area on higher-timeframe charts.

Bulls might find support beginning near $1.79. However, $1.63 to $1.48 could offer a higher probability of a short-term bottom before a more substantial bounce. Higher timeframes show inefficient trading in this zone, as well as in another possible support beginning near $1.35.

3. Linear (LINA)

Linear LINA is a decentralised delta-one asset protocol capable of instantly creating synthetic assets with unlimited liquidity. The project opens traditional assets like commodities, forex, market indices, and other thematic sectors to cryptocurrency users by supporting the creation of “Liquids”, Linear’s synthetic asset tokens. LINA is an ERC-20 token built on the Ethereum network whose main purpose is as collateral for Liquids (using Buildr), and for community governance of the protocol.

LINA Price Analysis

At the time of writing, LINA is ranked the 454th cryptocurrency globally and the current price is US$0.02014. Let’s take a look at the chart below for price analysis:

Source: TradingView

During Q1, LINA retraced almost 58%, breaking key swing lows early to mid-month. This could provide a solid support for swing traders.

The swing high near $0.02836 stands out as a bullish target and marks an area of probable resistance. Further continuation could reach into possible resistance starting near $0.03657.

Even if the bearish trend continues, a stop run at the recent swing low near $0.01812 into possible support beginning near $0.01645 is reasonable. If the price reaches further down, the swing low and possible support near $0.01410 might provide another downside target. 

Learn How to Trade Live!

Join Dave and The Crypto Den Crew and they’ll show you live on a webinar how to take your crypto trading to the next level.

Where to Buy or Trade Altcoins?

These coins have high liquidity on Binance Exchange, so that could help with trading on AUD/USDT/BTC pairs. And if you’re looking at buying and HODLing cryptos, then Swyftx Exchange is an easy-to-use popular choice in Australia.

Categories
Cardano Crypto News Market Analysis Polkadot The Sandbox Trading

Top 3 Coins to Watch Today: ADA, DOT, SAND – February 23 Trading Analysis

Let’s take a closer look at today’s altcoins showing breakout signals. We’ll explain what the coin is, then dive into the trading charts and provide some analysis to help you decide.

1. Cardano (ADA)

Cardano ADA is a proof-of-stake blockchain platform whose stated goal is to allow “changemakers, innovators, and visionaries” to bring about positive global change. The open-source project also aims to “redistribute power from unaccountable structures to the margins to individuals”, helping to create a society that is more secure, transparent, and fair. Cardano is used by agricultural companies to track fresh produce from field to fork, while other products built on the platform allow educational credentials to be stored in a tamper-proof way, and retailers to clamp down on counterfeit goods.

ADA Price Analysis

At the time of writing, ADA is ranked the 7th cryptocurrency globally and the current price is US$0.8693. Let’s take a look at the chart below for price analysis:

Source: TradingView

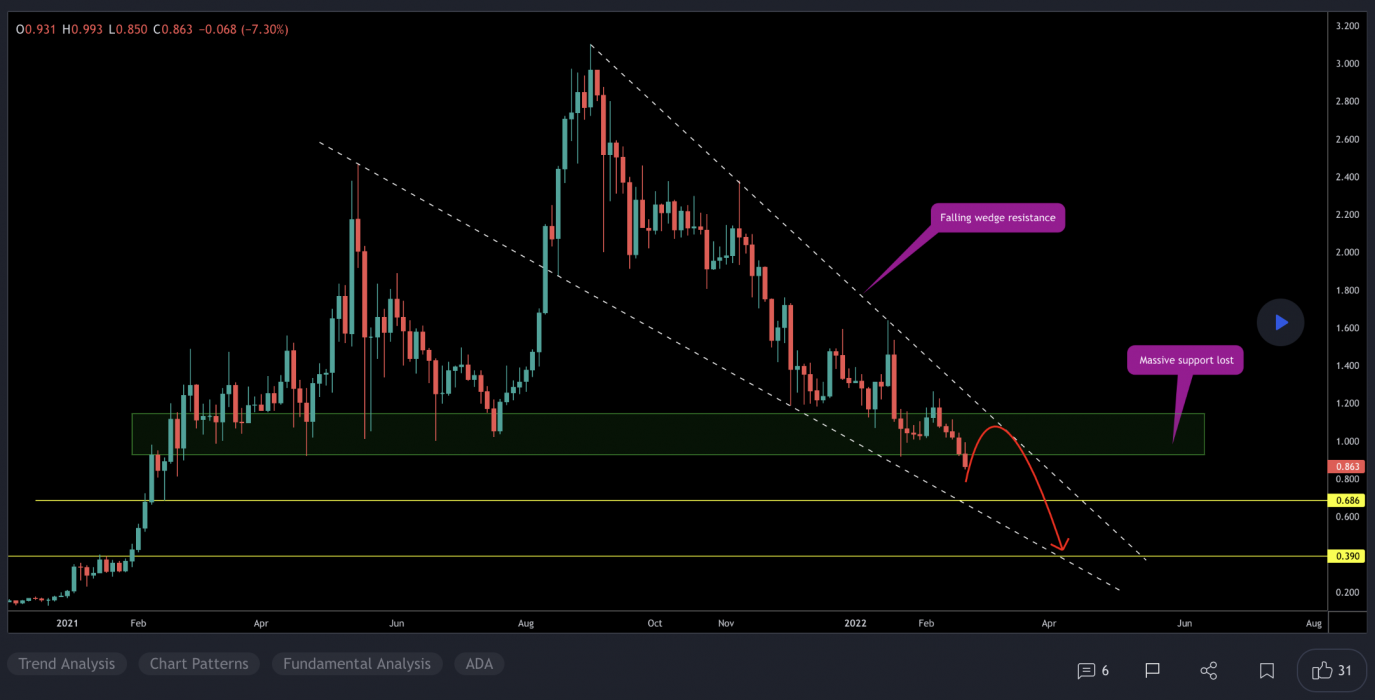
ADA‘s nearly 60% drop from its mid-January highs found a low near $0.8435 last week before closing over a short-term high.

This daily close over the high could signal a shift in market structure that may reach probable resistance near $0.9125. A sustained bullish move may target the swing high at $0.9535. If this stop run occurs, a run beyond the high into probable resistance near $1.12 and $1.21 is possible.

Bulls could buy a retracement to possible support near $0.8640, just above the weekly open. A bearish turn in the marketplace may propel the price toward possible support near $0.8325. 

However, relatively equal lows near $0.8057 and $0.7822 provide an attractive target for bears if the market resumes its bearish trend. A run on these lows might find support between $0.7647 and $0.7592.

2. Polkadot (DOT)

Polkadot DOT is an open-source sharding multichain protocol that facilitates the cross-chain transfer of any data or asset types, not just tokens, thereby making a wide range of blockchains interoperable with each other. Polkadot’s native DOT token serves three clear purposes: providing network governance and operations, and creating parachains by bonding. The Polkadot protocol connects public and private chains, permissionless networks, oracles and future technologies, allowing these independent blockchains to trustlessly share information and transactions through the Polkadot relay chain.

DOT Price Analysis

At the time of writing, DOT is ranked the 13th cryptocurrency globally and the current price is US$16.26. Let’s take a look at the chart below for price analysis:

Source: TradingView

DOT has retraced nearly 75% since its high in early January, showing little sign of interest from buyers.

February’s consolidation at possible support from $19.68 to $20.57 broke down with the rest of the market last week, turning this into likely resistance on future retests. This area now has confluence with the 9 and 18 EMAs.

If market conditions turn and this resistance breaks, an area near the midpoint of December’s consolidation range and the 2021 open, near $26.70, and the high of December’s consolidation range, near $29.88, might see profit-taking from bulls.

The first test of possible support near $15.40 showed some sensitivity. Still, continued bearishness in the market will likely cause a break of this level.

A break of this support might continue to drop to the next possible support near $14.56, running stops under July’s swing low. 

If this level gives support and begins a consolidation forming a bottom, bulls might wait for a wick below to possible support from $13.16 to $11.47 at the high of 2020’s consolidation range.

3. The Sandbox (SAND)

The Sandbox SAND is a blockchain-based virtual world allowing users to create, build, buy and sell digital assets in the form of a game. By combining the powers of decentralised autonomous organisations (DAOs) and non-fungible tokens (NFTs), the Sandbox creates a decentralised platform for a thriving gaming community. The Sandbox employs the powers of blockchain technology by introducing the SAND utility token, which facilitates transactions on the platform.

SAND Price Analysis

At the time of writing, SAND is ranked the 37th cryptocurrency globally and the current price is US$3.12. Let’s take a look at the chart below for price analysis:

Source: TradingView

SAND‘s impressive rally during Q4 halted at $8.45 before retracing 80% of the move. This price action created several areas of possible higher-timeframe resistance in the process.

The price found resistance on its last swing upward near $3.67 – an area that could provide resistance again. If this swing high breaks, the price might find resistance near $3.90. If this area does provide resistance, it would suggest the formation of a higher-timeframe consolidation.

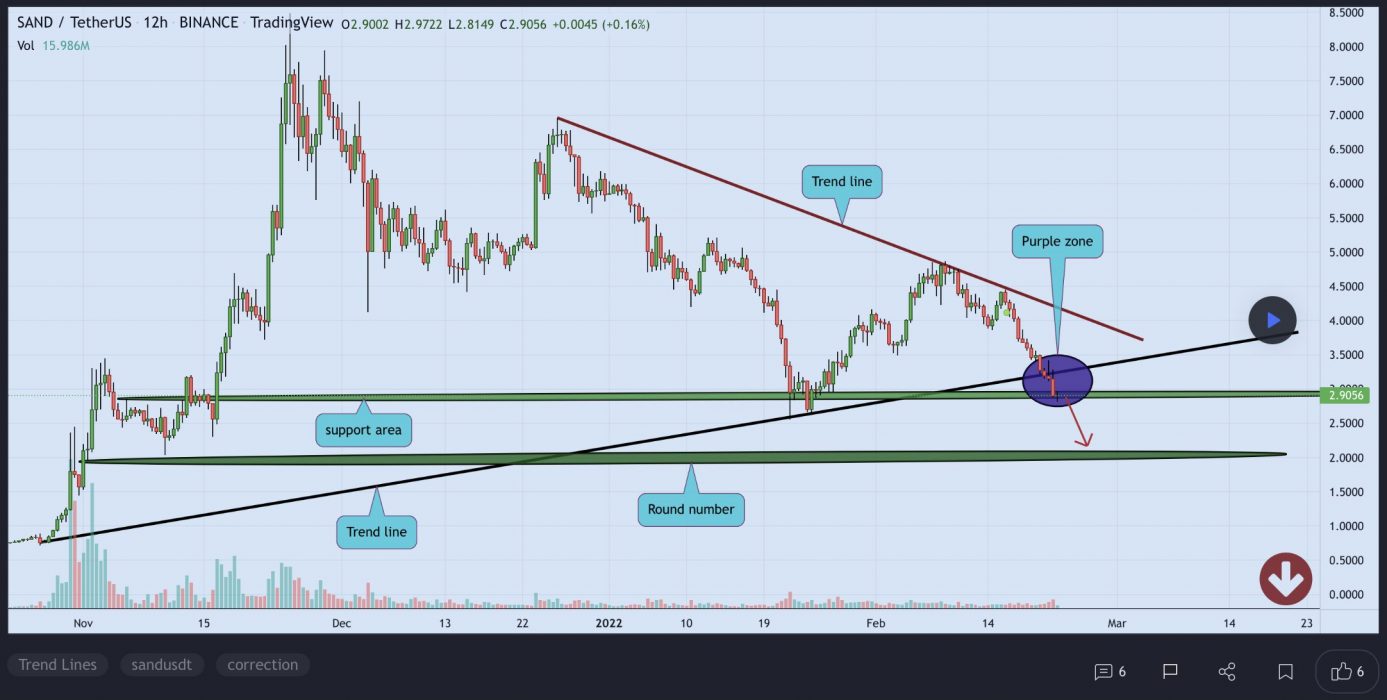
The fast move up left little higher-timeframe support. However, a vast zone between $3.12 and $3.00 has provided support before and could give support again on a retest. This zone is between the 61.8%-to-78.6% retracement levels of Q4’s parabolic move.

Inside this zone, the consolidation high near $2.89 to $2.80 might see more sensitivity and mark the bearish target.

Continuation downward through this level, especially if the overall market remains bearish, could retrace most of Q4’s move to the next higher-timeframe support near $2.60.

Learn How to Trade Live!

Join Dave and The Crypto Den Crew and they’ll show you live on a webinar how to take your crypto trading to the next level.

Where to Buy or Trade Altcoins?

These coins have high liquidity on Binance Exchange, so that could help with trading on AUD/USDT/BTC pairs. And if you’re looking at buying and HODLing cryptos, then Swyftx Exchange is an easy-to-use popular choice in Australia.