Categories
Ankr Crypto News Market Analysis NEO The Graph Trading

Top 3 Coins to Watch Today: ANKR, GRT, NEO – August 12 Trading Analysis

Let’s take a closer look at today’s altcoins showing breakout signals. We’ll explain what the coin is, then dive into the trading charts and provide some analysis to help you decide.

1. Ankr (ANKR)

ANKR originated as a solution that utilises shared resources in order to provide easy and affordable blockchain node hosting solutions, and has since built a marketplace for container-based cloud services through the usage of shared resources. It is a platform that enables the sharing economy, where any customer can access resources at a more affordable rate while also providing enterprises with the ability to monetise their spare computing power. It is unique in the way that it is the first to use trusted hardware, and this ensures a high level of security.

ANKR Price Analysis

At the time of writing, ANKR is ranked the 90th cryptocurrency globally and the current price is US$0.04992. Let’s take a look at the chart below for price analysis:

Source: TradingView

ANKR continues to set monthly lows in its downward trend. Support might be found in the daily gap above the monthly open near $0.04295, though a deeper retracement is likely to target the relatively equal lows into support near $0.03925. 

The daily gap near $0.03766 could also provide support. However, another gap inside the down candles, around $0.03421, provides the highest chances of solid support while offering a high risk-reward entry.

There is currently no resistance overhead since the price is in discovery. Extensions hint at the areas around $0.05932 and $0.06570 as reasonable take-profit zones.

2. The Graph (GRT)

The Graph GRT is an indexing protocol for querying data for networks like Ethereum and IPFS, powering many applications in both DeFi and the broader Web3 ecosystem. Anyone can build and publish open APIs, called subgraphs, that applications can query using GraphQL to retrieve blockchain data. GRT is a work token that is locked up by Indexers, Curators and Delegators in order to provide indexing and curating services to the network.

GRT Price Analysis

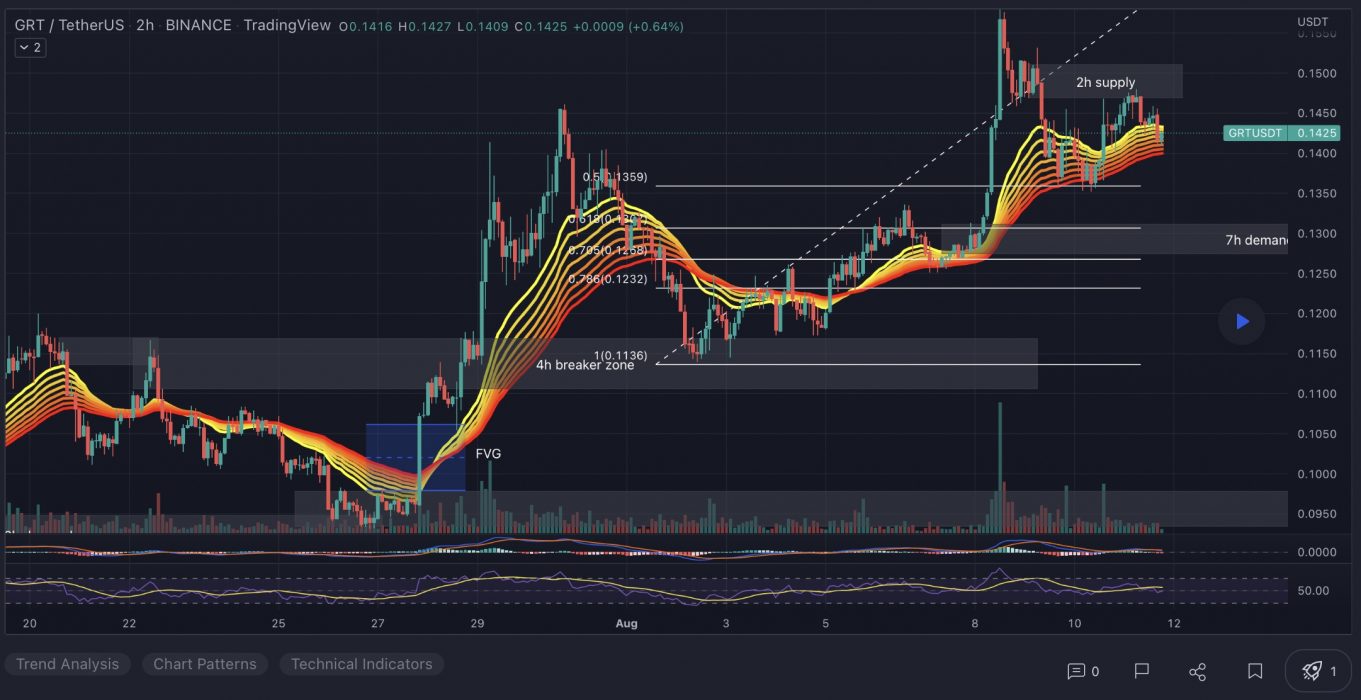
At the time of writing, GRT is ranked the 55th cryptocurrency globally and the current price is US$0.1415. Let’s take a look at the chart below for price analysis:
Source: TradingView

GRT‘s 80% retracement during Q2 set a low near $0.09547 during its consolidation that began in early June.

Relatively equal highs near $0.1635 could be the current target if the price breaks through resistance beginning near $0.1858. Bullish continuation may reach through the next significant swing high near $0.2038 into the daily gap near $0.2473. If bullish strength continues, the zones just below the previous monthly highs near $0.2643 and $0.2712 could halt any retracement.

A bearish shift in the market may seek the relatively equal lows near $0.1236 into possible support near $0.1187. If this down move occurs, the swing low near $0.09742 and possible support near $0.09124 may be the primary objective.

3. Neo (NEO)

NEO bills itself as a “rapidly growing and developing” ecosystem with the goal of becoming the foundation for the next generation of the internet – a new economy where digitised payments, identities and assets come together. As well as drawing a worldwide community of developers who create new infrastructure for the network and lower barriers to entry, the team behind this project operates an EcoBoost initiative that’s designed to encourage people to build decentralised apps and smart contracts on its blockchain.

NEO Price Analysis

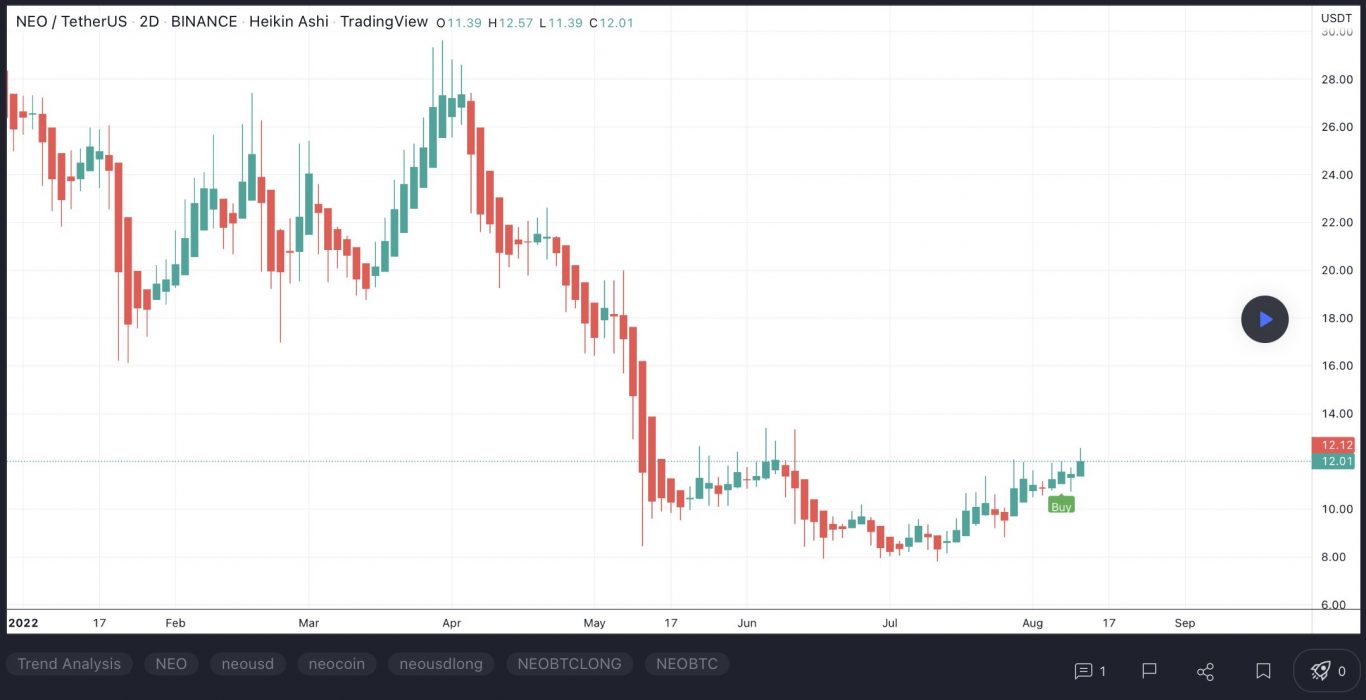
At the time of writing, NEO is ranked the 63rd cryptocurrency globally and the current price is US$11.93. Let’s take a look at the chart below for price analysis:
Source: TradingView

After creating a second equal low during Q2, NEO has gained nearly 25% into resistance that starts near $14.24.

Aggressive bulls looking for a continuation to the nearest cluster of relatively equal highs around $15.33 might look for bids near $12.86. More significant resistance rests above, near $16.00. A group of significant swing highs at $16.76 and $17.49 give possible targets if this resistance breaks.

A stop run on the recent low at $10.09 into possible support beginning near $9.63 may see stronger bidding. This area also has a confluence with the previous monthly low.

A bearish market shift could reach the swing low at $8.30 into possible support beginning near $7.84.

Learn How to Trade Live!

Join Dave and The Crypto Den Crew and they’ll show you live on a webinar how to take your crypto trading to the next level.
Where to Buy or Trade Altcoins?

These coins have high liquidity on Binance Exchange, so that could help with trading on AUD/USDT/BTC pairs. And if you’re looking at buying and HODLing cryptos, then Swyftx Exchange is an easy-to-use popular choice in Australia.

Categories
Crypto News Fantom Litecoin Market Analysis The Sandbox Trading

Top 3 Coins to Watch Today: LTC, FTM, SAND – August 11 Trading Analysis

Let’s take a closer look at today’s altcoins showing breakout signals. We’ll explain what the coin is, then dive into the trading charts and provide some analysis to help you decide.

1. Litecoin (LTC)

Litecoin LTC is a cryptocurrency designed to provide fast, secure and low-cost payments by leveraging the unique properties of blockchain technology. The cryptocurrency was created based on the Bitcoin protocol but it differs in terms of the hashing algorithm used, hard cap, block transaction times, and a few other factors. Litecoin has a block time of just 2.5 minutes and extremely low transaction fees, making it suitable for micro-transactions and point-of-sale payments.

LTC Price Analysis

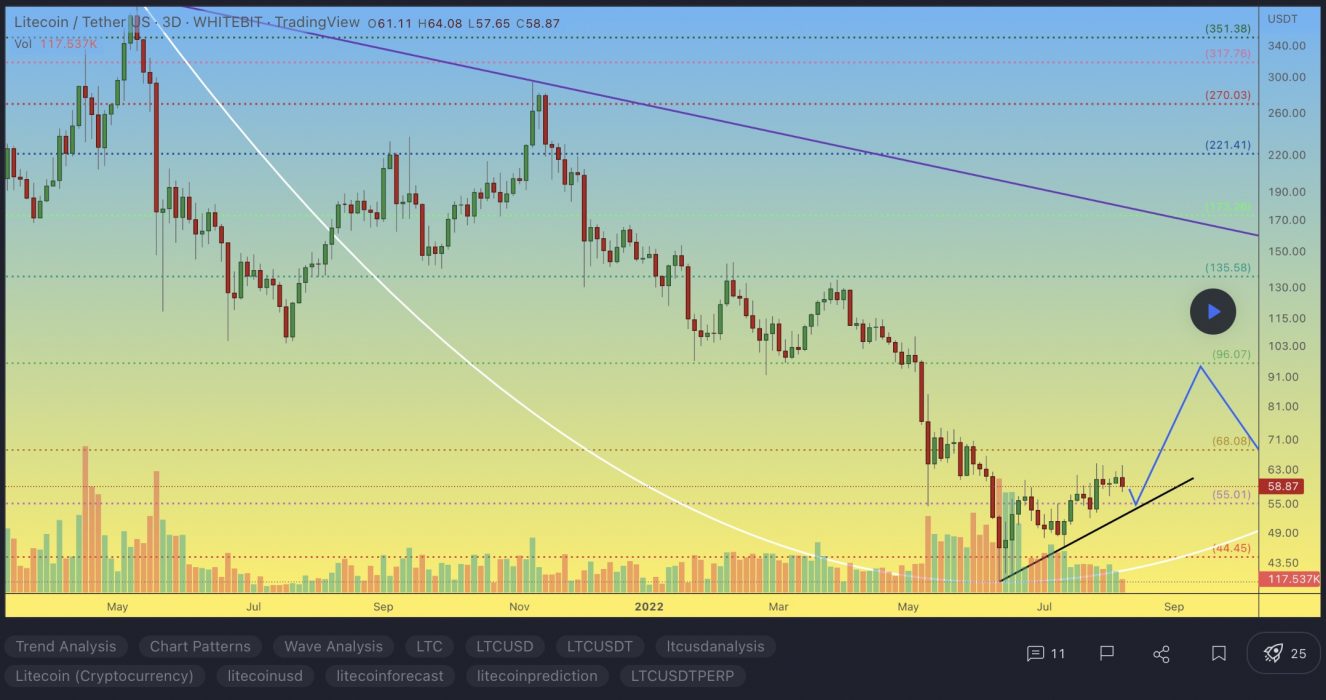
At the time of writing, LTC is ranked the 22nd cryptocurrency globally and the current price is US$62.03. Let’s take a look at the chart below for price analysis:

Source: TradingView

After setting a low last month, LTC kicked off a with recovery trend to break the weekly highs. The following 70% plummet found support near $44.36, sweeping under the 40 EMA into the 65.8% retracement level before bouncing to resistance beginning at $65.73.

This area could continue to provide resistance, possibly causing a retracement to the 9 EMA and 18 EMA near $69.12, where aggressive bulls might begin bidding. The level near $76.18, which has confluence with the 40 EMA, may see more interest from bulls loading up for an attempt on probable resistance beginning near $82.13. 

However, if Bitcoin continues its sideways trend, much lower prices could be seen. The old support near $56.18 could provide at least a short-term bounce. If this level fails, the old monthly lows near $48.65 may also give support and see the start of a new bullish cycle after retesting these support levels.

2. Fantom (FTM)

Fantom FTM is a directed acyclic graph (DAG) smart contract platform providing decentralised finance (DeFi) services to developers using its own bespoke consensus algorithm. Together with its in-house token FTM, Fantom aims to solve problems associated with smart-contract platforms – specifically transaction speed, which developers say they have reduced to under two seconds.

FTM Price Analysis

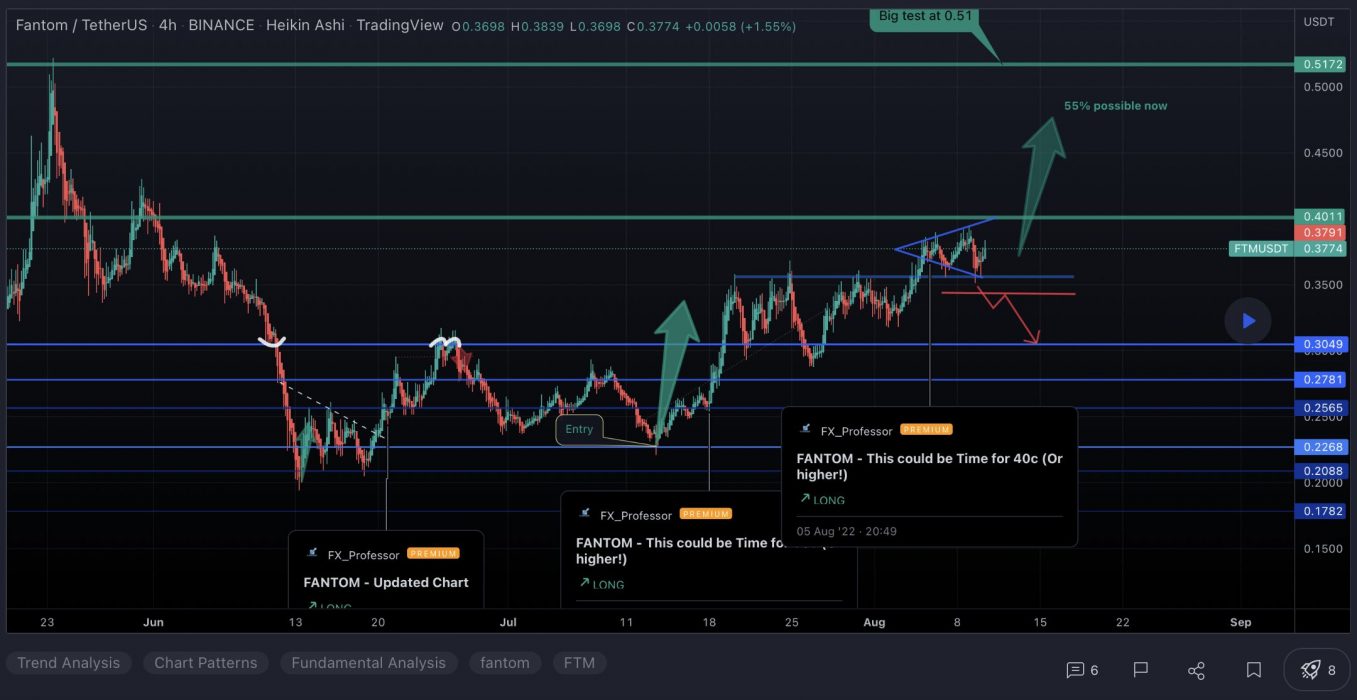
At the time of writing, FTM is ranked the 53rd cryptocurrency globally and the current price is US$0.4118. Let’s take a look at the chart below for price analysis:

Source: TradingView

FTM‘s bounce during Q2 ran into resistance near the old monthly highs. This rejection created a set of relatively equal highs near $0.5067, possibly forming the next bullish leg’s target.

Currently, the price is testing possible support near the weekly open, around $0.3865. This level also has confluence with the 80.6% retracement of the current local range and the 18 and 40 EMAs. 

If this level fails to provide support, a zone from $0.3574 to $0.3320 might mark a possible swing low or consolidation area. This zone is between the 65.8% and 78.6% retracement of August 2021’s swing.

A more bearish tone in the market could propel the price lower. The lows, near $0.3070, may mark an area of possible support as well as a bearish target.

3. The Sandbox (SAND)

The Sandbox SAND is a blockchain-based virtual world allowing users to create, build, buy and sell digital assets in the form of a game. By combining the powers of decentralised autonomous organisations (DAOs) and non-fungible tokens (NFTs), the Sandbox creates a decentralised platform for a thriving gaming community. The Sandbox employs the powers of blockchain technology by introducing the SAND utility token, which facilitates transactions on the platform.

SAND Price Analysis

At the time of writing, SAND is ranked the 37th cryptocurrency globally and the current price is US$1.34. Let’s take a look at the chart below for price analysis:

Source: TradingView

SAND‘s impressive gains during Q1 halted at $3.00 before retracing 85% of the move. This price action created several areas of possible higher-timeframe resistance in the process.

The price found resistance on its last swing upward near $1.40 – an area that could provide resistance again. If this swing high breaks, the price may find resistance near $1.58. If this area does provide resistance, it would suggest the formation of a higher-timeframe consolidation.

The fast move up left little higher-timeframe support. However, a vast zone between $1.28 and $1.24 has provided support before and could give support again on a retest. This zone is between the 71.8%-to-88.6% retracement levels of 2021 Q4’s parabolic move.

Continuation downward through this level, especially if the overall market remains bearish, could retrace most of Q2’s move to the next higher-timeframe support near $1.10.

Learn How to Trade Live!

Join Dave and The Crypto Den Crew and they’ll show you live on a webinar how to take your crypto trading to the next level.

Where to Buy or Trade Altcoins?

These coins have high liquidity on Binance Exchange, so that could help with trading on AUD/USDT/BTC pairs. And if you’re looking at buying and HODLing cryptos, then Swyftx Exchange is an easy-to-use popular choice in Australia.

Categories
Basic Attention Token Crypto News Internet Computer Market Analysis Stellar Trading

Top 3 Coins to Watch Today: XLM, BAT, ICP – August 10 Trading Analysis

Let’s take a closer look at today’s altcoins showing breakout signals. We’ll explain what the coin is, then dive into the trading charts and provide some analysis to help you decide.

1. Stellar (XLM)

Stellar XLM is an open network that allows money to be moved and stored. When it was released, the goal was boosting financial inclusion by reaching the world’s unbanked – but soon after, its priorities shifted to helping financial firms connect with one another via blockchain technology. The network’s native token, lumens, serves as a bridge that makes it less expensive to trade assets across borders. All of this aims to challenge existing payment providers who often charge high fees for a similar service.

XLM Price Analysis

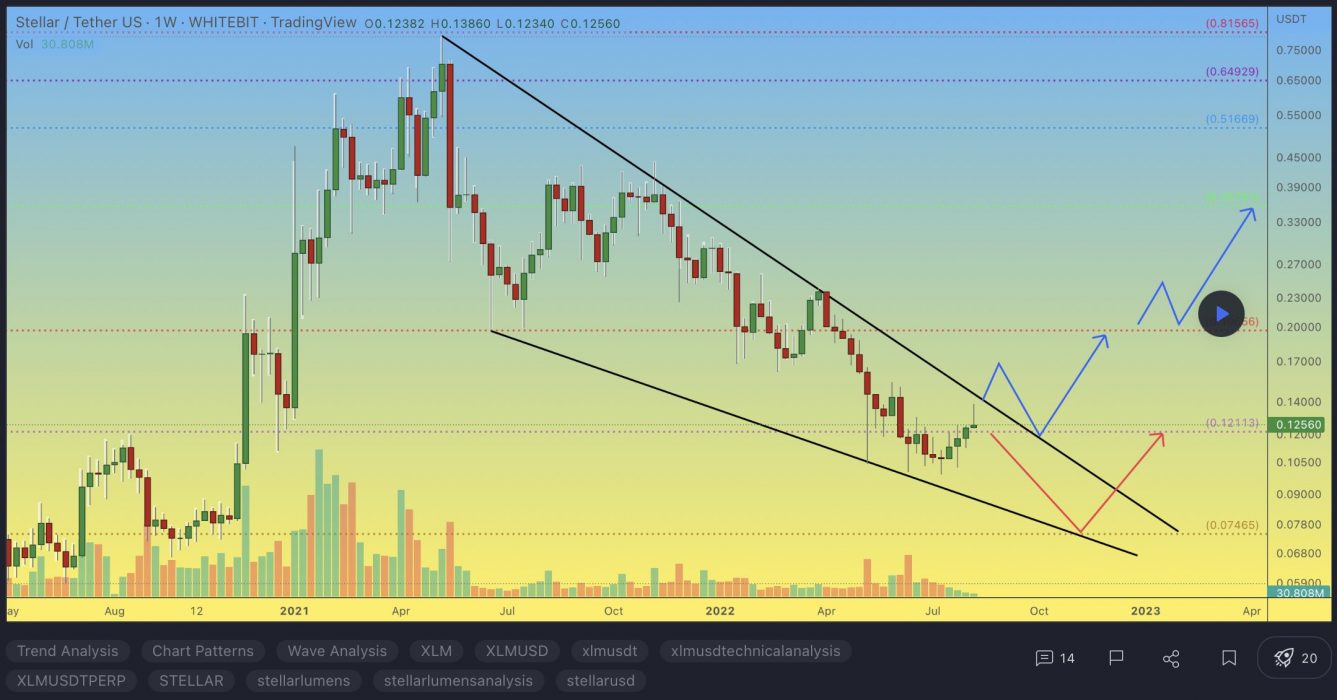
At the time of writing, XLM is ranked the 27th cryptocurrency globally and the current price is US$0.1225. Let’s take a look at the chart below for price analysis:

Source: TradingView

XLM set a high near $0.2457 in Q2 before retracing nearly 80% to find a low near $0.1038. The price consolidated around this level before the strong bullish impulse over the past several days.

Probable resistance near $0.1320 is slowing the bullish advance down. However, another leg may target the last swing high at $0.1426 and relatively equal highs at $0.1530. Resistance near $0.1659 could cap the move before the second swing high. Beyond these levels, little stands in the bulls’ way before reaching the swing high near $0.1846.

A retracement before a move higher might find support in the daily gap near $0.1204, just above the weekly open. Relatively equal lows near $0.1135 could also provide support. Run-on stops at $0.1064 and $0.09574 may find support in the gap beginning near $0.08912.

Basic Attention Token BAT is the token that powers a new blockchain-based digital advertising platform designed to fairly reward users for their attention while providing advertisers with a better return on their ad spend. The Basic Attention Token itself is the unit of reward in this advertising ecosystem and is exchanged between advertisers, publishers and users. Advertisers pay for their advertising campaigns in BAT tokens. Out of this budget, a small portion is distributed to advertisers, while 70% is distributed to users – whereas the intermediaries that typically drive up advertising costs are cut out of the equation to improve cost-efficiency.

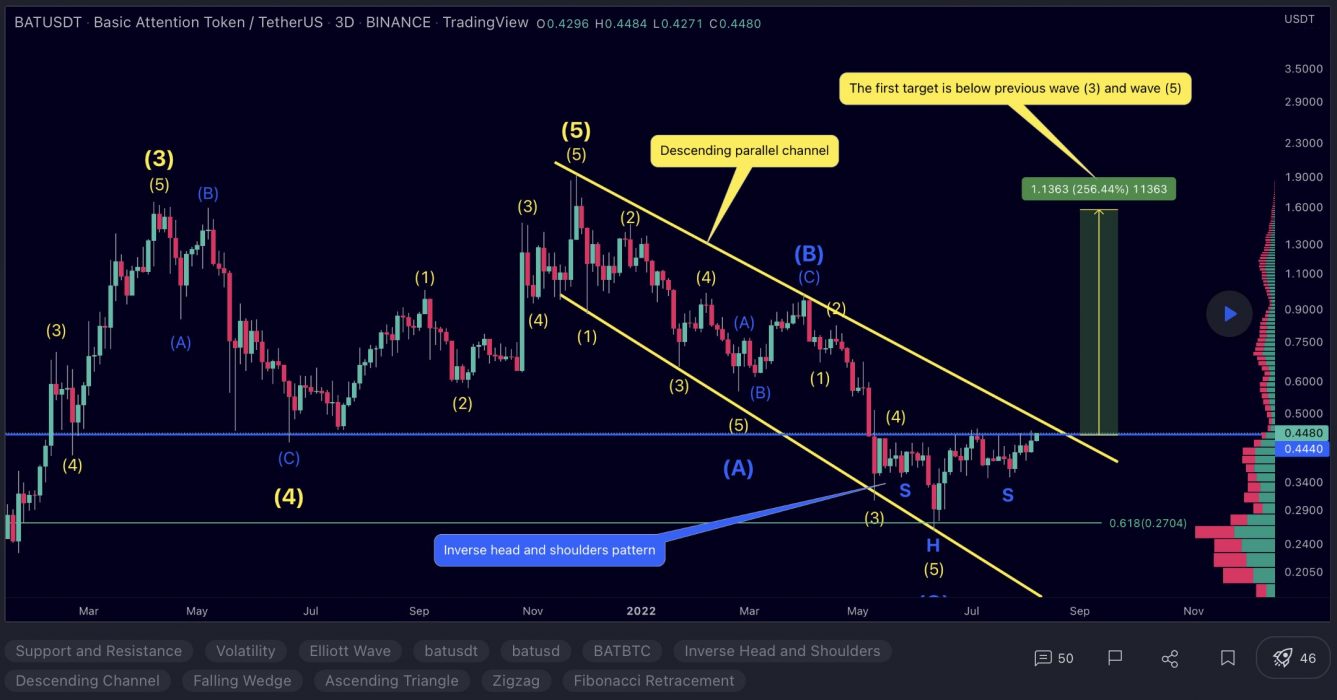
At the time of writing, BAT is ranked the 67th cryptocurrency globally and the current price is US$0.4518. Let’s take a look at the chart below for price analysis:

Source: TradingView

BAT has dropped nearly 75% from its Q2 2022 high and 89% from its November 2021 all-time high.

Support might have formed last week from $0.3734 to $0.4065 and should hold if bulls are ready for a bounce. This zone overlaps with an inefficiently traded area on the weekly chart from $0.3653 to $0.3394.

If this level breaks, bears may target an inefficiently traded area on the monthly chart from $0.3147 to $0.3032. Below this level, $0.2845 to $0.2780 could provide support after a run on bulls’ stops under the Q4 2020 lows into an area of significant accumulation.

The closest resistance begins near $0.4983. This level has confluence with the 9 EMA and a brief consolidation before May 11’s spike downward.

A more significant rally might find resistance near $0.5540. This level is inefficiently traded and has confluence with the lows of last summer’s accumulation and the 18 EMA.

If the market becomes more bullish, $0.6245 may provide the next resistance. This level is slightly above the May monthly open, overlaps with multiple old lows, and aligns with the 40 EMA.

3. Internet Computer (ICP)

The Internet Computer ICP is the world’s first blockchain that runs at web speed with unbounded capacity. It also represents the third major blockchain innovation, alongside Bitcoin and Ethereum. The Internet Computer scales smart contract computation and data, runs them at web speed, processes and stores data efficiently, and provides powerful software frameworks to developers. By making this possible, it enables the complete re-imagination of software, providing a revolutionary new way to build tokenised internet services, pan-industry platforms, decentralised financial systems, and even traditional enterprise systems and websites.

ICP Price Analysis

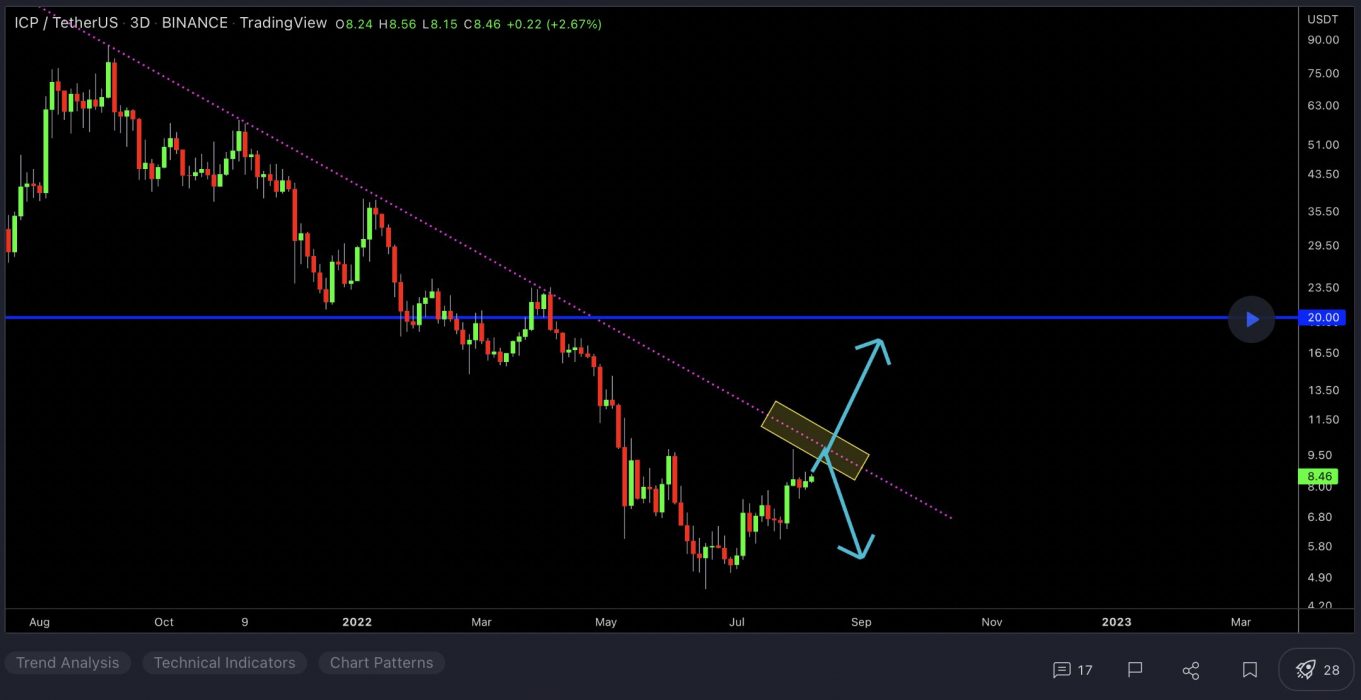
At the time of writing, ICP is ranked the 35th cryptocurrency globally and the current price is US$7.83. Let’s take a look at the chart below for price analysis:

Source: TradingView

ICP has dropped 60% from its most recent Q2 high as it continues its nine-month downtrend. The edge of the recent swing’s lower candle bodies could provide the closest support, near $6.42. This level overlaps with the 100% extension of June’s opening rally.

Currently, the price is testing possible resistance near $8.20. This level has confluence with the 9 EMA. It is unclear if it will hold as resistance, but it’s reasonable to anticipate a run above bears’ stops at $8.75.

If the price breaks through this resistance, it may find its next resistance near $8.97. This level is near the midpoint of May 12’s swing low and the midpoint of an inefficiently traded area on the weekly chart.

A rally this high may reach slightly higher, near $9.15. This area formed the base of the June opening rally, shows inefficient trading on the daily chart, and is at the low end of May’s accumulation range.

Below, there is no historical price action to suggest possible support. The next downside targets may be near $6.70 and $5.92. These approximate levels are near the 150% and 200% extensions of June’s opening rally.

Learn How to Trade Live!

Join Dave and The Crypto Den Crew and they’ll show you live on a webinar how to take your crypto trading to the next level.

Where to Buy or Trade Altcoins?

These coins have high liquidity on Binance Exchange, so that could help with trading on AUD/USDT/BTC pairs. And if you’re looking at buying and HODLing cryptos, then Swyftx Exchange is an easy-to-use popular choice in Australia.
Categories
Crypto News Ethereum Market Analysis Monero Trading

Top 3 Coins to Watch Today: ETH, XMR, WMT – August 9 Trading Analysis

Let’s take a closer look at today’s altcoins showing breakout signals. We’ll explain what the coin is, then dive into the trading charts and provide some analysis to help you decide.

1. Ethereum (ETH)

Ethereum ETH is a decentralised open-source blockchain system that features its own cryptocurrency, Ether. ETH works as a platform for numerous other cryptocurrencies, as well as for the execution of decentralised smart contracts. Ethereum’s own purported goal is to become a global platform for decentralised applications, allowing users from all over the world to write and run software that is resistant to censorship, downtime and fraud.

ETH Price Analysis

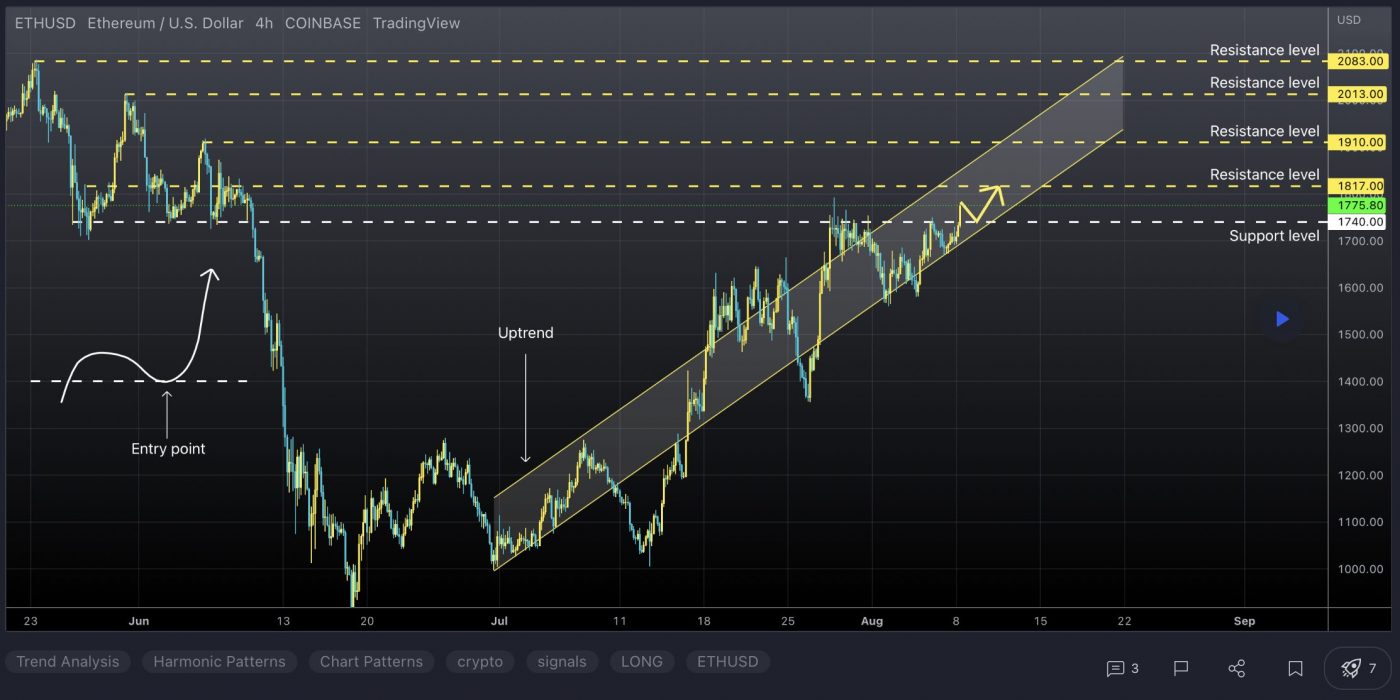
At the time of writing, ETH is ranked the 2nd cryptocurrency globally and the current price is US$1,775.14. Let’s take a look at the chart below for price analysis:

Source: TradingView

ETH is retracing its April to June decline. So far, it’s retraced approximately 25% of the drop in anticipation of September’s Merge.

A broad area of inefficient trading on the monthly chart, from $1,972.58 to $2,709.26, is likely to provide resistance. The upper half of this zone, beginning near $2,145.29, may provide stronger resistance. Here, inefficient trading on the weekly chart, old swing lows and the 50% retracement of H2 2022’s drop converge.

Closer to the current price, $1,784.79 to $1,859.84 may provide the next speedbump for bulls. This level is near the low of previous inefficient trading on the weekly chart in March 2021. It’s also just above more recent inefficient trading on the weekly and a recent daily swing high. 

A pocket of inefficient trading on the daily chart, from $1,685.26 to $1,662.79, may provide the closest support. Here, the 9 EMA and the midpoint of late July and early August’s bearish move converge. If the price continues to rally, the level may move higher midweek.

If this possible support fails, the next support might be near the 40 EMA, from $1,570.48 to $1,493.11. Old swing lows, previous inefficient trading on the weekly chart, and inefficient trading on the daily chart add confluence to this level.

A steeper drop may be aiming for stops under the daily swing low near $1,356.17. From $1,336.07 to $1,197.79, bulls may find support inside accumulation preceding inefficient trading on the weekly chart.

If the price drops below this level, it may be aiming for stops under June’s low. If so, bears may be targeting an area from $881.56 to $758.74. This zone marks the low end of inefficient trading on the monthly and weekly charts.

2. Monero (XMR)

Monero XMR allows transactions to take place privately and with anonymity. Even though it’s commonly thought that BTC can conceal a person’s identity, it’s often easy to trace payments back to their original source because blockchains are transparent. On the other hand, XMR is designed to obscure senders and recipients alike through the use of advanced cryptography. The team behind Monero says privacy and security are its biggest priorities, with ease of use and efficiency coming second. It aims to provide protection to all users, irrespective of how technologically competent they are.

XMR Price Analysis

At the time of writing, XMR is ranked the 29th cryptocurrency globally and the current price is US$166.39. Let’s take a look at the chart below for price analysis:

Source: TradingView

XMR is rallying to fill in pockets of inefficient trading left during its June decline. The closest resistance is at $167.80. This area of inefficient trading on the weekly and daily charts is near the 61.8% retracement of June’s move. It rejected the price on August 7, but the price is rechallenging it.

If it breaks, the next pocket of inefficient trading from $178.60 to $182.10 may be the next target. This zone is also near the high of inefficient trading on the weekly and the 78.6% retracement of June’s move.

In the longer term, bulls could be targeting bears’ stops above the significant weekly swing high near $204.50. This zone also shows inefficient trading on the monthly chart. If this resistance breaks, the next bullish target may be another area of inefficient trading on the weekly chart from $233.50 to $229.80.

The closest support could be near the current price, from $166.40 to $162.03. This area is at the end of July’s accumulation high.

If this level breaks, a drop under the August monthly open may find more buyers near $152.30. This area shows accumulation, would run bulls’ stops under recent swing lows, and fill in a tiny pocket of inefficient trading. It also has confluence with the high of previous inefficient trading on the weekly chart.

A steeper drop may reach inefficient trading on the weekly chart, from $135.70 to $133.80. This zone is also near the bottom of previous inefficient trading from June and lines up with old swing lows from Q1 2022.

3. World Mobile Token (WMT)

The World Mobile Token WMT is a digital token issued with the purpose of allowing participants to provide a service on the network and be rewarded accordingly for it. The primary role of WMT is to incentivise token holders who want to support the operation of the network by way of delegating their WMT stake to a node operator (stakers), as well as node operators who operate their own node. WMT is the utility token at the heart of World Mobile Chain, a solution developed in partnership between Input Output Global and World Mobile to democratise access to digital, financial and social services in Africa, the first of its kind to go the extra mile and connect the unconnected.

WMT Price Analysis

At the time of writing, WMT is ranked the 385th cryptocurrency globally and the current price is US$0.2242. Let’s take a look at the chart below for price analysis:

Source: TradingView

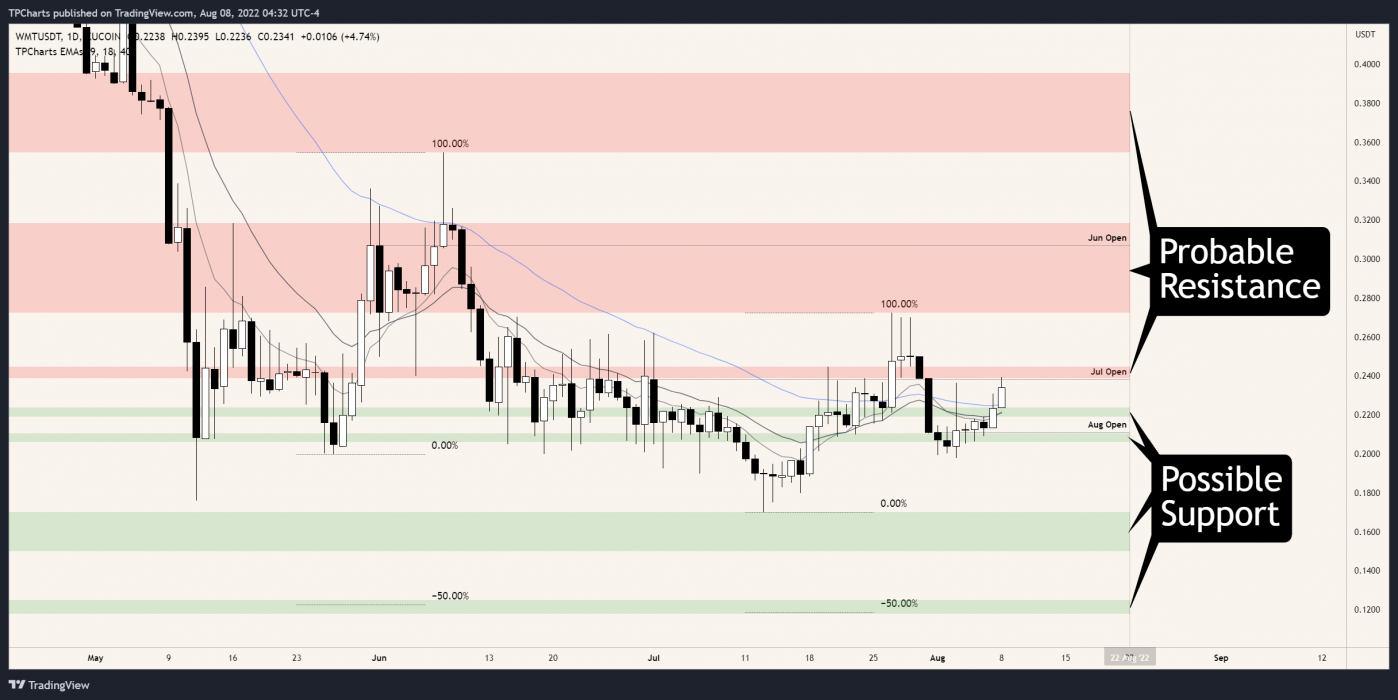
WMT has been consolidating since its 81% drop from March until mid-May. Currently, it is challenging resistance near a zone of inefficient trading on the daily chart from $0.2448 to $0.2389. This zone is near the July monthly open.

The price may be reaching for swing highs near $0.2724. Above these highs, several pockets of inefficient trading on the daily chart could continue drawing the price upward between roughly $0.2724 and $0.3186. Bulls may remain cautious about entering longer trades until they reclaim the high of this zone.

On a reclaim of this zone, bulls may aim for the swing high near $0.3548. This level, up to $0.3956, shows inefficient trading on the monthly and weekly charts that the price may want to fill.

The 9, 18 and 40 EMAs converge near $0.2238. This area may also show inefficient trading on the daily chart after Monday’s close and could provide the closest support for a rally.

Slightly lower, an area from $0.2106 to $0.2060 may also provide support. It’s near the current swing’s initial accumulation on the daily chart and the high of accumulation on the weekly chart.

If this level breaks, it could signal a more significant drop. No historical price action exists under July 13’s low, which may be the first target. Beyond this low, recent price swings’ 50% extensions align near $0.1250 and may provide the next downside targets.

Learn How to Trade Live!

Join Dave and The Crypto Den Crew and they’ll show you live on a webinar how to take your crypto trading to the next level.

Where to Buy or Trade Altcoins?

These coins have high liquidity on Binance Exchange, so that could help with trading on AUD/USDT/BTC pairs. And if you’re looking at buying and HODLing cryptos, then Swyftx Exchange is an easy-to-use popular choice in Australia.
Categories
Crypto News Decentraland Market Analysis PancakeSwap Quant Trading

Top 3 Coins to Watch Today: QNT, MANA, CAKE – August 8 Trading Analysis

Let’s take a closer look at today’s altcoins showing breakout signals. We’ll explain what the coin is, then dive into the trading charts and provide some analysis to help you decide.

1. Quant (QNT)

Quant QNT launched with the goal of connecting blockchains and networks on a global scale, without reducing the efficiency and interoperability of the network. It is the first project to solve the interoperability problem through the creation of the first blockchain operating system. The main aim of Quant – using Overledger – is to bridge the gap that exists between different blockchains. The backbone of the project is the Overledger network, which Quant bills as the ecosystem on which the future digital economy ecosystem will be built.

QNT Price Analysis

At the time of writing, QNT is ranked the 43rd cryptocurrency globally and the current price is US$127.72. Let’s take a look at the chart below for price analysis:

Source: TradingView

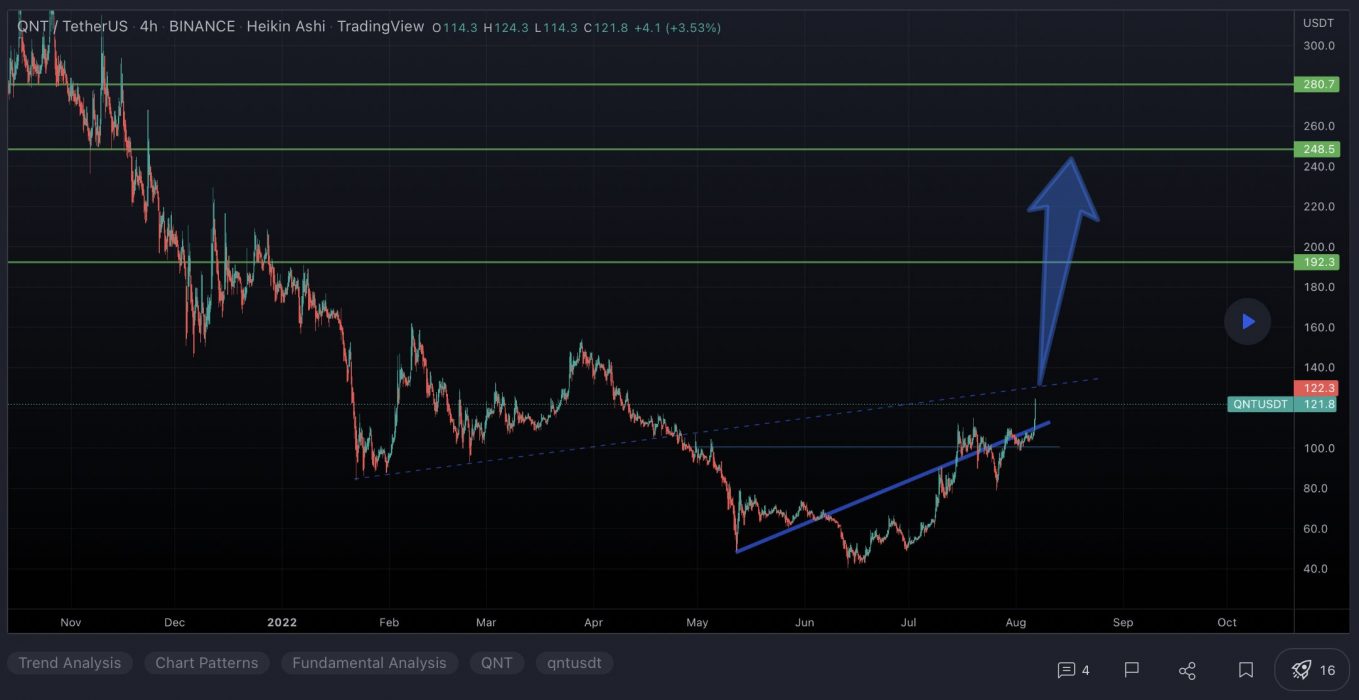
Q3 marked a turning point for QNT, with the price gaining almost 65% from its lows to probable resistance beginning near $140.30.

The price is currently struggling with the area between $128.80 and $110.33. This region could provide support after a close above, or resistance after a close below. 

A retracement could reach into the daily gap and possible support around $105.41. A more bearish shift in the marketplace will likely aim for the relatively equal lows near $97.65, and the potential support just below that begins around $90.34.

Continuation to the upside will likely target the monthly high near $136.19. However, probable resistance beginning at $150.77 and $162.30 could cap or slow down this move.

2. Decentraland (MANA)

Decentraland MANA defines itself as a virtual reality platform powered by the Ethereum blockchain that allows users to create, experience, and monetise content and applications. In this virtual world, users purchase plots of land that they can later navigate, build on and monetise. Decentraland uses two tokens: MANA and LAND. MANA is an ERC-20 token that must be burned to acquire non-fungible ERC-721 LAND tokens. MANA tokens can also be used to pay for a range of avatars, wearables, names and more on the Decentraland marketplace.

MANA Price Analysis

At the time of writing, MANA is ranked the 36th cryptocurrency globally and the current price is US$1.07. Let’s take a look at the chart below for price analysis:

Source: TradingView

MANA dropped 80% from Q1 to Q2 and made a low near $0.7800. It has consolidated above this low since June.

The price may find support between $0.9508 and $0.9037. This level saw accumulation on July 17, contains the 9 and 18 EMAs, and borders the July monthly open.

A deeper retracement could reach near $0.8790. A drop to this level would rebalance more inefficient trading on the daily chart. It could also run bulls’ stops below today’s opening price and July 16’s swing low.

The price is testing the closest resistance, at $1.18. Bears entered shorts here before last week’s drop. It’s also near the 40 EMA.

If this resistance breaks, $1.25 to $1.32 may provide the next resistance. This area is between the 61.8% and 78.6% retracement of the last month’s downtrend. Bulls also rejected bulls here in late June on the weekly chart.

A more significant rally might reach an area of inefficient trading on the monthly chart from $1.36 to $1.40. This move would sweep most bears’ trailed stops above relative equal highs up to this level. Yet, bulls aiming for this level may want to be cautious since the overall trend is still bearish. 

3. PancakeSwap (CAKE)

PancakeSwap CAKE is an automated market maker (AMM) – a decentralised finance (DeFi) application that allows users to exchange tokens, providing liquidity via farming and earning fees in return. PancakeSwap uses an automated market maker model where users trade against a liquidity pool. These pools are filled by users who deposit their funds into the pool and receive liquidity provider (LP) tokens in return. PancakeSwap allows users to trade BEP20 tokens, provide liquidity to the exchange and earn fees, stake LP tokens to earn CAKE, stake CAKE to earn more CAKE, and stake CAKE to earn tokens of other projects.

CAKE Price Analysis

At the time of writing, CAKE is ranked the 72nd cryptocurrency globally and the current price is US$4.40. Let’s take a look at the chart below for price analysis:

Source: TradingView

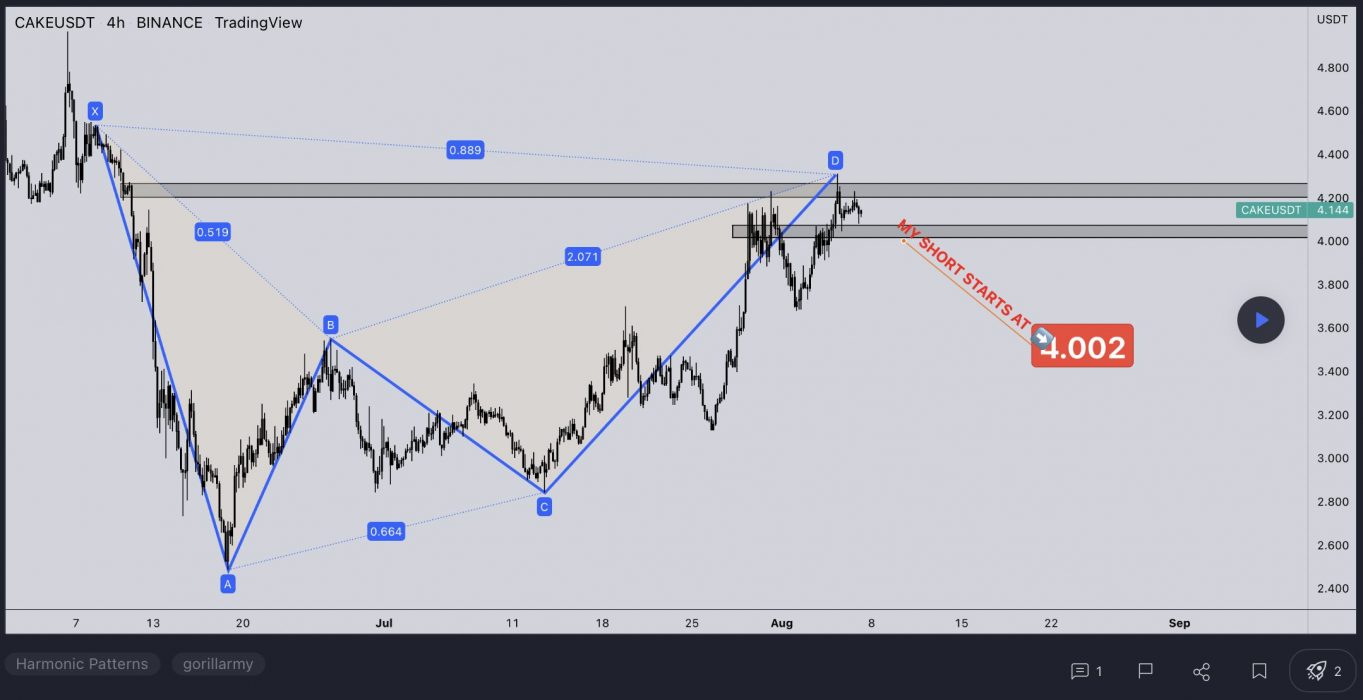
CAKE‘s 80% decline after Q2 created relatively equal lows near $3.05 before bouncing over the local range’s midpoint near $4.60. A bullish altcoin market could help CAKE bulls regain a stronger bullish trend.

Aggressive bulls could look for entries in the daily gap starting near $4.30. The monthly open aligns with more probable support near $3.22. 

A stop run below the monthly open near $3.15 might provide a more favourable entry. A more substantial bearish move – perhaps from a sharp drop in Bitcoin’s price – could challenge support near $3.00, just above the equal lows.

Resistance rests just above, with the zone from $4.75 to $4.90 likely to provide a short-term ceiling. A break through this level may target resistance just under the cluster of relatively equal highs near $5.12. 

Beyond these highs, resistance near $5.28 provides a final challenge before attacking an old daily swing high near $5.43.

Learn How to Trade Live!

Join Dave and The Crypto Den Crew and they’ll show you live on a webinar how to take your crypto trading to the next level.

Where to Buy or Trade Altcoins?

These coins have high liquidity on Binance Exchange, so that could help with trading on AUD/USDT/BTC pairs. And if you’re looking at buying and HODLing cryptos, then Swyftx Exchange is an easy-to-use popular choice in Australia.

Categories
Avalanche Crypto News Harmony Market Analysis Trading VeChain

Top 3 Coins to Watch Today: ONE, AVAX, VET – August 5 Trading Analysis

Let’s take a closer look at today’s altcoins showing breakout signals. We’ll explain what the coin is, then dive into the trading charts and provide some analysis to help you decide.

1. Harmony (ONE)

Harmony ONE is a blockchain platform designed to facilitate the creation and use of decentralised applications (DApps). The network aims to innovate the way decentralised applications work by focusing on random state sharding, which allows creating blocks in seconds. Harmony was expected to introduce cross-shard contracts and a cross-chain infrastructure by the end of 2021.

ONE Price Analysis

At the time of writing, ONE is ranked the 118th cryptocurrency globally and the current price is US$0.02215. Let’s take a look at the chart below for price analysis:

Source: TradingView

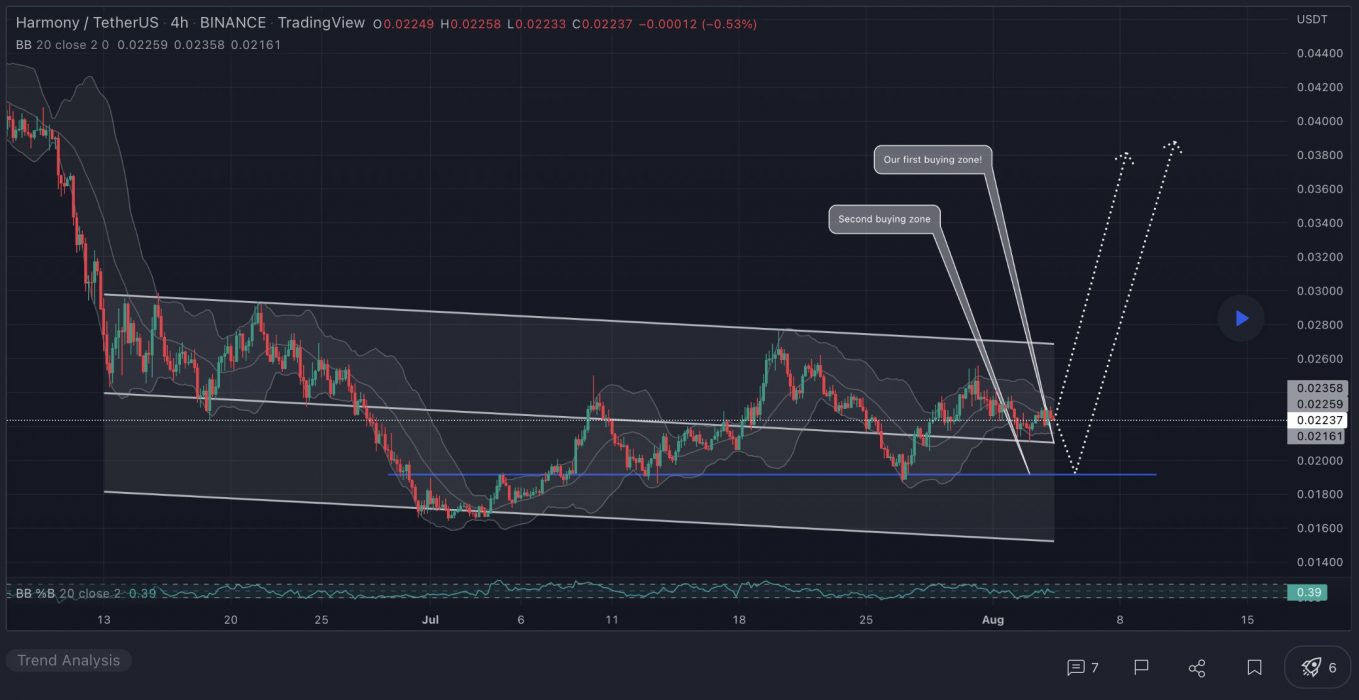
ONE bulls have had to endure a 80% drop since early Q2 until the price set a low and began a range in June.

Currently, the price is aggressively moving toward possible resistance, beginning near $0.02851. Stops above the swing high at $0.03215 might be the target before a downwards retracement. Multiple old lows mark this resistance, which is near the 77.6% retracement level of a recent significant bearish swing.

If the price continues through this high, it could be reaching for an inefficient area near $0.03542. Moving to this level would run bears’ stops above the swing high at the same level. A more substantial rally might reach an old swing high and inefficiently traded area between $0.03725 and $0.03938, which surrounds the yearly open.

If the price stays above the weekly low of $0.02035, this price could support a run above the $0.01965 swing high. Just below, at $0.01844, bulls might eye the consolidation high as more substantial support. This zone contains the 9 and 40 EMAs.

A deeper retracement might retest the accumulation area between $0.01735 and $0.01670. If this level breaks, bears may be targeting an inefficiently traded area on higher timeframes beginning near $0.01450. This area overlaps the 47% extension of a recent significant bearish swing.

2. Avalanche (AVAX)

Avalanche AVAX is the fastest smart contracts platform in the blockchain industry, as measured by time-to-finality, and has the most validators securing its activity of any proof-of-stake protocol. Avalanche is also low-cost, and green. Any smart contract-enabled application can outperform its competition on Avalanche. AVAX is the native token of Avalanche. It is a hard-capped, scarce asset that is used to pay for fees, secure the platform through staking, and provide a basic unit of account between the multiple subnets created on Avalanche.

AVAX Price Analysis

At the time of writing, AVAX is ranked the 14th cryptocurrency globally and the current price is US$23.18. Let’s take a look at the chart below for price analysis:

Source: TradingView

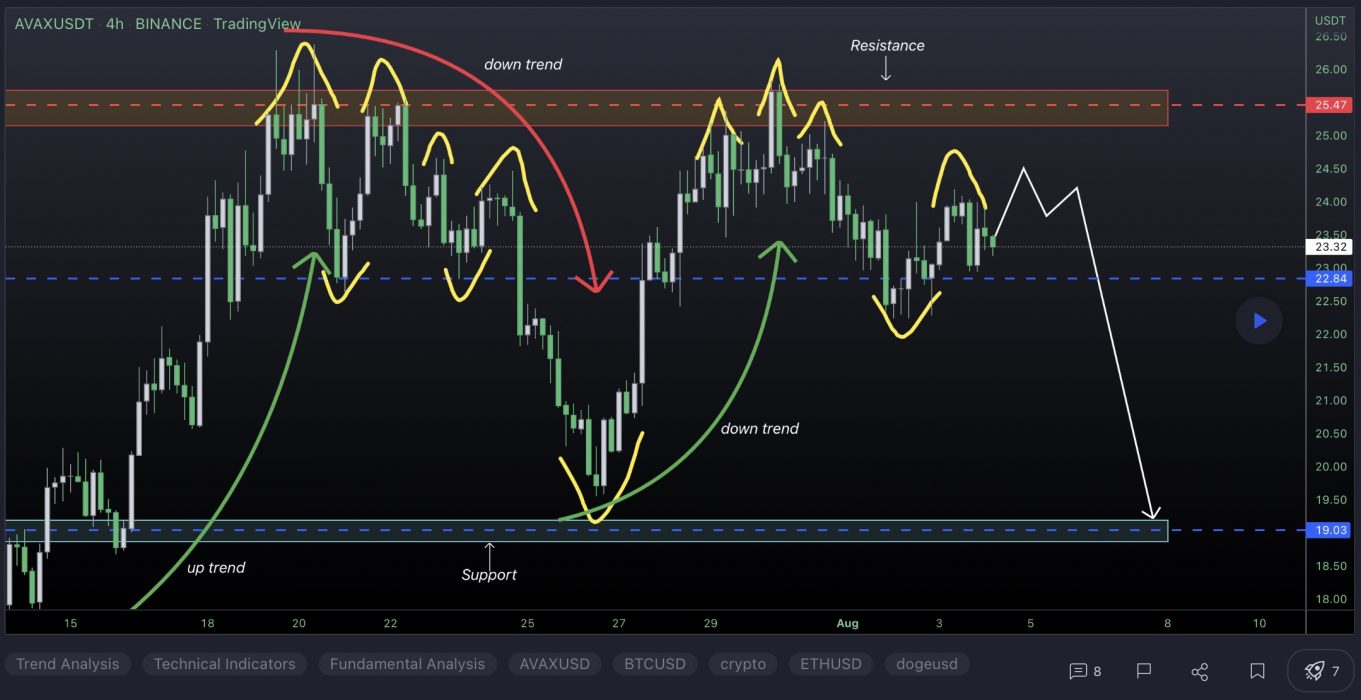
AVAX‘s gains in Q2 ended with an almost 78% retracement as the rest of the altcoin market dropped after May. Bulls stepped in near the 62.8% retracement of Q2’s move, creating a consolidation that ended with the bullish impulse to resistance near $26.30.

With the 9, 18 and 40 EMAs stacked bullish and a bullish higher-timeframe trend, it’s reasonable to anticipate retracement to possible support before further bullish expansion. 

Near the 40 EMA, a broad zone from $20.35 to $19.00 could see interest from bulls before further expansion. Bears might capitalise on any sharp moves down in Bitcoin, aiming for possible support near the 75% retracement, at $18.10, and potentially lower to a higher-timeframe support zone between $16.60 and $15.32.

If the higher-timeframe recovery trend resumes and the current resistance near $30.64 breaks, the wicks near $34.14 and the new monthly highs may see profit-taking.

3. VeChain (VET)

VeChain VET is a blockchain-powered supply chain platform. VeChain aims to use distributed governance and Internet of Things (IoT) technology to create an ecosystem that solves some of the major problems with supply chain management. The platform uses two in-house tokens, VET and VTHO, to manage and create value based on its VeChainThor public blockchain. The idea is to boost the efficiency, traceability, and transparency of supply chains while reducing costs and placing more control in the hands of individual users.

VET Price Analysis

At the time of writing, VET is ranked the 34th cryptocurrency globally and the current price is US$0.02903. Let’s take a look at the chart below for price analysis:

Source: TradingView

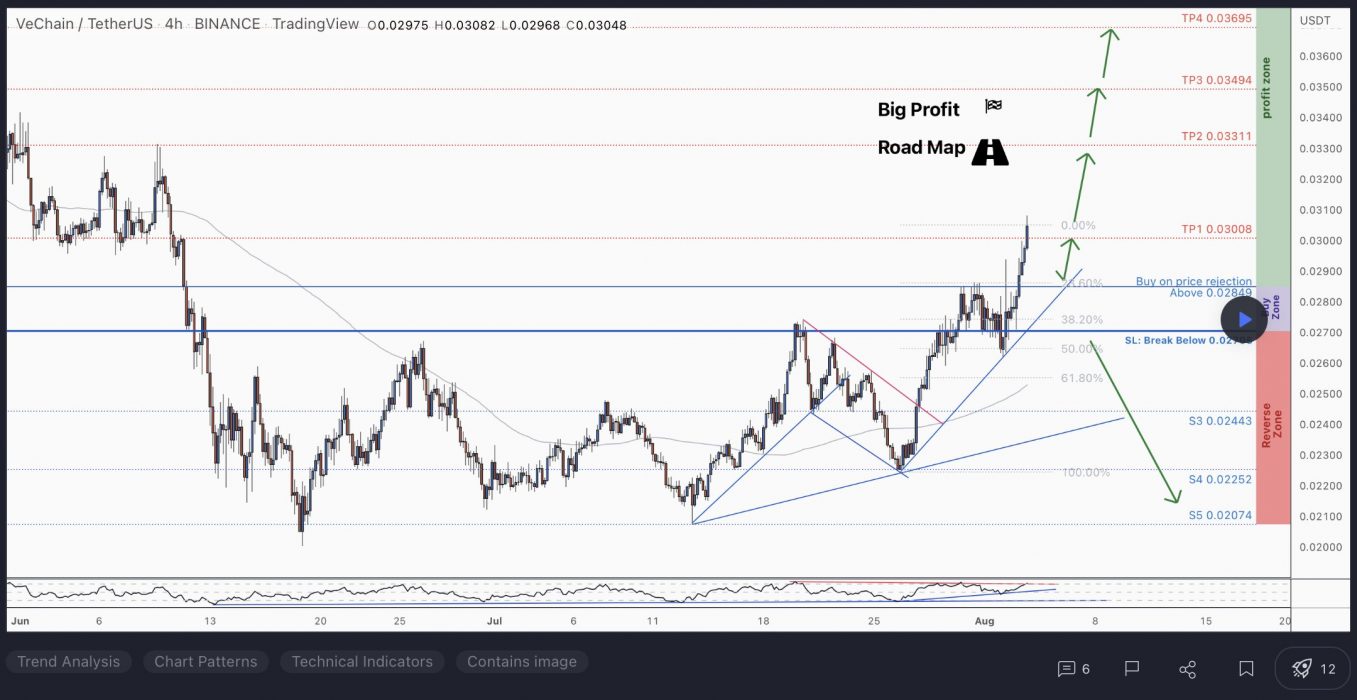
VET‘s 50% move during late March ran into resistance near $0.08450, at the 35% extension of the Q1 swing.

An old high and the 18 EMA have provided support near $0.02383 and may give support again on a retest. This area also has confluence with the 55% and 68.9% retracements of November’s swing.

Just below, near $0.02143, the 50.8% retracement of the current Q1 swing might also mark an area of support. 

If the market turns bearish, $0.02032 is unlikely to be revisited but could see interest from bulls during any deeper retracement.

An area near $0.03348, at the 50% extension of the last week swing, could see some profit-taking if bulls break the current resistance near $0.03728. Above, old consolidations near $0.04025 and $0.04472 may also provide some resistance before another round of price discovery.

Learn How to Trade Live!

Join Dave and The Crypto Den Crew and they’ll show you live on a webinar how to take your crypto trading to the next level.

Where to Buy or Trade Altcoins?

These coins have high liquidity on Binance Exchange, so that could help with trading on AUD/USDT/BTC pairs. And if you’re looking at buying and HODLing cryptos, then Swyftx Exchange is an easy-to-use popular choice in Australia.

Categories
ChainLink Crypto News Ethereum Classic Filecoin Market Analysis Trading

Top 3 Coins to Watch Today: FIL, ETC, LINK – August 4 Trading Analysis

Let’s take a closer look at today’s altcoins showing breakout signals. We’ll explain what the coin is, then dive into the trading charts and provide some analysis to help you decide.

1. Filecoin (FIL)

Filecoin FIL is a decentralised storage system that aims to “store humanity’s most important information”. The project was first described back in 2014 as an incentive layer for the Interplanetary File System (IPFS), a peer-to-peer storage network. Filecoin is an open protocol backed by a blockchain that records commitments made by the network’s participants, with transactions using FIL, the blockchain’s native currency. The blockchain is based on both proof-of-replication and proof-of-space-time.

FIL Price Analysis

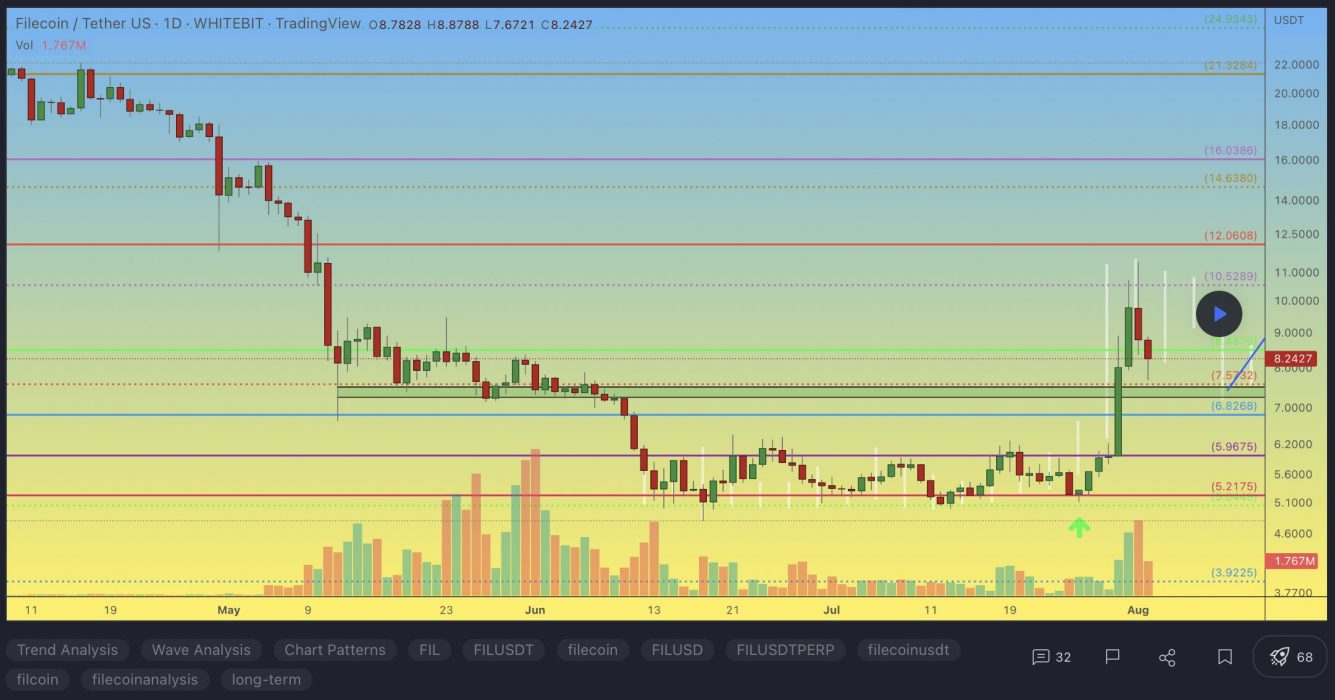
At the time of writing, FIL is ranked the 32nd cryptocurrency globally and the current price is US$8.64. Let’s take a look at the chart below for price analysis:

Source: TradingView

FIL has dropped 80% from its Q2 highs. It found support near $5.20 before starting a consolidation range. This level, near the lows, could continue to provide support. A year-long consolidation from 2019 to 2020 pivoted around this level many times. It’s also near the middle of the last down candle before 2020’s massive rally. A retest of this level would run bulls’ stops under swing lows formed in late June and early July.

The price is testing a closer area of possible support near $8.00. Bulls rejected bears many times in early July at this level. It’s also in the upper part of July’s swing low candle. The closest resistance is likely near $8.95. This area, up to $9.30, shows inefficient trading on the daily chart. It also contains the 9 and 18 EMAs.

If the price breaks through this level, it may aim for bears’ stops above $9.62. Even if it doesn’t reach these stops, the area between $9.90 and $10.25 could provide a bearish setup. Here, bears rejected bulls near the bottom of an area of inefficient trading on the weekly chart.

If the market turns more bullish, a rally beginning in this range may be aiming for the new monthly highs, near $10.39. This level is near the bottom of an area of inefficient trading on the daily chart.

2. Ethereum Classic (ETC)

Ethereum Classic ETC is a hard fork of Ethereum that launched in July 2016. Its main function is as a smart contract network, with the ability to host and support decentralised applications (DApps). Its native token is ETC. Since its launch, Ethereum Classic has sought to differentiate itself from Ethereum, with the two networks’ technical roadmaps diverging further with time. Ethereum Classic set out to preserve the integrity of the existing Ethereum blockchain after a major hacking event led to the theft of 3.6 million ETH.

ETC Price Analysis

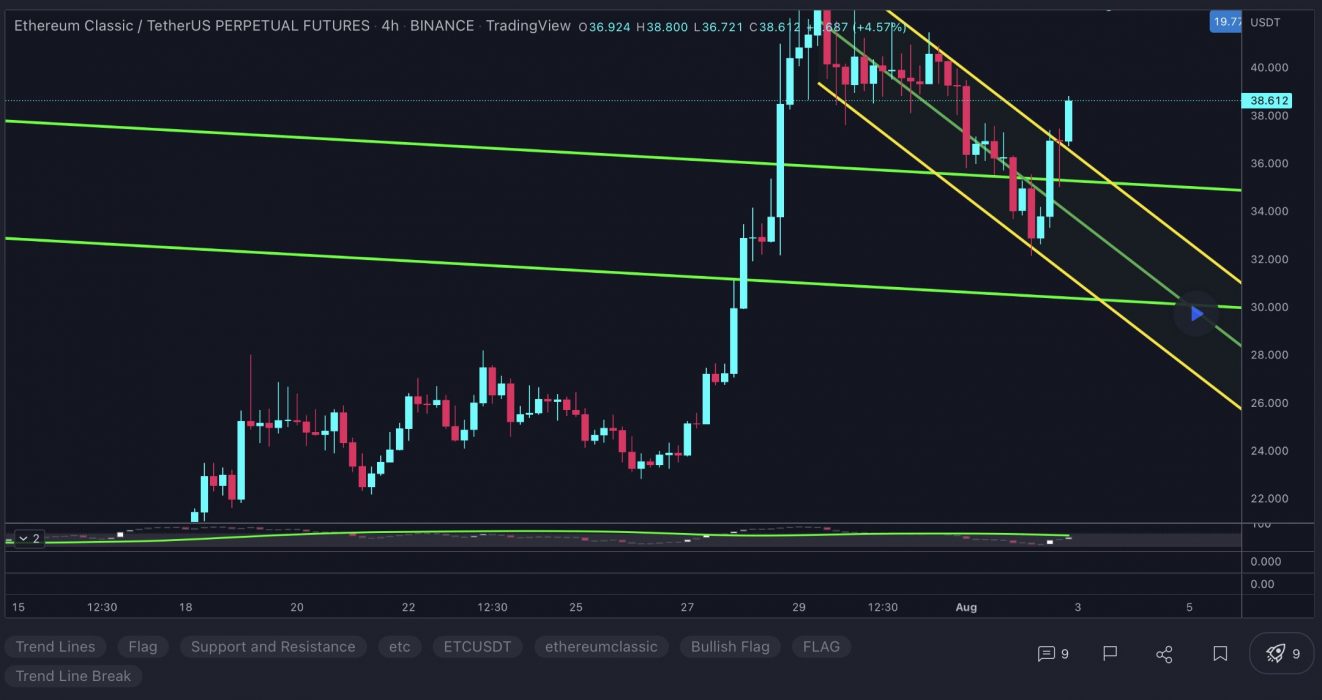
At the time of writing, ETC is ranked the 19th cryptocurrency globally and the current price is US$36.94. Let’s take a look at the chart below for price analysis:

Source: TradingView

During July, ETC broke several swing highs that could be the signal for a new bullish trend. Last week’s break of the most recent swing low could suggest some downside in the short term. It formed probable resistance near $40.32 and may target the swing low and possible support near $33.90.

The swing low and possible support near $30.21 could be the second bearish target if the move down continues. The relatively equal lows near $29.00 and possible support underneath near $27.45 could provide more substantial support.

The last swing high near $43.52 gives a near-term target if the bullish continuation continues. However, resistance beginning around $47.80 could cap this move. A break of this resistance might continue to probable resistance near $53.03 and reach above the cluster of relatively equal highs near $58.49.

The Chainlink Network LINK is driven by a large open-source community of data providers, node operators, smart contract developers, researchers, security auditors, and more. The company focuses on ensuring that decentralised participation is guaranteed for all node operators and users looking to contribute to the network. Chainlink allows blockchains to securely interact with external data feeds, events, and payment methods, providing the critical off-chain information needed by complex smart contracts to become the dominant form of digital agreement.

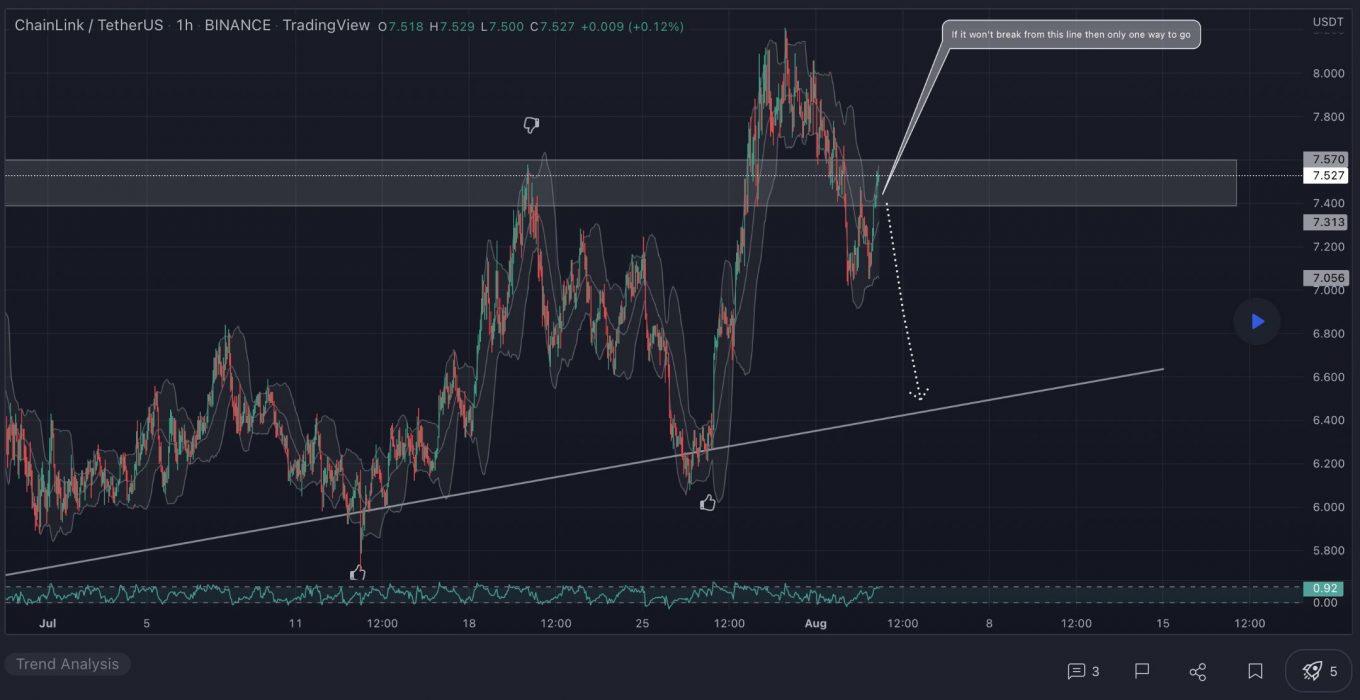
At the time of writing, LINK is ranked the 24th cryptocurrency globally and the current price is US$7.51. Let’s take a look at the chart below for price analysis:

Source: TradingView

LINK‘s early Q2 trend retraced near $5.70 into the consolidation that began the impulse before bouncing to $8.42. This consolidation could provide support again, although bears would first have to push the price through possible support near $7.90.

The market’s structure may be shifting bearish, with $7.10 likely to provide some resistance if this is the case. A sustained bearish move could reach the swing low near $6.70 before finding support near $6.27.

However, the bullish higher-timeframe trend may prevail, with relatively equal highs near $8.37 potentially giving an attractive target to lure the price over the monthly open. If so, the price could reach for the midpoint of the Q1 wick near $9.18.

Learn How to Trade Live!

Join Dave and The Crypto Den Crew and they’ll show you live on a webinar how to take your crypto trading to the next level.

Where to Buy or Trade Altcoins?

These coins have high liquidity on Binance Exchange, so that could help with trading on AUD/USDT/BTC pairs. And if you’re looking at buying and HODLing cryptos, then Swyftx Exchange is an easy-to-use popular choice in Australia.
Categories
Chiliz Crypto News Market Analysis OMG Network Ripple Trading

Top 3 Coins to Watch Today: XRP, CHZ, OMG – August 3 Trading Analysis

Let’s take a closer look at today’s altcoins showing breakout signals. We’ll explain what the coin is, then dive into the trading charts and provide some analysis to help you decide.

1. Ripple (XRP)

Ripple XRP is the currency that runs on a digital payment platform known as RippleNet, on top of a distributed ledger database called XRP Ledger. While RippleNet is run by a company called Ripple, the XRP Ledger is open-source and not based on a blockchain, but rather the aforementioned distributed ledger database.

XRP Price Analysis

At the time of writing, XRP is ranked the 6th cryptocurrency globally and the current price is US$0.3754. Let’s take a look at the chart below for price analysis:

Source: TradingView

XRP printed some gains during Q1 and Q2 after moving sideways for the past few weeks. The price is in a downtrend, with the 9, 18 and 40 EMAs providing resistance on each attempt to rally.

However, bulls are showing some interest at the 73% retracement, near $0.3610. If this level breaks, a move into possible support – just below the lows near $0.3245 – seems likely.

If the price does rally through the swing high at $0.3955 – perhaps triggered by a sudden surge in Bitcoin – bulls might find some resistance at the 61.8% retracement level near $0.4250. 

Overlapping swing highs and lows near $0.4526 may provide the next target, where bears immediately forced the price down in late December.

More bullish market conditions could shift targets to up near the midpoint of Q1’s consolidation, around $0.5132, where higher timeframes show an inefficiently traded zone.

2. Chiliz (CHZ)

Chiliz CHZ is the leading digital currency for sports and entertainment, powering the world’s first blockchain-based fan engagement and rewards platform, Socios.com. Here, fans can purchase and trade branded fan tokens as well as having the ability to participate, influence, and vote in club-focused surveys and polls. Founded in Malta in 2018, the company states its vision is to bridge the gap between active and passive fans, providing millions of sports fanatics with a fan token that acts as a tokenised share of influence.

CHZ Price Analysis

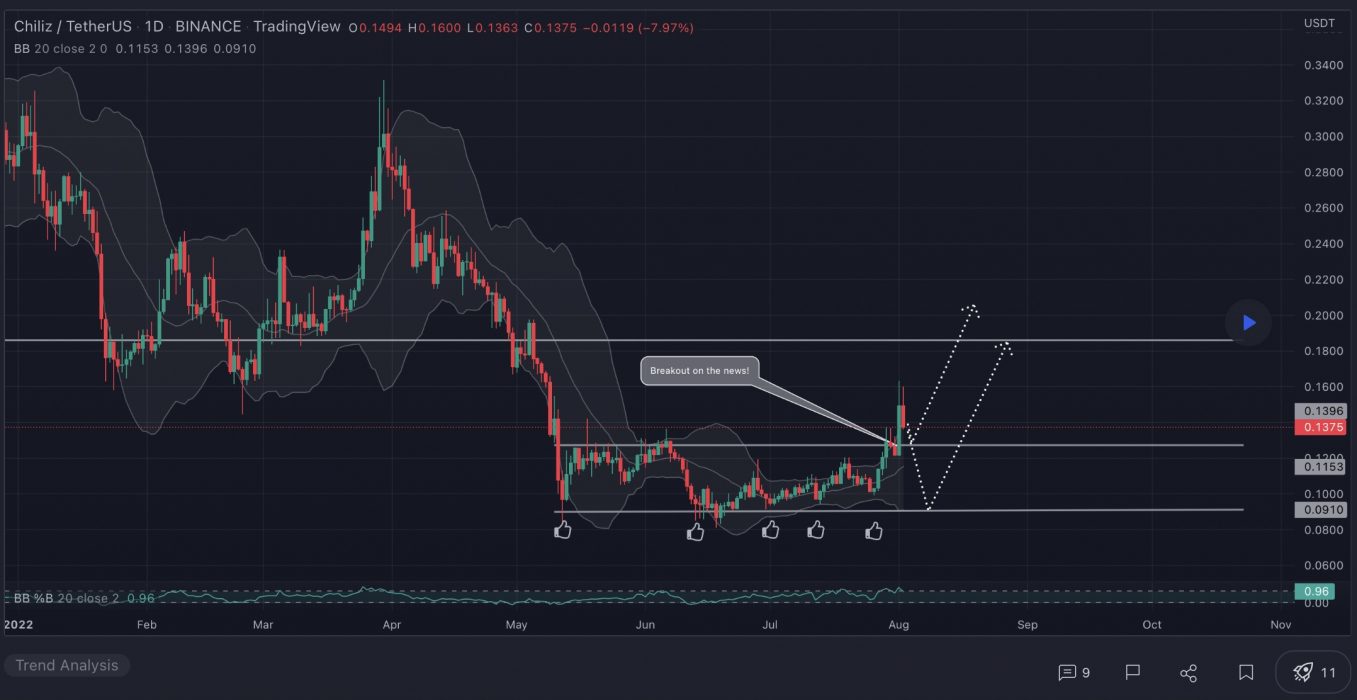
At the time of writing, CHZ is ranked the 60th cryptocurrency globally and the current price is US$0.1423. Let’s take a look at the chart below for price analysis:

Source: TradingView

CHZ‘s stunning rally to $0.1650 plummeted over 23% last week to sweep consolidation lows at $0.1055. This could set the stage for a new bullish cycle to begin. 

The price is currently balancing around the monthly open. A quick stop run into support beginning near $0.1420 could set the stage for a move into the daily gap beginning near $0.1705, potentially reaching resistance near $0.1837.

A sweep of the highs near $0.1958, followed by a sharp sell-off, hints that bulls are preparing to run the swing high near $0.2147. This run could find the next resistance around $0.2346 in the candle wick that created the monthly high. If the market remains bullish, the price will likely reach into possible resistance near $0.2528.

3. Omg Network (OMG)

Omg Network OMG, formerly known as OmiseGo, is a non-custodial, layer-2 scaling solution built for the Ethereum blockchain. As an Ethereum scaling solution, OMG Network is designed to allow users to transfer ETH and ERC20 tokens significantly faster and more cheaply than when transacting directly on the Ethereum network. The network is powered by the OMG utility token, which can be used as one of the payment methods for fees on the OMG Network, and will eventually be stackable – helping to secure the network in return for rewards.

OMG Price Analysis

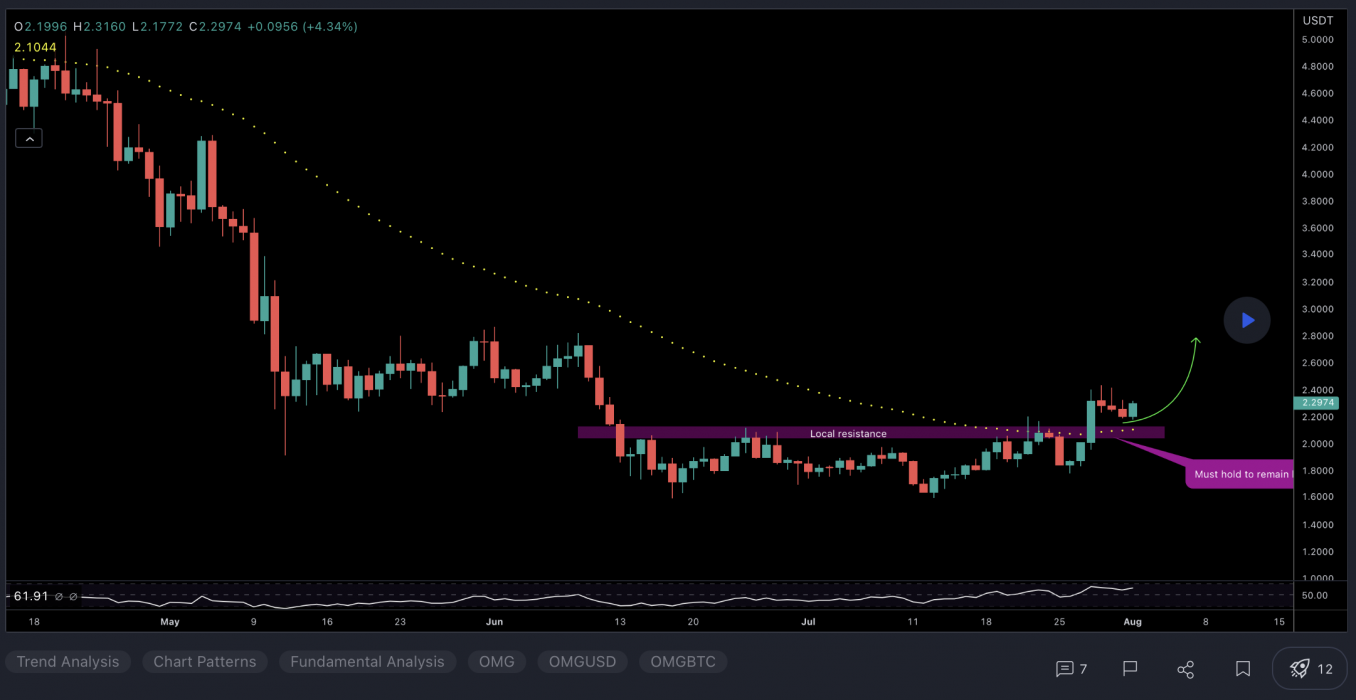
At the time of writing, OMG is ranked the 110th cryptocurrency globally and the current price is US$2.21. Let’s take a look at the chart below for price analysis:

Source: TradingView

OMG‘s 37% drop has filled the June monthly gap twice as the price consolidated between $1.82 and $2.40.

The price’s current region, between $2.20 and $2.35 and just under the monthly open, could continue to give support. If this area holds, the cluster of relatively equal range highs up to $2.60 is a likely target. 

An animated move through these highs could reach up to the daily gap beginning at $2.85. The area between $2.96 and $3.10 provides a likely cap for a move into this zone.

A drop lower could be a run-on stop under $2.00 and find support near $1.94. If this level is lost, the swing low at $1.85 is a likely target, with $1.79 possibly giving support.

Learn How to Trade Live!

Join Dave and The Crypto Den Crew and they’ll show you live on a webinar how to take your crypto trading to the next level.

Where to Buy or Trade Altcoins?

These coins have high liquidity on Binance Exchange, so that could help with trading on AUD/USDT/BTC pairs. And if you’re looking at buying and HODLing cryptos, then Swyftx Exchange is an easy-to-use popular choice in Australia.
Categories
Trading

How to Trade Bitcoin? For beginners

This is a simple beginner’s guide for people new to trading Bitcoin.

Basic Bitcoin trading facts

How do you trade Bitcoin?

  1. Sign up for a Free Binance Account: In just a few clicks, you can Sign up to Binance and create your account. You should get a confirmation link to your email once you’ve registered.
  2. Get Verified for AUD Deposit: Before you can trade you’ll need some funds. Simply verify your account by uploading your passport/drivers licence, or other ID documents. Once approved, you are free to deposit funds through your bank using PayID.
  3. Start Trading: Once you have funds you can now start trading your favourite cryptocurrencies.

About Binance

Binance logo

Binance offers one of the largest cryptocurrency exchanges in the world in terms of trading volume. They support AUD deposits and withdrawals for personal accounts, which are instant and have no fees, through PayID/Osko. For more information, please read our Binance review.

Need more help? Get tech support from the Binance Australia Support Team.


Why do people trade Bitcoin?

  • To try and make a profit.
  • To get other cryptocurrencies and use them for something.
  • For fun.

Where can I trade Bitcoin in Australia?

Is it safe to trade Bitcoin?

  • Before buying or trading Bitcoin, you should do research about what and how to do it and the risks involved.
  • If your Bitcoin is held on a crypto exchange: They essentially hold your “wallet” and if they lose your Bitcoin, it is lost and might never be recovered or reimbursed.
  • Stay away from scams such as “ponzi schemes”“ICOs” and “pump and dumps”. If you are not sure what they are, do the research before buying.
  • Remember to only trade with what you are prepared to lose. The crypto markets are new, highly volatile, and are not regulated as the stock market is.

Different types of trading?

  • Trading vs Investing – In simple terms, traders usually are looking to make a quick profit. Investors usually buy and hold for longer-term profits.
  • “Day trading” – People who try to make a profit with multiple trades during a day.
  • “Scalping trading” – People who try to make small profits on trades, pennies on the dollar. They get in, they get out.
  • “Swing trading” – People trying to make profits on price cycles, such as: they see it going up, they buy in and wait until momentum dies and then get out. They could hold for days, weeks or even months before selling.

Learn more about Trading Bitcoin

Categories
Crypto Exchange Trading

What is the Best Cryptocurrency Trading Platform?

Update: Please see our article on the best crypto exchanges in Australia for reviews and up-to-date information.

What is the Best Cryptocurrency Trading Platform?

Cryptocurrency trading platforms are essentially websites where you can buy, sell or exchange cryptocurrencies for other digital currencies or traditional currencies. Trading cryptocurrency has become very well-known activity over the last year with your average mum and dad investor jumping on the trading Bitcoin wagon. There are many beginners that are joining the crypto world every day and while some of them could be joining for an investment opportunity, some may be in it for the technology. So, if you are looking to start trading cryptocurrencies, here is some more information about the best trading platforms.

“A cryptocurrency exchange or a digital currency exchange (DCE) is a business that allows customers to trade cryptocurrencies or digital currencies for other assets, such as conventional fiat money or other digital currencies. A cryptocurrency exchange can be a market maker that typically takes the bid-ask spreads as a transaction commission for is service or, as a matching platform, simply charges fees.” – Source: Wikipedia (wikipedia.org/wiki/Cryptocurrency_exchange)

Binance

Binance offers one of the largest cryptocurrency exchanges in the world in terms of trading volume. They support AUD deposits and withdrawals for personal accounts which are Instant and have no fees through PayID/Osko. Binance is trusted by many investors and is used by millions of customers globally. Among the features of this platform are that it makes it easy to securely purchase, use, store, and trade digital currency. You can store your Bitcoins and Cryptocurrencies through a digital wallet that is available on IOS and Android.

Coinbase

Coinbase is a worldwide exchange where you can trade with other users by using the company’s Global Digital Asset Exchange (Coinbase Pro) subsidiary. Coinbase Pro currently functions in the UK, US, Canada, Australia, Singapore, and Europe. There are no transfer fees when you move funds from your Coinbase account to your Coinbase Pro account. The main benefits of having Coinbase is that it has a great reputation, high security, affordable fees, is beginner friendly, and the stored currency is covered by Coinbase insurance. On the other hand, the disadvantages of the platform are limited payment methods and limited countries supported.

Kraken

The trading platform Kraken was founded in 2011 and is the biggest Bitcoin exchange in euro volume and liquidity. Kraken is also a partner of the first cryptocurrency bank. This trading platform will enable you to buy and sell Bitcoins and trade between cryptocurrencies and selected traditional currencies. You can also trade with other digital currencies such as Monero, Ethereum, Litecoin, Zcash, Ripple, and more. Additionally, Kraken provides margin trading and a host of other trading features. Kraken trading platform is a great selection for more professional traders. The pros of the Kraken are that it has a great reputation, reasonable exchange rates, it’s seen to be secure, supported worldwide, has low transaction fees, and more. The cons are that it has limited payment options and is not friendly for beginners.

Coinsquare

Coinsquare trading platform is committed to safe and secure trades as you are trusting your money with them. They take this very seriously, so they have a 100% proprietary system. In addition to this, they have also been DDoS tested and they have not lost a single coin to date. Also, they keep a ledger to make sure they know where every coin is at all times. The advantages of using Coinsquare is that it has a fantastic reputation, it’s seen to be very secure, has affordable fees and is relatively beginner-friendly. The disadvantages of Coinsquare are that it has limited payment methods and limited countries supported.

ShapeShift

The trading platform ShapeShift is one of the leading platforms that supports a range of cryptocurrencies, including Bitcoin, Ethereum, Zcash, Monero, and many others. It’s a great option for people who want to make instant direct trades without having to sign up to an account or rely on a platform to hold their funds. However, ShapeShift does not enable users to buy cryptos with debit cards, credit cards or another form of payment system. ShapeShift has a no-fiat policy and will only allow exchange between Bitcoin and other supported cryptocurrencies. The pros of having this trading platform are that it has a great reputation, is suitable for beginners, and has many cryptos available for exchange, quick exchange, and affordable prices. The cons are that it has an average mobile app, no fiat policy, and limited payment options.

Read More on Crypto News Australia

The world of cryptocurrency is constantly changing. You can stay up to date with the latest Australian Crypto news here. Or, if you would like to learn more about digital currencies, then please visit our Guides section for more tips, advice, and information.