Categories
Compound Crypto News Market Analysis Ripple Trading TRON

Top 3 Coins to Watch Today: XRP, TRX, COMP – May 20 Trading Analysis

Let’s take a closer look at today’s altcoins showing breakout signals. We’ll explain what the coin is, then dive into the trading charts and provide some analysis to help you decide.

1. Ripple (XRP)

Ripple XRP is the currency that runs on a digital payment platform called RippleNet, on top of a distributed ledger database called XRP Ledger. While RippleNet is run by a company called Ripple, the XRP Ledger is open-source and not based on a blockchain, but rather the aforementioned distributed ledger database.

XRP Price Analysis

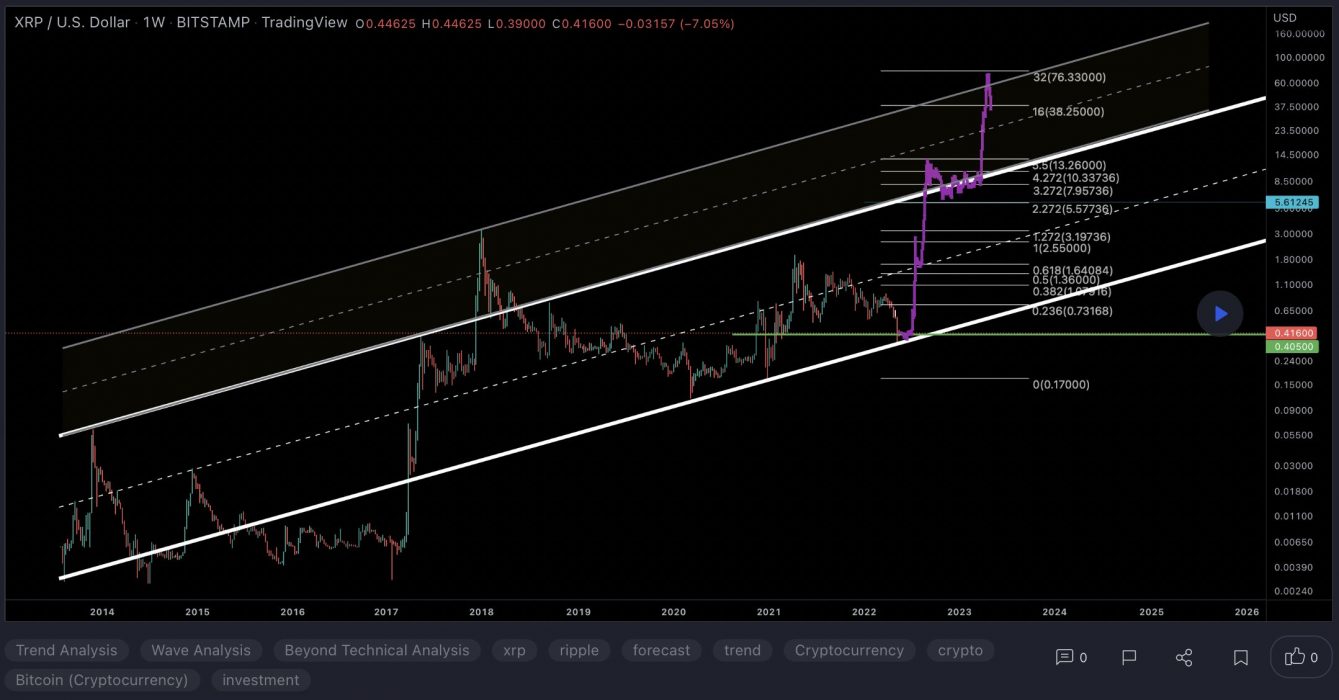
At the time of writing, XRP is ranked the 6th cryptocurrency globally and the current price is US$0.4198. Let’s take a look at the chart below for price analysis:
Source: TradingView

XRP printed some gains during Q1 after moving sideways for the past few weeks. The price is in a downtrend, with the 9, 18 and 40 EMAs providing resistance on each attempt to rally.

However, bulls are showing some interest at the 70.6% retracement, near $0.4372. If this level breaks, a move into possible support – just below the lows near $0.3752 – seems likely.

If the price does rally through the swing high at $0.4955 – perhaps triggered by a sudden surge in Bitcoin – bulls might find some resistance at the 61.8% retracement level near $0.5850. 

Overlapping swing highs and lows near $0.6546 might provide the next target, where bears immediately forced the price down in late December.

More bullish market conditions could shift targets up near the midpoint of Q1’s consolidation, near $0.7217, where higher timeframes show an inefficiently traded zone.

2. Tron (TRX)

Tron TRX is a blockchain-based operating system that aims to ensure this technology is suitable for daily use. Whereas Bitcoin can handle up to six transactions per second, and Ethereum up to 25, TRON claims that its network has a capacity for 2,000 TPS. This project is best described as a decentralised platform focused on content sharing and entertainment, and to this end, one of its biggest acquisitions was the file-sharing service BitTorrent in 2018. Overall, TRON has divided its goals into six phases. These include delivering simple distributed file sharing, driving content creation through financial rewards.

TRX Price Analysis

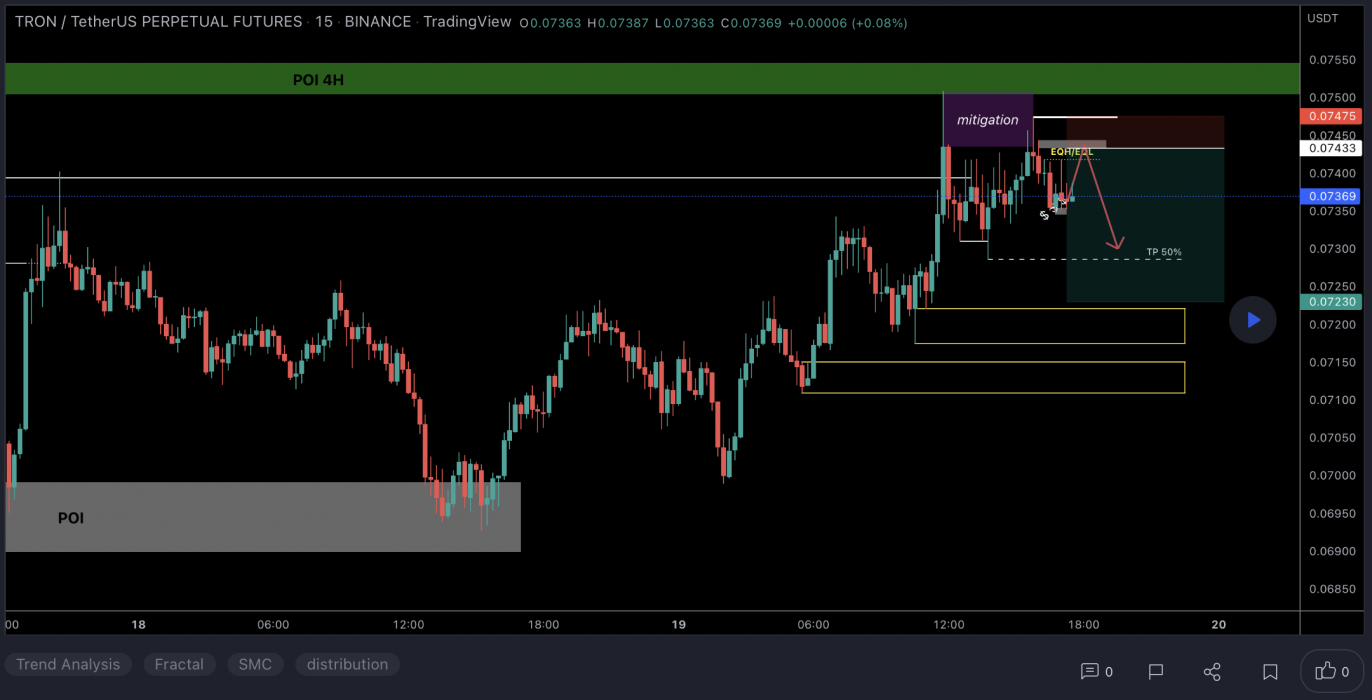
At the time of writing, TRX is ranked the 14th cryptocurrency globally and the current price is US$0.07396. Let’s take a look at the chart below for price analysis:
Source: TradingView

TRX accompanied the rest of the market during the April drop, falling nearly 60% from early May until it found a low last week.

Price action formed a weekly support level near $0.06754, which has so far held up the price. The most recent swing low inside this range, near $0.06329, might be the target for any future stop runs. After this low, the swing low near $0.05889 and the gap beginning near $0.05426 mark possible higher-timeframe support.

The price is currently battling with significant higher-timeframe resistance levels, with the closest probable resistance resting near $0.07892, just over the previous monthly open. A sweep of the relatively equal highs above this resistance might find sellers near $0.08235, but could reach as high as $0.08737.

3. Compound (COMP)

Compound COMP is a DeFi lending protocol that allows users to earn interest on their cryptocurrencies by depositing them into one of several pools supported by the platform. When a user deposits tokens to a Compound pool, they receive cTokens in return. These cTokens represent the individual’s stake in the pool and can be used to redeem the underlying cryptocurrency initially deposited into the pool at any time. These COMP tokens can be bought from third-party exchanges or can be earned by interacting with the Compound protocol, such as by depositing assets or taking out a loan.

COMP Price Analysis

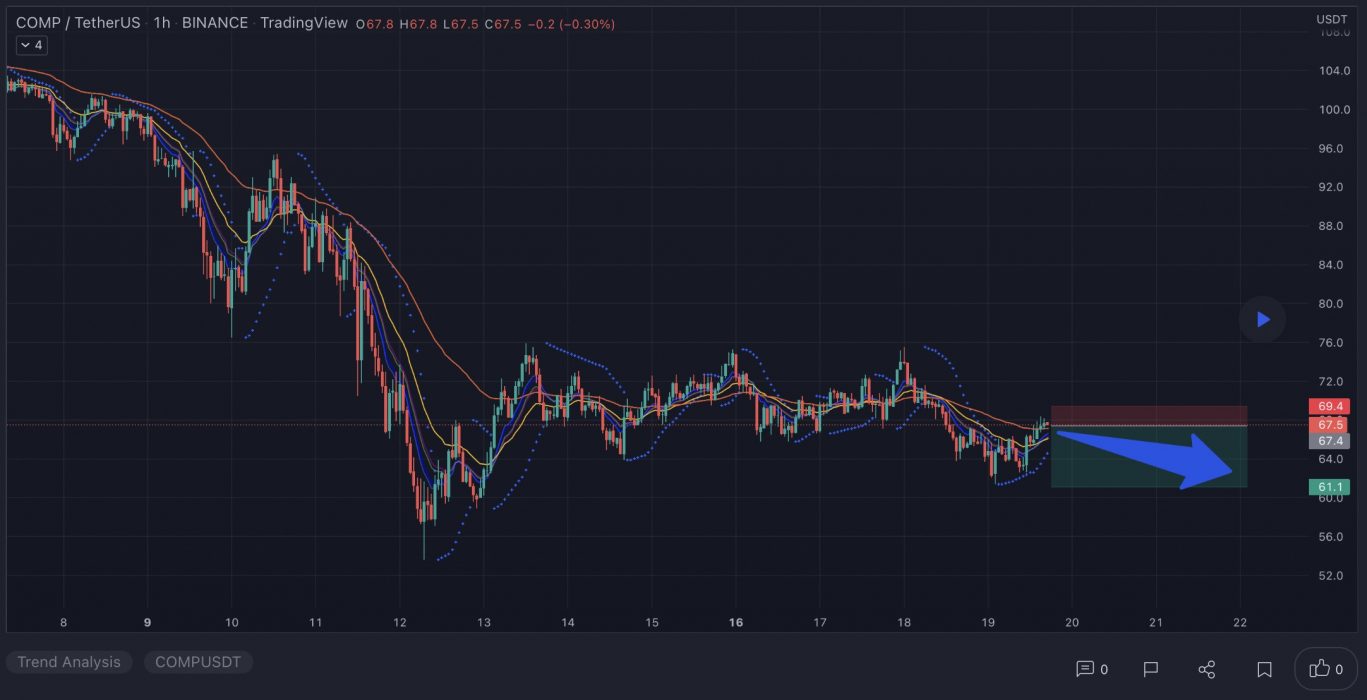
At the time of writing, COMP is ranked the 90th cryptocurrency globally and the current price is US$66.93. Let’s take a look at the chart below for price analysis:
Source: TradingView

After rallying over 60% from its March low, COMP is encountering resistance near $75.43.

This resistance and the monthly open at $80.13 currently have the price trapped. The swing high and resistance near $86.27 provide a likely target before any major bearish market shift, with continuation through this resistance possibly reaching for short stops and resistance near $92.55.

The daily gap at $62.12 could provide support, while the area beginning near $58.49 could see more substantial interest from the bulls. A longer-term bearish shift in the marketplace will likely reach the relatively equal lows near $50.48, possibly finding a floor at possible support beginning near $45.81.

Learn How to Trade Live!

Join Dave and The Crypto Den Crew and they’ll show you live on a webinar how to take your crypto trading to the next level.

Where to Buy or Trade Altcoins?

These coins have high liquidity on Binance Exchange, so that could help with trading on AUD/USDT/BTC pairs. And if you’re looking at buying and HODLing cryptos, then Swyftx Exchange is an easy-to-use popular choice in Australia.

Categories
Crypto News Gala Kucoin Market Analysis Monero Trading

Top 3 Coins to Watch Today: KCS, XMR, GALA – May 19 Trading Analysis

Let’s take a closer look at today’s altcoins showing breakout signals. We’ll explain what the coin is, then dive into the trading charts and provide some analysis to help you decide.

1. KuCoin Token (KCS)

KCS is the native token of KuCoin, launched in 2017 as a profit-sharing token that allows traders to draw value from the exchange. It was issued as an ERC-20 token running on the Ethereum network and was supported by most Ethereum wallets. The total supply of KCS was set at 200 million, and there is a planned buyback and burn until just 100 million KCS remain. Sooner or later, as the KuCoin decentralised trading solution goes live, KCS will be the native asset of KuCoin’s decentralised financial services as well as the governance token of the KuCoin community in the future.

KCS Price Analysis

At the time of writing, KCS is ranked the 44th cryptocurrency globally and the current price is US$14.24. Let’s take a look at the chart below for price analysis:

Source: TradingView

KCS has been trading through a massive range during Q1, with the price showing mild bullishness during March.

Bulls bought near $12.26. The weekly level and daily gap near $13.80 could prompt buyers to step in again as the price challenges the swing high and resistance around $15.50. A strong move and acceptance above this level may reach for the swing highs at $17.75 and $18.66, which marks another area of resistance.

However, rejection from the current area may send the price down to retest support near $13.05. Relatively equal lows around $12.48 provide a rich target for a stop run. Sustained bearishness may reach the low near $11.96 and possibly as low as $11.23 into higher-timeframe support.

2. Monero (XMR)

Monero XMR allows transactions to take place privately and with anonymity. Even though it’s commonly thought that BTC can conceal a person’s identity, it’s often easy to trace payments back to their original source because blockchains are transparent. On the other hand, XMR is designed to obscure senders and recipients alike through the use of advanced cryptography. The team behind Monero says privacy and security are their biggest priorities, with ease of use and efficiency coming second. It aims to provide protection to all users irrespective of how technologically competent they are.

XMR Price Analysis

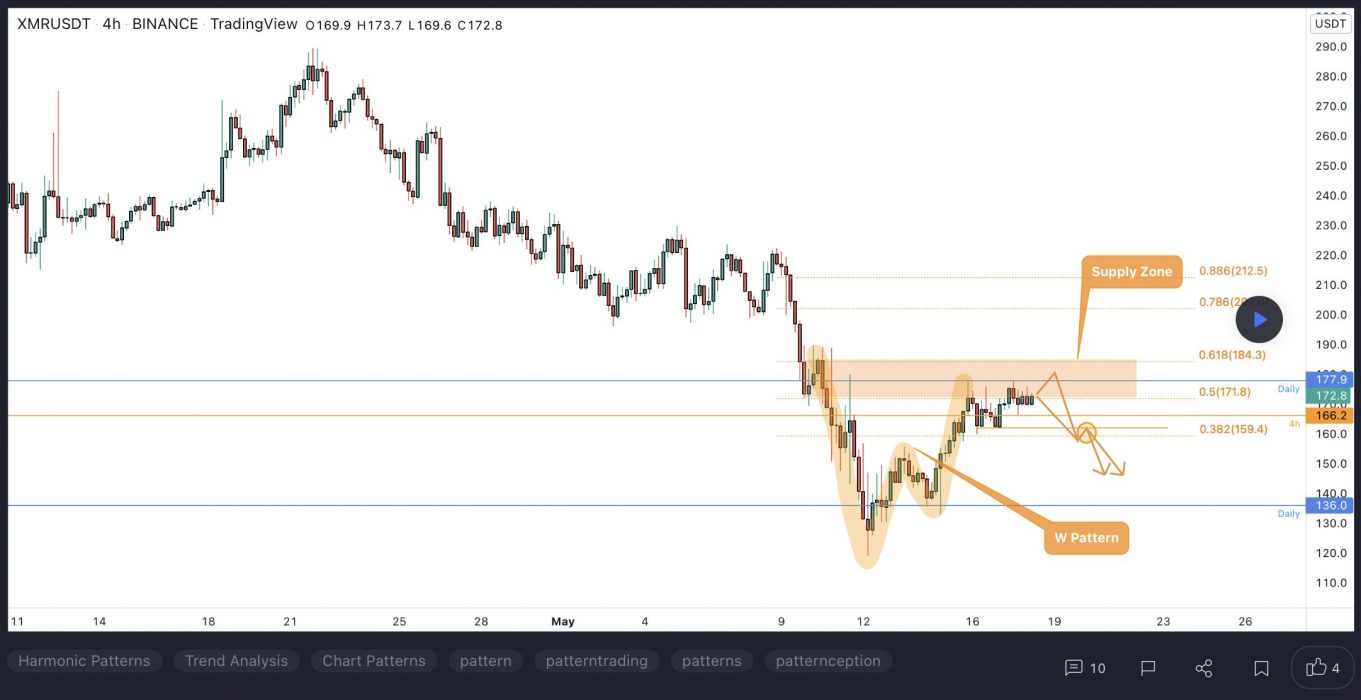
At the time of writing, XMR is ranked the 29th cryptocurrency globally and the current price is US$163.21. Let’s take a look at the chart below for price analysis:

Source: TradingView

XMR‘s 70% rally during Q1 ran into resistance near $268. Since then, the price has been consolidating in a 120% range between $140 and $210.

Just below the monthly open, $160 is the first level likely to provide substantial support. If the price breaks down through this level, overlapping levels near $153 might cap a run on the lows near $146 and $138.

The higher-timeframe analysis points to the area near $184 as the next substantial resistance. Significant selling has been occurring here on the daily chart. If this level breaks, the swing highs near $198 and $223 may be the next target.

3. Gala (GALA)

GALA aims to take the gaming industry in a different direction by giving players back control over their games. Gala Games’ mission is to make “blockchain games you’ll actually want to play”. The project wants to change the fact that players can spend hundreds of dollars on in-game assets and countless hours playing the game, all of which could be taken away from them with the click of a button. It plans to reintroduce creative thinking into games by giving players control of the games and in-game assets with the help of blockchain technology.

GALA Price Analysis

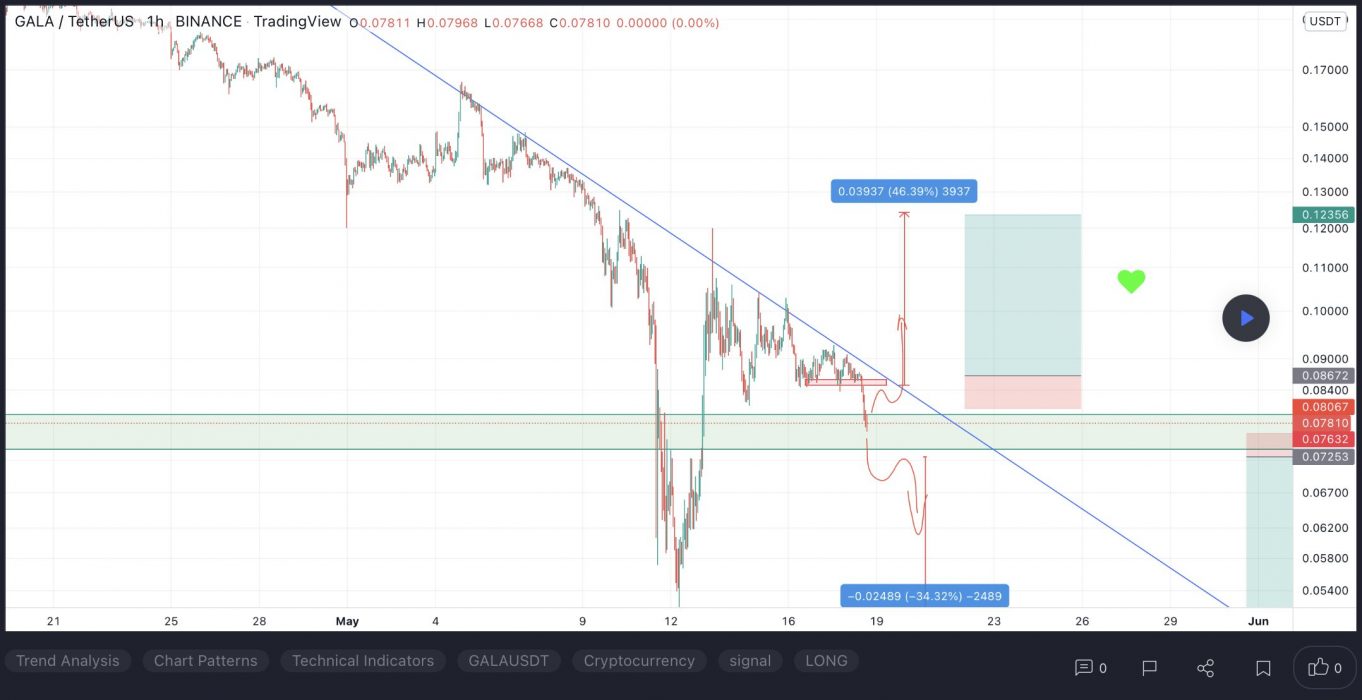
At the time of writing, GALA is ranked the 84th cryptocurrency globally and the current price is US$0.07883. Let’s take a look at the chart below for price analysis:

Source: TradingView

After setting a low last week, GALA turned into a recovery trend to make the new highs.

The following 70% plummet found support near $0.05439, sweeping under the 40 EMA into the 60.8% retracement level before bouncing to resistance beginning at $0.07320.

This area could continue to provide resistance, possibly causing a retracement to the 9 EMA and 18 EMA near $0.08412, where aggressive bulls might begin bidding. The level near $0.08950, which has confluence with the 40 EMA, may see more interest from bulls loading up for an attempt on probable resistance beginning near $0.09785. 

However, if Bitcoin continues its sideways trend, much lower prices could be seen. The old support near $0.06280 could provide at least a short-term bounce. If this level fails, the old highs near $0.05635 might also give support and see the start of a new bullish cycle after retesting these support levels.

Learn How to Trade Live!

Join Dave and The Crypto Den Crew and they’ll show you live on a webinar how to take your crypto trading to the next level.

Where to Buy or Trade Altcoins?

These coins have high liquidity on Binance Exchange, so that could help with trading on AUD/USDT/BTC pairs. And if you’re looking at buying and HODLing cryptos, then Swyftx Exchange is an easy-to-use popular choice in Australia.

Categories
Axie Infinity Crypto News Market Analysis PancakeSwap SushiSwap Trading

Top 3 Coins to Watch Today: SUSHI, AXS, CAKE – May 18 Trading Analysis

Let’s take a closer look at today’s altcoins showing breakout signals. We’ll explain what the coin is, then dive into the trading charts and provide some analysis to help you decide.

1. SushiSwap (SUSHI)

SushiSwap SUSHI is an example of an automated market maker (AMM). An increasingly popular tool among cryptocurrency users, AMMs are decentralised exchanges that use smart contracts to create markets for any given pair of tokens. SushiSwap aims to diversify the AMM market and also add features not previously present on Uniswap, such as increased rewards for network participants via its in-house token, SUSHI.

SUSHI Price Analysis

At the time of writing, SUSHI is ranked the 155th cryptocurrency globally and the current price is US$1.34. Let’s take a look at the chart below for price analysis:

Source: TradingView

After retracing nearly 75% from its Q1 highs, SUSHI set a low near $1.22 as it formed its current range.

Last week, the price swept highs near $1.53, which now also marks the previous monthly high. Relatively equal daily highs near $1.60 provide a reasonable target, although resistance beginning near $1.64 could cap the move. A break of this resistance is likely to target the swing high near $1.77 into higher-timeframe resistance beginning near $1.90.

The current area near $1.30 could provide support, although bulls may be more likely to buy near the price fractal near $1.24 if a retracement reaches this level. A break of this area could continue down to sweep the low near $1.13 into possible support beginning near $1.02.

2. Axie Infinity (AXS)

Axie Infinity AXS is a blockchain-based trading and battling game that is partially owned and operated by its players. The Axie Infinity ecosystem has its own unique governance token, known as Axie Infinity Shards AXS. These are used to participate in key governance votes and give holders a say in how funds in the Axie Community Treasury are spent.

AXS Price Analysis

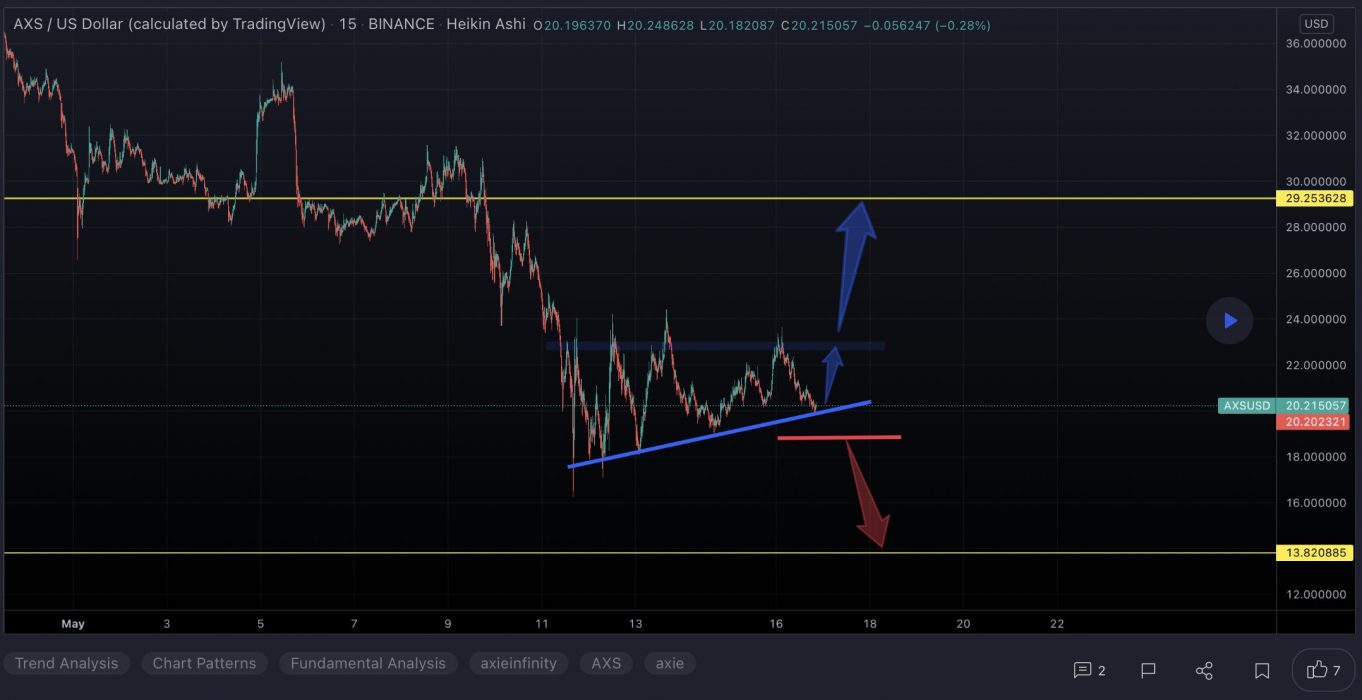
At the time of writing, AXS is ranked the 48th cryptocurrency globally and the current price is US$21.21. Let’s take a look at the chart below for price analysis:

Source: TradingView

AXS‘s relatively small 25% range could suggest that a recovery is setting up in May.

Aggressive bulls could look for entries at the most recent area of support formed near $20.34. However, equal lows near $19.42 make a tempting target for a stop run into this support. This move could reach support near $18.90. 

A decisive move to the downside could run stops below the second set of relatively equal lows near $17.23, possibly reaching support at an old swing high and a daily gap near $15.58.

A recent level near $27.84 provided resistance and caused a swing high to form near $30.88, offering first targets. A move through this high may arrive at new monthly high levels near $33.31 and $35.30.

3. PancakeSwap (CAKE)

PancakeSwap CAKE is an automated market maker (AMM) – a decentralised finance (DeFi) application that allows users to exchange tokens, providing liquidity via farming and earning fees in return. PancakeSwap uses an automated market maker model where users trade against a liquidity pool. These pools are filled by users who deposit their funds into the pool and receive liquidity provider (LP) tokens in return. PancakeSwap allows users to trade BEP20 tokens, provide liquidity to the exchange and earn fees, stake LP tokens to earn CAKE, stake CAKE to earn more CAKE, and stake CAKE to earn tokens of other projects.

CAKE Price Analysis

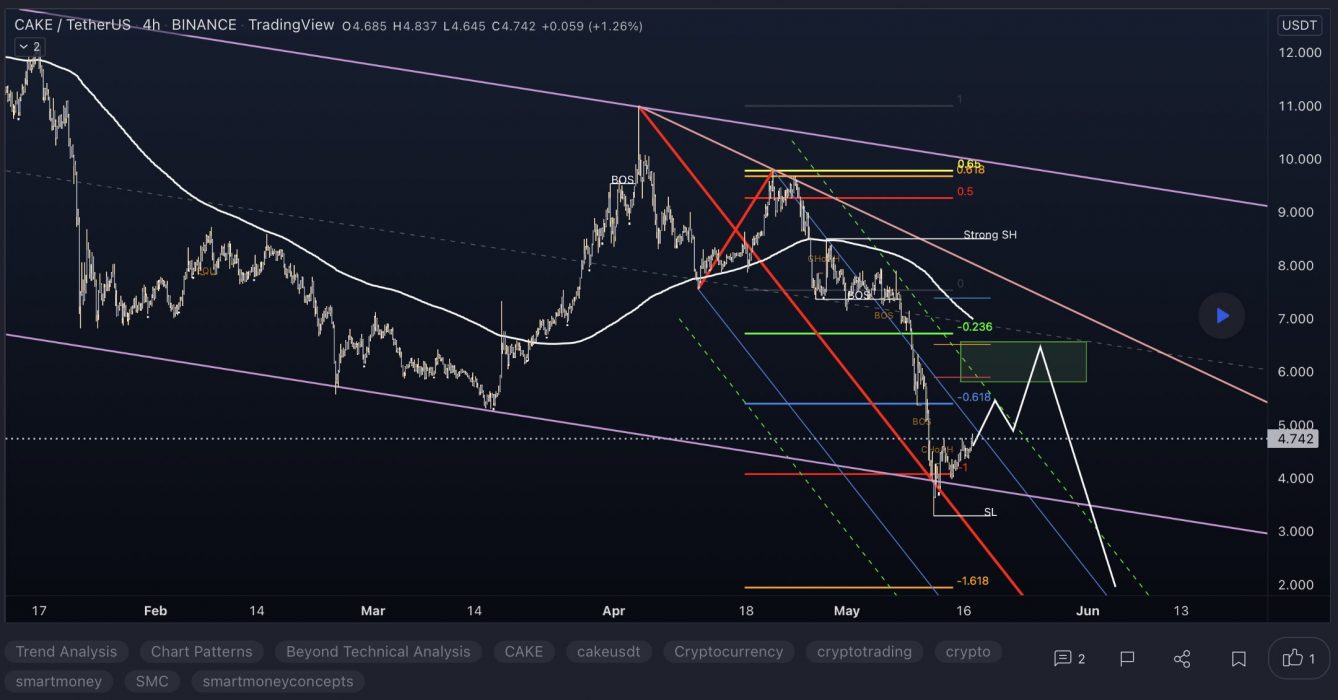
At the time of writing, CAKE is ranked the 44th cryptocurrency globally and the current price is US$4.63. Let’s take a look at the chart below for price analysis:

Source: TradingView

CAKE‘s 75% decline after Q1 created relatively equal lows near $3.56 before bouncing over the local range’s midpoint near $4.60. A bullish altcoin market could help CAKE bulls regain a stronger bullish trend.

Aggressive bulls could look for entries in the daily gap starting near 4.46. The monthly open aligns with more probable support near $4.28. 

A stop run below the monthly open near $4.10 might provide a more favourable entry. A more substantial bearish move – perhaps from a sharp drop in Bitcoin’s price – could challenge support near $3.90, just above the equal lows.

Resistance rests just above, with the zone from $4.95 to $5.37 likely to provide a short-term ceiling. A break through this level might target resistance just under the cluster of relatively equal highs near $5.77. 

Beyond these highs, resistance near $5.89 provides a final challenge before attacking an old daily swing high near $6.52.

Learn How to Trade Live!

Join Dave and The Crypto Den Crew and they’ll show you live on a webinar how to take your crypto trading to the next level.

Where to Buy or Trade Altcoins?

These coins have high liquidity on Binance Exchange, so that could help with trading on AUD/USDT/BTC pairs. And if you’re looking at buying and HODLing cryptos, then Swyftx Exchange is an easy-to-use popular choice in Australia.

Categories
Basic Attention Token Crypto News EOS Market Analysis Trading Unibright

Top 3 Coins to Watch Today: BAT, EOS, UBT – May 17 Trading Analysis

Let’s take a closer look at today’s altcoins showing breakout signals. We’ll explain what the coin is, then dive into the trading charts and provide some analysis to help you decide.

Basic Attention Token BAT is the token that powers a new blockchain-based digital advertising platform designed to fairly reward users for their attention while providing advertisers with a better return on their ad spend. The Basic Attention Token itself is the unit of reward in this advertising ecosystem and is exchanged between advertisers, publishers and users. Advertisers pay for their advertising campaigns in BAT tokens. Out of this budget, a small portion is distributed to advertisers, while 70% is distributed to users – whereas the intermediaries that typically drive up advertising costs are cut out of the equation to improve cost-efficiency.

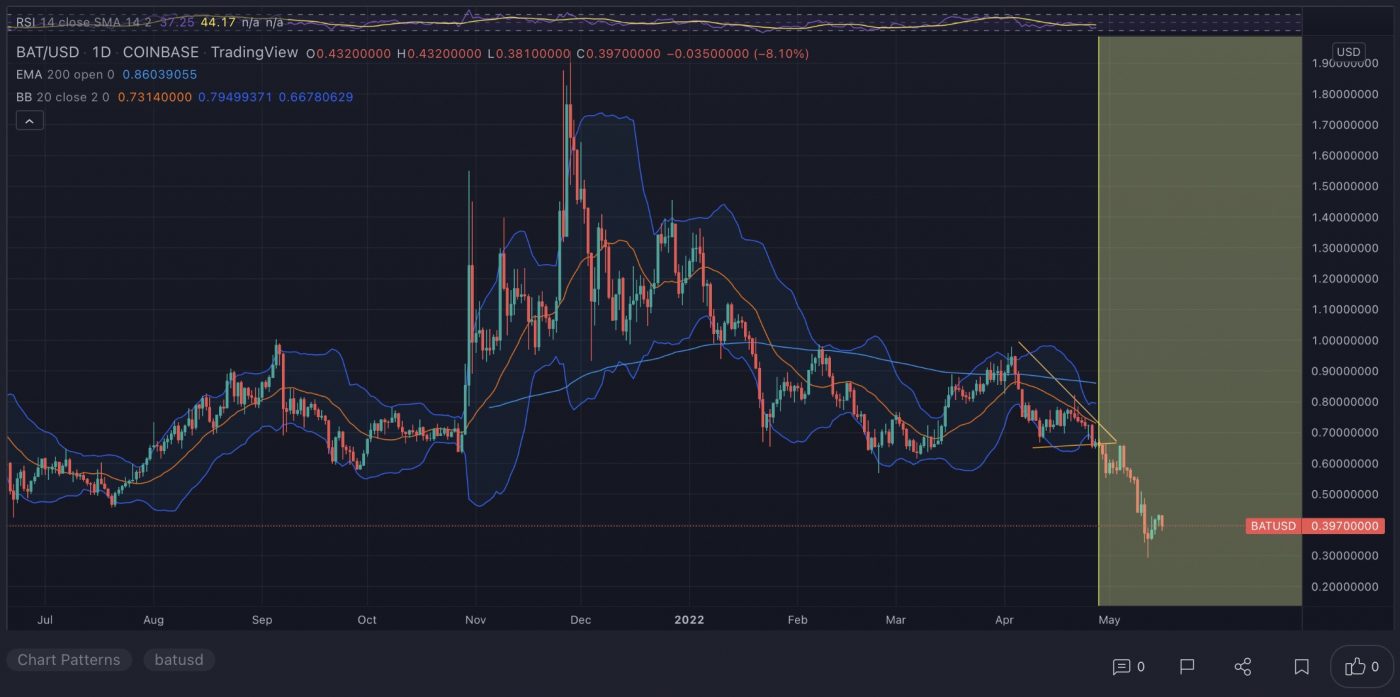
At the time of writing, BAT is ranked the 80th cryptocurrency globally and the current price is US$0.3963. Let’s take a look at the chart below for price analysis:

Source: TradingView

BAT has dropped nearly 69% from its April 2022 high and 84% from its November 2021 all-time high.

Support might have formed last week from $0.3934 to $0.3665 and should hold if bulls are ready for a bounce. This zone overlaps with an inefficiently traded area on the weekly chart from $0.3863 to $0.3394.

If this level breaks, bears might target an inefficiently traded area on the monthly chart from $0.2907 to $0.2632. Below this level, $0.1745 to $0.1580 could provide support after a run on bulls’ stops under the Q4 2020 lows into an area of significant accumulation.

The closest resistance begins near $0.4283. This level has confluence with the 9 EMA and a brief consolidation before May 11’s spike downward.

A more significant rally might find resistance near $0.4940. This level is inefficiently traded and has confluence with the lows of last summer’s accumulation and the 18 EMA.

If the market becomes more bullish, $0.5946 may provide the next resistance. This level is slightly above the May monthly open, overlaps with multiple old lows and aligns with the 40 EMA.

2. Eos (EOS)

EOS is a platform designed to allow developers to build decentralised apps. The project’s goal is relatively simple: to make it as straightforward as possible for programmers to embrace blockchain technology and ensure the network is easier to use than rivals. As a result, tools and a range of educational resources are provided to support developers who want to build functional apps quickly. EOS also aims to improve the experience for users and businesses. While the project tries to deliver greater security and less friction for consumers, it also vies to unlock flexibility and compliance for enterprises.

EOS Price Analysis

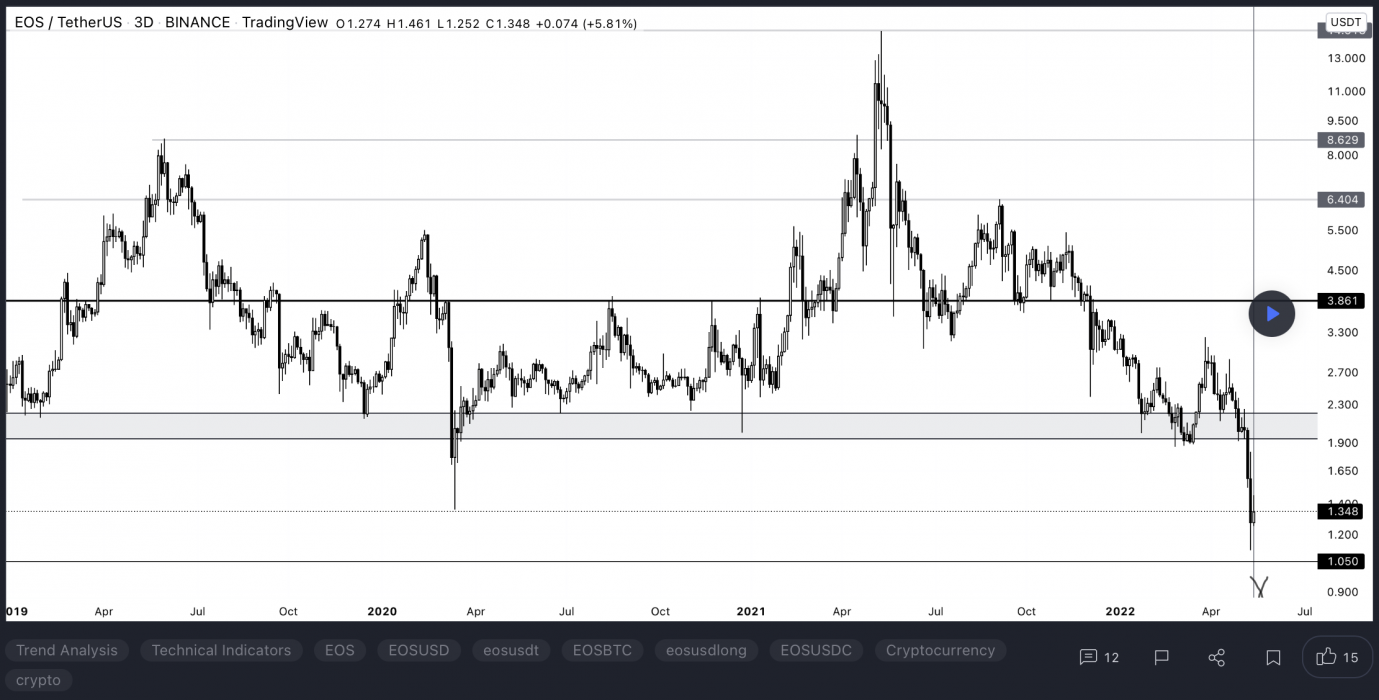
At the time of writing, EOS is ranked the 46th cryptocurrency globally and the current price is US$1.33. Let’s take a look at the chart below for price analysis:

Source: TradingView

EOS has plummeted nearly 66% from its March 2022 high and almost 93% from its May 2021 all-time high.

The closest resistance overlaps with the 8 EMA near $1.4544, where the daily chart shows inefficient trading. This level rejected the price’s first retest on May 13.

Slightly higher, $1.8152 offers the next noteworthy resistance. This area was inefficiently traded and overlaps with the last significant swing low in mid-March.

Last week, the price bounced from support near $1.1856, which could provide support again. This level shows inefficient trading on the monthly chart and is near the midpoint of September 2017’s accumulation.

If this support breaks, bulls could find support near $0.7229. This level is at the bottom of an inefficiently traded area on the monthly and weekly charts. It’s also the high point of October 2017’s accumulation range. However, eager bidders should be cautious as a move this low may be targeting bulls’ stops under the swing low at $0.4760.

3. Unibright (UBT)

Unibright UBT is a member company of SPO Consulting GmbH, which was founded in 1989. The cloud-based integration platform was released in 2011, while the cross-blockchain and cross-system business process integration of Unibright was launched in 2016.

Unibright’s unified framework has the goal of bringing blockchain technology and contracts to mainstream users. Unibright offers enterprise-level blockchain solutions, integration platforms, and an ecosystem centred on tokenised assets. 

UBT Price Analysis

At the time of writing, UBT is ranked the 377th cryptocurrency globally and the current price is US$0.3877. Let’s take a look at the chart below for price analysis:

Source: TradingView

UBT has dropped nearly 89% since its March 2022 high and 95% since its September 2021 high.

The price is currently testing probable resistance near $0.4029, which marks the upper half of last week’s rally before the last run downward and may soon overlap with the 18 EMA.

Just above, $0.4842 may also provide resistance. Sweeping this high would remove bears who trailed their stops too aggressively. It also overlaps with the lower half of early May’s consolidation.

Support may have formed near the recent swing low candle’s high near $0.3592, which should hold during a retest if the price is to rally further. This possible support formed after the price ran bulls’ stops under significant lows near $0.2361. 

Further possible support below this level becomes difficult to determine due to a lack of precise historical price action data. Some charts suggest that an area near $0.18378 could be the next bearish target and possible support. Inefficient trading might have occurred here.

If this level breaks, the stops and inefficiently traded area under the significant swing low around $0.07358 may be the next target for bears and offers potential support for bulls.

Learn How to Trade Live!

Join Dave and The Crypto Den Crew and they’ll show you live on a webinar how to take your crypto trading to the next level.

Where to Buy or Trade Altcoins?

These coins have high liquidity on Binance Exchange, so that could help with trading on AUD/USDT/BTC pairs. And if you’re looking at buying and HODLing cryptos, then Swyftx Exchange is an easy-to-use popular choice in Australia.
Categories
1inch Network ChainLink Crypto News Decentraland Market Analysis Trading

Top 3 Coins to Watch Today: MANA, LINK, 1INCH – May 16 Trading Analysis

Let’s take a closer look at today’s altcoins showing breakout signals. We’ll explain what the coin is, then dive into the trading charts and provide some analysis to help you decide.

1. Decentraland (MANA)

Decentraland MANA defines itself as a virtual reality platform powered by the Ethereum blockchain that allows users to create, experience, and monetise content and applications. In this virtual world, users purchase plots of land that they can later navigate, build on and monetise. Decentraland uses two tokens: MANA and LAND. MANA is an ERC-20 token that must be burned to acquire non-fungible ERC-721 LAND tokens. MANA tokens can also be used to pay for a range of avatars, wearables, names and more on the Decentraland marketplace.

MANA Price Analysis

At the time of writing, MANA is ranked the 33rd cryptocurrency globally and the current price is US$1.23. Let’s take a look at the chart below for price analysis:

Source: TradingView

Like many other altcoins, MANA set a high during Q1 before retracing 65% to the low at $0.7530 last week.

The price broke through resistance near $1.20, which may mark an area of possible support on a retracement. If this support fails, bulls might also step in near $1.13. However, a drop this far increases the chances of a stop run to $1.05 and possibly into support near $0.9425. For now, continuing recovery market conditions could help $1.10 become support.

The swing high around $1.40 gives bulls a reasonable first target, with $1.48 also likely to draw the price upward. Higher-timeframe resistance beginning near $1.60 or $1.65 could cap the move or trigger consolidations. If bullish market conditions continue, bulls might test probable resistance near new monthly highs around $1.74.

The Chainlink Network LINK is driven by a large open-source community of data providers, node operators, smart contract developers, researchers, security auditors and more. The company focuses on ensuring that decentralised participation is guaranteed for all node operators and users looking to contribute to the network. Chainlink allows blockchains to securely interact with external data feeds, events and payment methods, providing the critical off-chain information needed by complex smart contracts to become the dominant form of digital agreement.

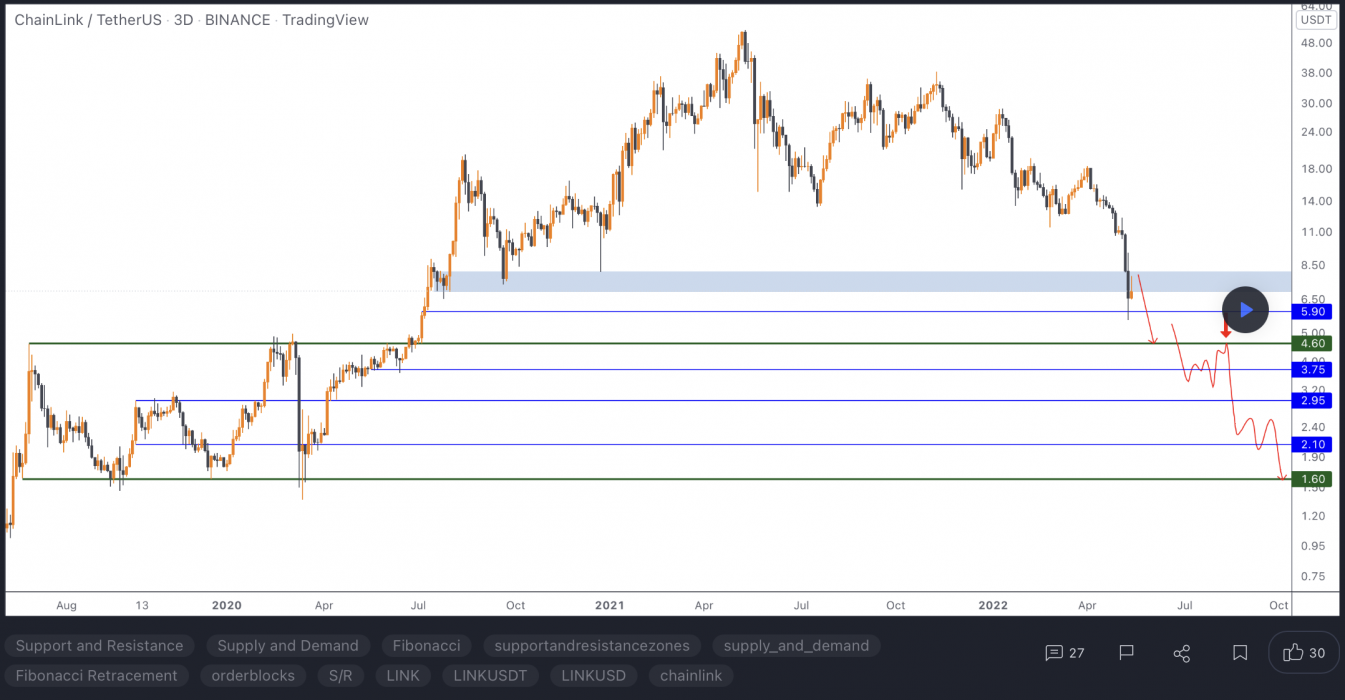
At the time of writing, LINK is ranked the 25th cryptocurrency globally and the current price is US$7.59. Let’s take a look at the chart below for price analysis:

Source: TradingView

LINK‘s early April trend retraced near $7.10 into the consolidation that began the impulse before bouncing to $7.66. 

This consolidation could provide support again, although bears would first have to push the price through possible support near $7.05. The market’s structure may be shifting bearish, with $7.98 likely to provide some resistance if this is the case. A sustained bearish move could reach the swing low near $6.89 before finding support near $6.77.

However, the bullish higher-timeframe trend might prevail, with relatively equal highs near $8.79 potentially giving an attractive target to lure the price over the monthly open. If so, the price could reach for the midpoint of the Q1 wick near $10.58.

3. 1inch (1INCH)

1INCH is a decentralised exchange (DEX) aggregator, connecting several DEXes into one platform to allow users to find the most efficient swapping routes across all platforms. In order for users to find the best price for a swap, they need to look at every exchange – DEX aggregators eliminate the need for manually checking, bringing efficiency to swapping on DEXes. 1inch has launched its 1INCH governance token, and the 1inch Network began to be governed by a decentralised autonomous organisation (DAO).

1INCH Price Analysis

At the time of writing, 1INCH is ranked the 98th cryptocurrency globally and the current price is US$0.9458. Let’s take a look at the chart below for price analysis:

Source: TradingView

After breaking its Q1 highs, 1INCH began a range that has been whiplashing both bulls and bears.

Resistance beginning near $1.45 held the price down for the second half of April, although bulls have shown some strength near the 9 and 18 EMAs. 

A quick push to $1.13, or into the zone beginning near $1.26, could give bulls the fuel to push through the nearby resistance. If this resistance breaks, the high near $1.34 provides a reasonable target. 

A break of this level could move further into uncharted territory with the nearest probable resistances projected around $1.40 and $1.45.

More patient bulls might be waiting far below the 40 EMA with bids near the higher-timeframe range’s 45% retracement, near $0.8540.

Learn How to Trade Live!

Join Dave and The Crypto Den Crew and they’ll show you live on a webinar how to take your crypto trading to the next level.

Where to Buy or Trade Altcoins?

These coins have high liquidity on Binance Exchange, so that could help with trading on AUD/USDT/BTC pairs. And if you’re looking at buying and HODLing cryptos, then Swyftx Exchange is an easy-to-use popular choice in Australia.
Categories
Banking Bitcoin Crypto News Ethereum Trading

Brazil’s Largest Digital Bank Nubank Launches BTC and ETH Trading

Nubank, Brazil’s biggest digital bank by market volume, now allows customers to buy and sell bitcoin and ethereum on its Paxos-supported trading platform, as per a May 11 announcement.

The fintech will allocate one percent of its equity to bitcoin through its parent company, Nu Holdings Inc, which is listed on the New York Stock Exchange. Nubank said the move seeks to “strengthen the company’s conviction in the current and future potential of bitcoin in disrupting financial services”.

Deal Gives BTC Exposure to Warren Buffett

Nubank’s treasury allocation to bitcoin gives indirect BTC exposure to old-school investor and Bitcoin critic Warren Buffett, chairman and CEO of Berkshire Hathaway. The US holding company reportedly invested US$500 million in Nubank in June 2021, acquired 30 million shares for another $250 million as it went public in December, and recently doubled-down with a $1 billion investment in Brazilian fintech.

According to Paxos, users will be able to buy and sell crypto with Brazilian reals, but initially won’t be able to withdraw or deposit crypto. Until now, Nubank allowed users to invest in crypto only through exchange-traded funds available through its investment unit, NuInvest.

Brazil Experiencing Major Crypto Adoption Growth

Last month, Brazil edged closer to a regulatory framework for cryptocurrencies and along with neighbouring South American country Peru is looking to introduce a CBDC this year. And in March, Coinbase was reportedly on the verge of closing a deal to acquire 2TM, owner of Mercado Bitcoin, Brazil’s largest cryptocurrency exchange.

There is no doubt that crypto is a growing trend in Latin America, one that we have been following closely and believe will have a transformational impact on the region. Yet the trading experience is still very niche as customers either lack information to feel confident to enter this new market or just get frustrated by complex experiences.

David Vélez, CEO and co-founder, Nubank

In general, Brazil is experiencing major crypto adoption growth. Between January and November of 2021, locals reportedly traded US$11.4 billion in stablecoins, almost triple the amount traded the previous year.

In his capacity as Nubank boss, Vélez is clearly intent on demystifying crypto trading for the average Brazilian bank customer.

Categories
Avalanche Crypto News Market Analysis THORChain Trading Zilliqa

Top 3 Coins to Watch Today: AVAX, ZIL, RUNE – May 13 Trading Analysis

Let’s take a closer look at today’s altcoins showing breakout signals. We’ll explain what the coin is, then dive into the trading charts and provide some analysis to help you decide.

1. Avalanche (AVAX)

Avalanche AVAX is the fastest smart contracts platform in the blockchain industry, as measured by time-to-finality, and has the most validators securing its activity of any proof-of-stake protocol. Avalanche is blazingly fast, low-cost, and green. Any smart contract-enabled application can outperform its competition on Avalanche.

AVAX is the native token of Avalanche. It is a hard-capped, scarce asset that is used to pay for fees, secure the platform through staking, and provide a basic unit of account between the multiple subnets created on Avalanche.

AVAX Price Analysis

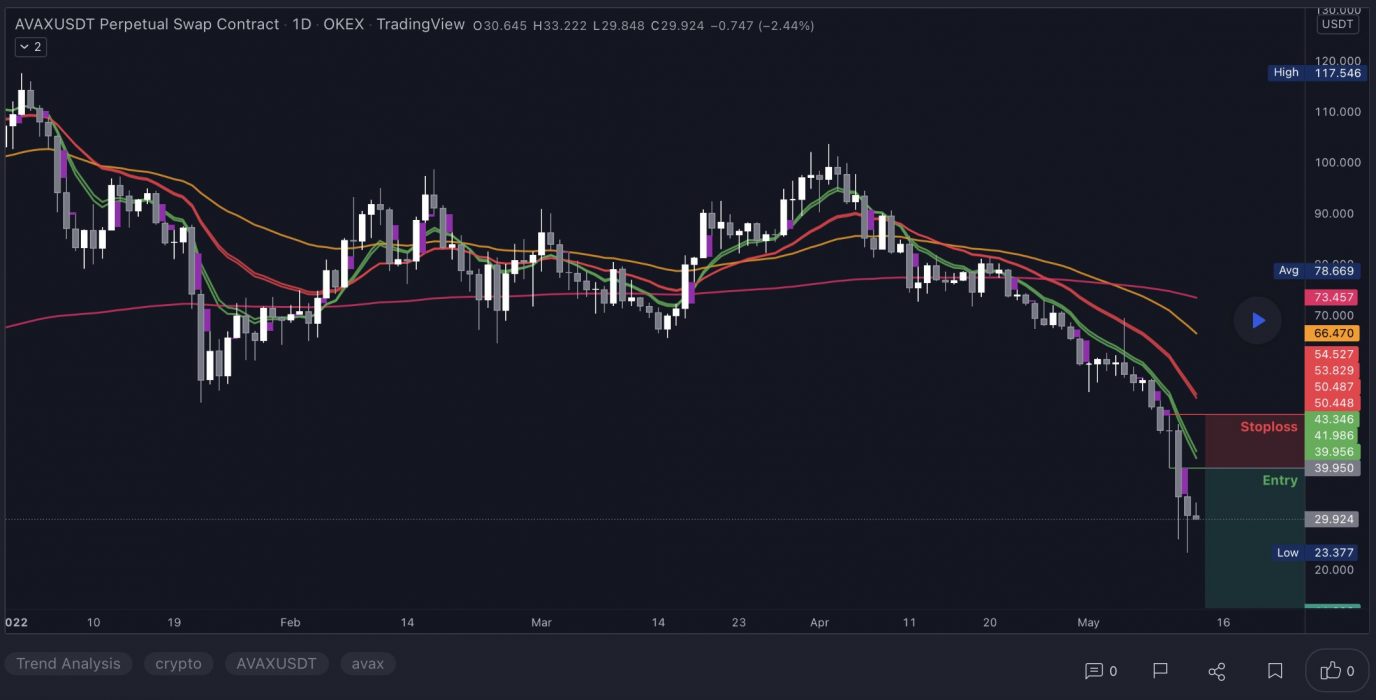
At the time of writing, AVAX is ranked the 13th cryptocurrency globally and the current price is US$29.82. Let’s take a look at the chart below for price analysis:

Source: TradingView

AVAX‘s 70% gains during Q1 ended with an almost 49% retracement as the rest of the altcoin market dropped from last week. Bulls stepped in near the 52.8% retracement of Q2’s move, creating a consolidation that ended with the bullish impulse to resistance near $44.35.

With the 9, 18 and 40 EMAs stacked bullish and a bullish higher-timeframe trend, it’s reasonable to anticipate retracement to possible support before further bullish expansion. 

Near the 40 EMA, a broad zone from $38.15 to $30.45 could see interest from bulls before further expansion. If this level fails, bears might capitalise on any sharp moves down in Bitcoin, aiming for possible support near the 70% retracement, at $27.70, and potentially lower to a higher-timeframe support zone between $25.42 and $23.80.

If the higher-timeframe recovery trend resumes and the current resistance near $44.35 breaks, the wicks near $48.84 and the new monthly highs may see profit-taking.

2. Zilliqa (ZIL)

Zilliqa ZIL is a public, permissionless blockchain designed to offer high throughput with the ability to complete thousands of transactions per second. It seeks to solve the issue of blockchain scalability and speed by employing sharding as a second-layer scaling solution. The platform is home to many decentralised applications, and it also allows for staking and yield farming. The native utility token of Zilliqa, ZIL, is used to process transactions on the network and execute smart contracts.

ZIL Price Analysis

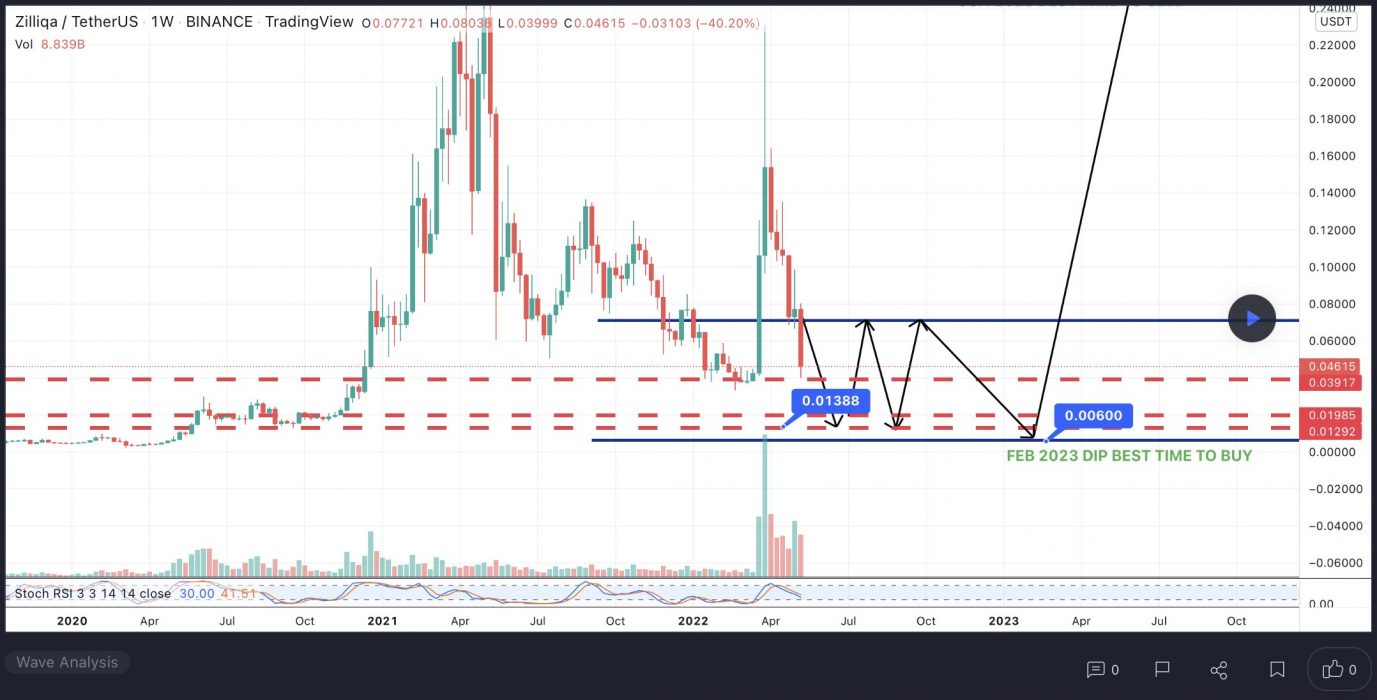
At the time of writing, ZIL is ranked the 77th cryptocurrency globally and the current price is US$0.04601. Let’s take a look at the chart below for price analysis:

Source: TradingView

ZIL‘s 80% drop found a low near $0.04238 before closing over a weekly high around $0.05082. This daily close over the high could signal a shift in market structure that might reach probable resistance near $0.05732.

A sustained bullish move may target the swing high at $0.05960. If this stop run occurs, a run beyond the high into probable resistance near $0.06288 and $0.06445 is possible.

Bulls could buy a retracement to possible support near $0.04018, just above the weekly open. A bearish turn in the marketplace may propel the price toward possible support near $0.03876. 

However, relatively equal lows near $0.03734 and $0.03624 provide an attractive target for bears if the market resumes its bearish trend. A run on these lows might find support between $0.03415 and $0.03266.

3. THORChain (RUNE)

ThorChain RUNE is a decentralised liquidity protocol that allows users to easily exchange cryptocurrency assets across a range of networks without losing full custody of their assets in the process. The native utility token of the THORChain platform is RUNE. This is used as the base currency in the THORChain ecosystem and is also used for platform governance and security as part of THORChain’s Sybil resistance mechanisms – since THORChain nodes must commit a minimum of 1 million RUNE to participate in its rotating consensus process.

RUNE Price Analysis

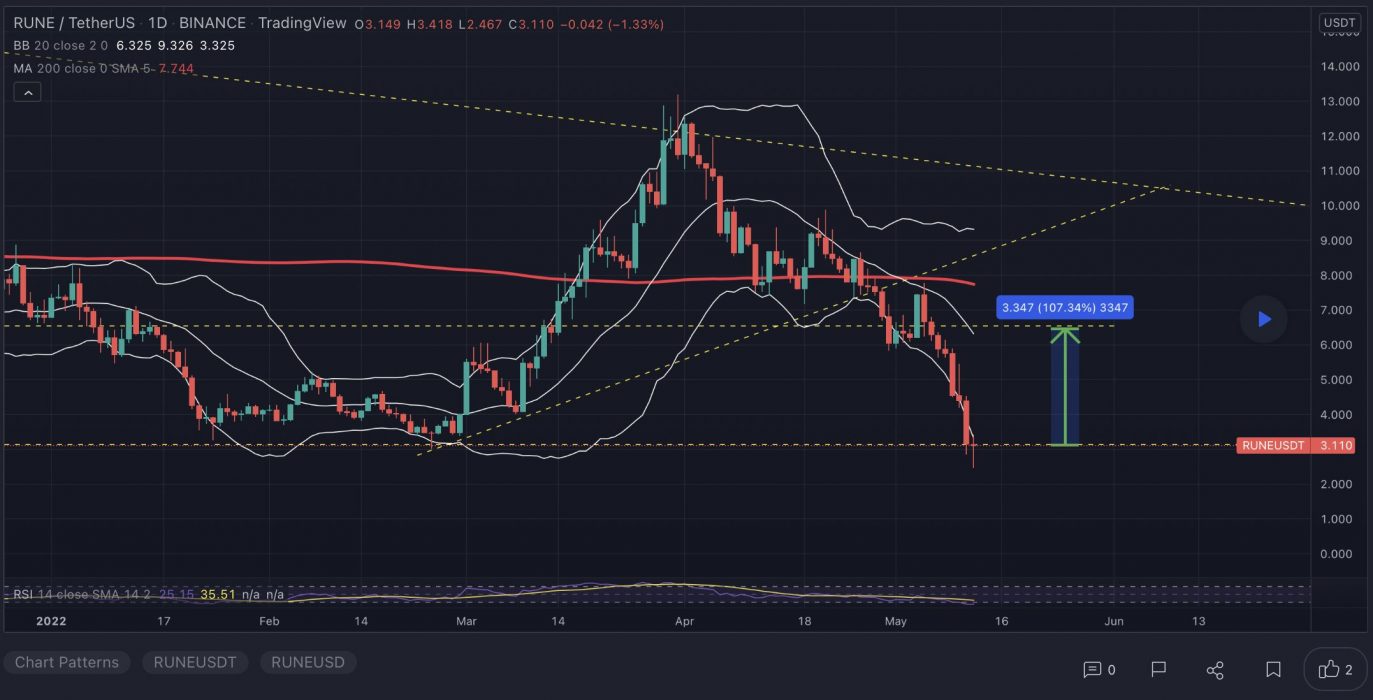
At the time of writing, RUNE is ranked the 55th cryptocurrency globally and the current price is US$2.90. Let’s take a look at the chart below for price analysis:

Source: TradingView

RUNE abruptly rallied after retracing nearly 60% from its November highs, climbing 90% during early March.

Bears are currently taking shorts in a contested area between $2.70 and $3.23. This area saw inefficient trading on higher timeframes. It could serve as support if the price trades through its high end and retests it – or as resistance if the price breaks back below.

The closest support rests just below, near $2.63. The old high at this level could support a rally into resistance near $2.95.

A move through the closest resistance might target the consolidation midpoint near $3.25, near the 29% extension of the current rally. If this level breaks, bulls might target an inefficient area near $3.45 and beyond.

Learn How to Trade Live!

Join Dave and The Crypto Den Crew and they’ll show you live on a webinar how to take your crypto trading to the next level.

Where to Buy or Trade Altcoins?

These coins have high liquidity on Binance Exchange, so that could help with trading on AUD/USDT/BTC pairs. And if you’re looking at buying and HODLing cryptos, then Swyftx Exchange is an easy-to-use popular choice in Australia.

Categories
Crypto Exchange Crypto Wallets Kraken Trading

‘Super Wallet’ is Coming as Crypto Exchanges Will Soon Enable Trading of Stocks

Kraken CEO Jesse Powell featured on Decrypt’s GM podcast last week, in which he stated that the US exchange is currently exploring broadening its offerings to include stocks. Powell also noted that the so-called ‘super wallet’ appears to be a common goal among many exchanges:

One Wallet, Multiple Assets

During the Decrypt podcast, Powell discussed the future of crypto wallets and the exchanges they belong to. He said that ‘super wallets’ – wallets that allow users to buy and trade varying assets, from crypto and NFTs to stocks – were in the sights of many crypto exchanges right now, with Kraken itself exploring the potential of catering to stocks:

I think we’ve said before that [stocks] are something that we’re exploring, and I think [it] makes sense to do [so].

Jesse Powell, Kraken CEO

With crypto already being offered alongside other assets by companies such as Robinhood and eToro, crypto brokerages won’t be far behind. Kraken users are already speculating on how this potential addition could unfold:

https://www.reddit.com/r/CryptoCurrency/comments/umjq92/bitcoin_exchange_kraken_exploring_stocks_as_part/
Reddit thread on Jesse Powell’s podcast appearance

Kraken Comes to the Aid of Ukraine

Kraken has been making itself visible over the past two years via multiple company moves. The most notable of these has been its dedication to aiding fundraising for Ukraine. In March, the company announced it would be distributing over US$10 million to relief efforts in the wartorn country, along with the waiving of exchange fees for Ukrainian addresses.  

In June 2021, the company decided to re-evaluate its launch plans following the poor performance of Coinbase’s IPO, stating that a direct listing might have a long-run “dampening effect” if Kraken continued with its plans to go public.

Categories
Crypto News Market Analysis Polygon Solana Stellar Trading

Top 3 Coins to Watch Today: SOL, MATIC, XLM – May 12 Trading Analysis

Let’s take a closer look at today’s altcoins showing breakout signals. We’ll explain what the coin is, then dive into the trading charts and provide some analysis to help you decide.

1. Solana (SOL)

Solana SOL is a highly functional open-source project that banks on blockchain technology’s permissionless nature to provide decentralised finance (DeFi) solutions. The Solana protocol is designed to facilitate decentralised app (DApp) creation. It aims to improve scalability by introducing a proof-of-history (PoH) consensus combined with the underlying proof-of-stake (PoS) consensus of the blockchain.

SOL Price Analysis

At the time of writing, SOL is ranked the 8th cryptocurrency globally and the current price is US$53.37. Let’s take a look at the chart below for price analysis:

Source: TradingView

SOL has retraced 80% from its Q1 highs and reached possible support last week near $50.34. Resistance might begin near $80.34, which has confluence with the 9 and 18 EMAs.

A more substantial rally might reach near the swing high at $87.23 and the 40 EMA. This high is less likely to break if bears plan to continue the downtrend without a lengthier consolidation.

While not highly probable in the current market conditions, a more animated move upward could reach a wide resistance area between $94.42 and $98.94. This zone is where the last movement down accumulated positions before breaking down. 

Possible support rests near $50.34, which showed sensitivity on the last test. While it could provide support again, the higher-timeframe bearish trend is more likely to propel the price into an inefficient area between $47.10 and $44.54. If the price reaches this zone, the Q1 2021 swing high near $40.13 might mark a more sensitive level.

2. Polygon (MATIC)

Polygon MATIC is the first well-structured, easy-to-use platform for Ethereum scaling and infrastructure development. Its core component is Polygon SDK, a modular, flexible framework that supports building multiple types of applications. The MATIC token will continue to exist and will play an increasingly important role in securing the system and enabling governance.

MATIC Price Analysis

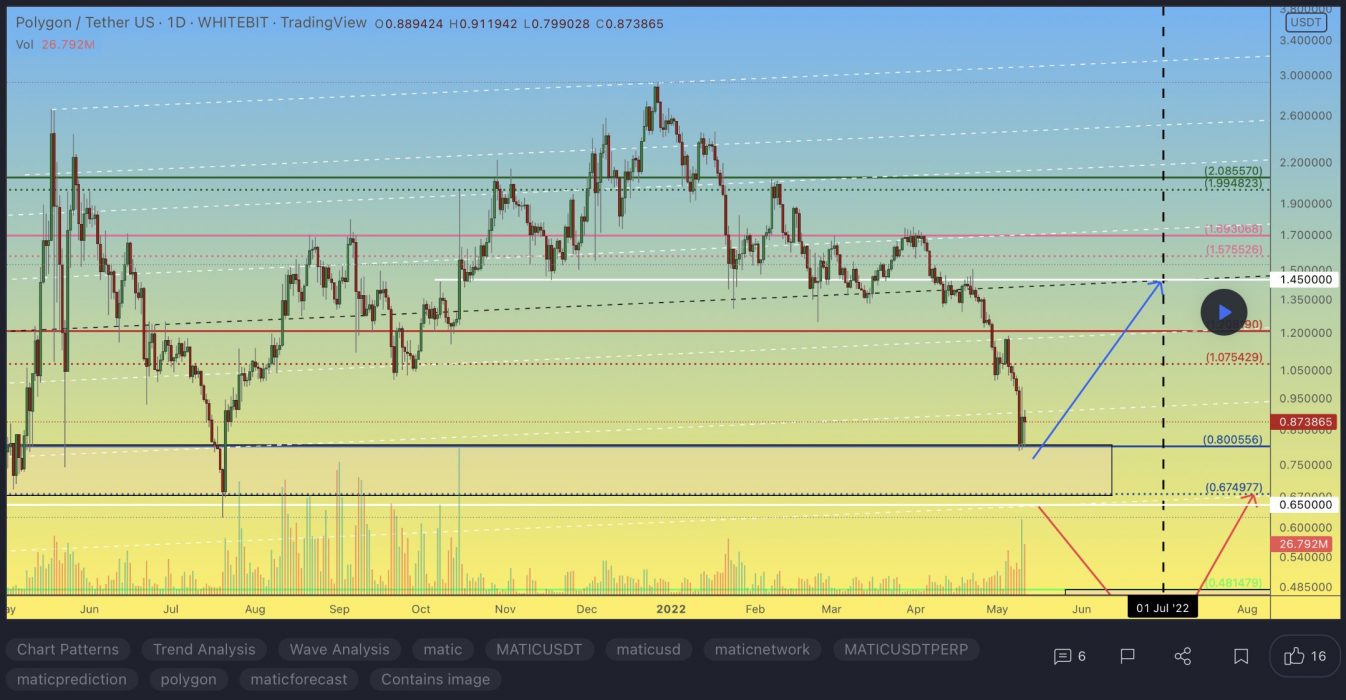
At the time of writing, MATIC is ranked the 18th cryptocurrency globally and the current price is US$0.7203. Let’s take a look at the chart below for price analysis:

Source: TradingView

Since its Q1 highs, MATIC has been in a steady bearish trend, retracing nearly 55%. The price found support near $0.7020, at the 60.8% retracement level.

Last week’s sharp impulse up might have marked the start of a new trend. If so, higher timeframes suggest that $0.6839 near the 65.8% retracement and the 9, 18 and 40 EMAs may see interest from bulls. The price could reach lower, near $0.6520, and still find support.

Currently, the price is contesting a region between $0.7139 and $0.7835. Closes over this level could confirm it as new support, leading to a move higher.

However, bulls are contending with probable resistance near $0.8344, while $0.9053 is also likely to be sensitive with the nearest support and resistance this close together.

3. Stellar (XLM)

Stellar XLM is an open network that allows money to be moved and stored. When it was released, the goal was boosting financial inclusion by reaching the world’s unbanked – but soon after, its priorities shifted to helping financial firms connect with one another through blockchain technology. The network’s native token, lumens, serves as a bridge that makes it less expensive to trade assets across borders. All of this aims to challenge existing payment providers who often charge high fees for a similar service.

XLM Price Analysis

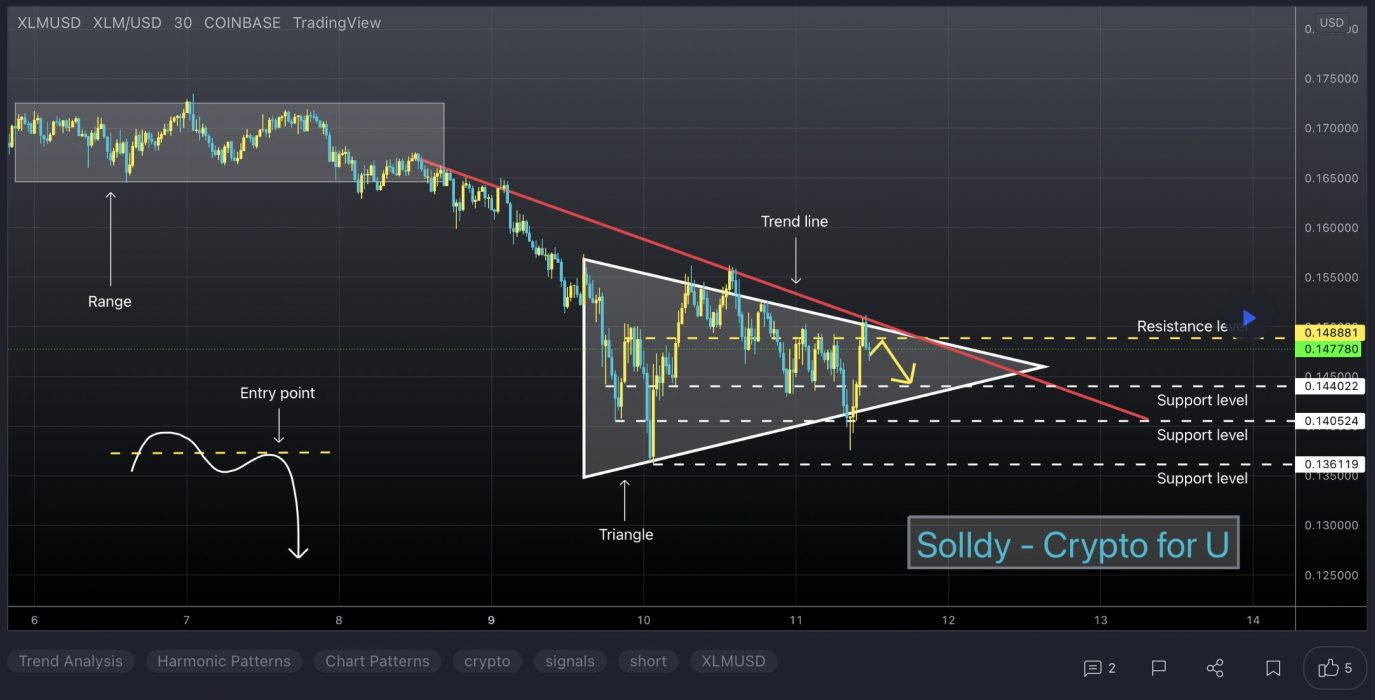
At the time of writing, XLM is ranked the 27th cryptocurrency globally and the current price is US$0.1303. Let’s take a look at the chart below for price analysis:

Source: TradingView

XLM set a high near $0.2457 in early April before retracing nearly 45% to find a low near $0.1260. The price consolidated around this level before the strong bullish impulse over the past several days.

Probable resistance near $0.1578 is slowing the bullish advance down. However, another leg might target the last swing high at $0.1722 and relatively equal highs at $0.1936. Resistance near $0.2059 could cap the move before the second swing high. Beyond these levels, little stands in the bulls’ way before reaching the swing high near $0.2356.

A retracement before a move higher might find support in the daily gap near $0.1243, just above the weekly open. Relatively equal lows near $0.1175 could also provide support. Run-on stops at $0.1105 and $0.1083 might find support in the gap beginning near $0.1020.

Learn How to Trade Live!

Join Dave and The Crypto Den Crew and they’ll show you live on a webinar how to take your crypto trading to the next level.

Where to Buy or Trade Altcoins?

These coins have high liquidity on Binance Exchange, so that could help with trading on AUD/USDT/BTC pairs. And if you’re looking at buying and HODLing cryptos, then Swyftx Exchange is an easy-to-use popular choice in Australia.
Categories
Binance Coin Crypto News Market Analysis The Sandbox Trading Waves

Top 3 Coins to Watch Today: BNB, WAVES, SAND – May 11 Trading Analysis

Let’s take a closer look at today’s altcoins showing breakout signals. We’ll explain what the coin is, then dive into the trading charts and provide some analysis to help you decide.

1. Binance Coin (BNB)

Binance BNB is the biggest cryptocurrency exchange globally, based on daily trading volume. Binance aims to bring cryptocurrency exchanges to the forefront of world financial activity. Aside from being the largest cryptocurrency exchange, Binance has launched a whole ecosystem of functionalities for its users. The Binance network includes the Binance Chain, Binance Smart Chain, Binance Academy, Trust Wallet, and Research projects, which all employ the powers of blockchain technology to bring new-age finance to the world. Binance Coin is an integral part of the successful functioning of many of the Binance sub-projects.

BNB Price Analysis

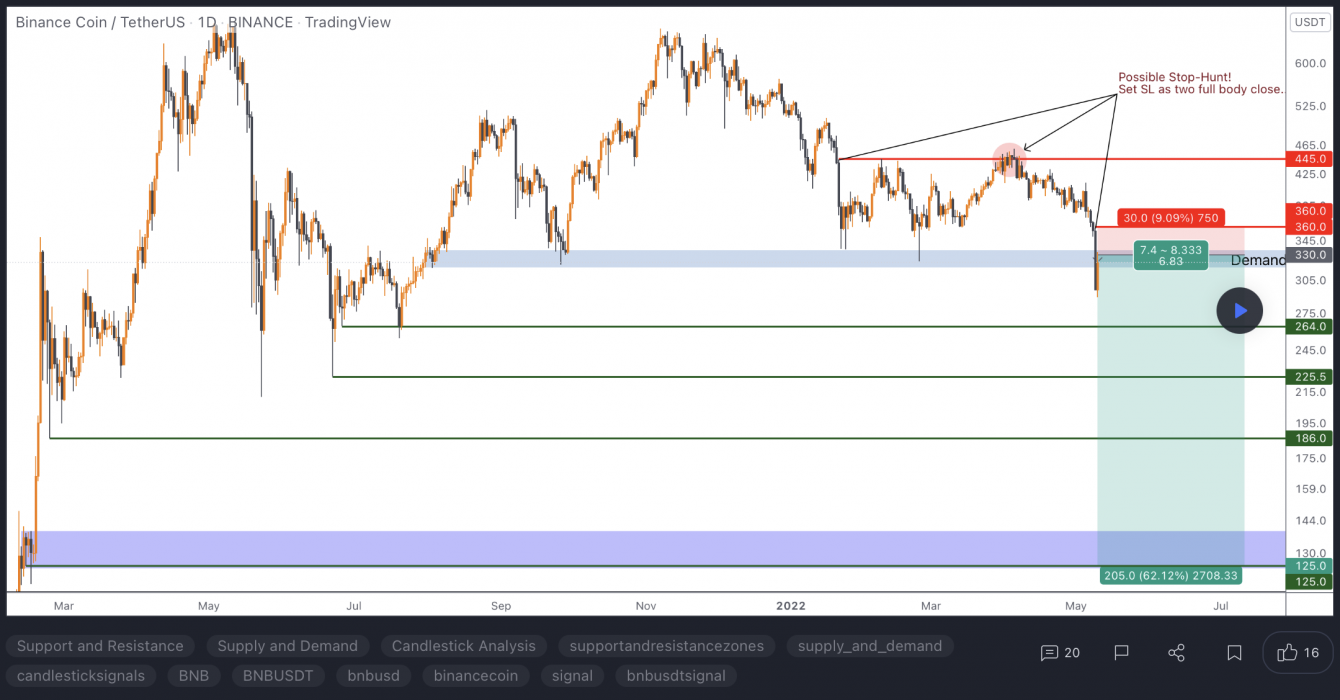
At the time of writing, BNB is ranked the 4th cryptocurrency globally and the current price is US$323.70. Let’s take a look at the chart below for price analysis:

Source: TradingView

After a 30% decline from last week, BNB has ranged between $310 and $358. The recent price recovery was approaching probable resistance near $375 but could be aiming for stops above the relatively equal highs near $380. Continuation of the trend could target the daily gap near $394.

Aggressive bulls might add to positions near $320 and $316. Price action near $310 may be more likely to provide support – if it gets there – during any retracements.

Relatively equal lows clustered around $300 seem likely to be swept if the bearish trend resumes. If this move occurs, the price might find support at the significant higher-timeframe level near $290.

2. Waves (WAVES)

WAVES is a multi-purpose blockchain platform that supports various use cases, including decentralised applications (DApps) and smart contracts. The platform has undergone various changes and added new spin-off features to build on its original design. Waves’ native token is WAVES, an uncapped supply token used for standard payments such as block rewards. Waves initially set out to improve on the first blockchain platforms by increasing speed, utility, and user-friendliness.

WAVES Price Analysis

At the time of writing, WAVES is ranked the 55th cryptocurrency globally and the current price is US$12.14. Let’s take a look at the chart below for price analysis:

Source: TradingView

During Q1 high, WAVES‘ slight drop marks the current range as a reasonable area to expect accumulation.

The recent bearish flip of the 9, 18 and 40 EMAs might cause bulls to be less aggressive in bidding. However, possible support near $14.12 and $12.10 – between the 41.8% and 46.6% retracements – could see at least a short-term bounce. 

Long-term consolidation suggests that the areas near $25.45 and $30.61 may be more likely to cause a longer-term trend reversal.

Bears are likely to add to their shorts at probable resistance beginning near $20.77, which has confluence with the 18 EMA. A fast break of this resistance could trigger more selling near $23.42, the start of the bearish move.

3. The Sandbox (SAND)

The Sandbox SAND is a blockchain-based virtual world allowing users to create, build, buy and sell digital assets in the form of a game. By combining the powers of decentralised autonomous organisations (DAOs) and non-fungible tokens (NFTs), the Sandbox creates a decentralised platform for a thriving gaming community. The Sandbox employs the powers of blockchain technology by introducing the SAND utility token, which facilitates transactions on the platform.

SAND Price Analysis

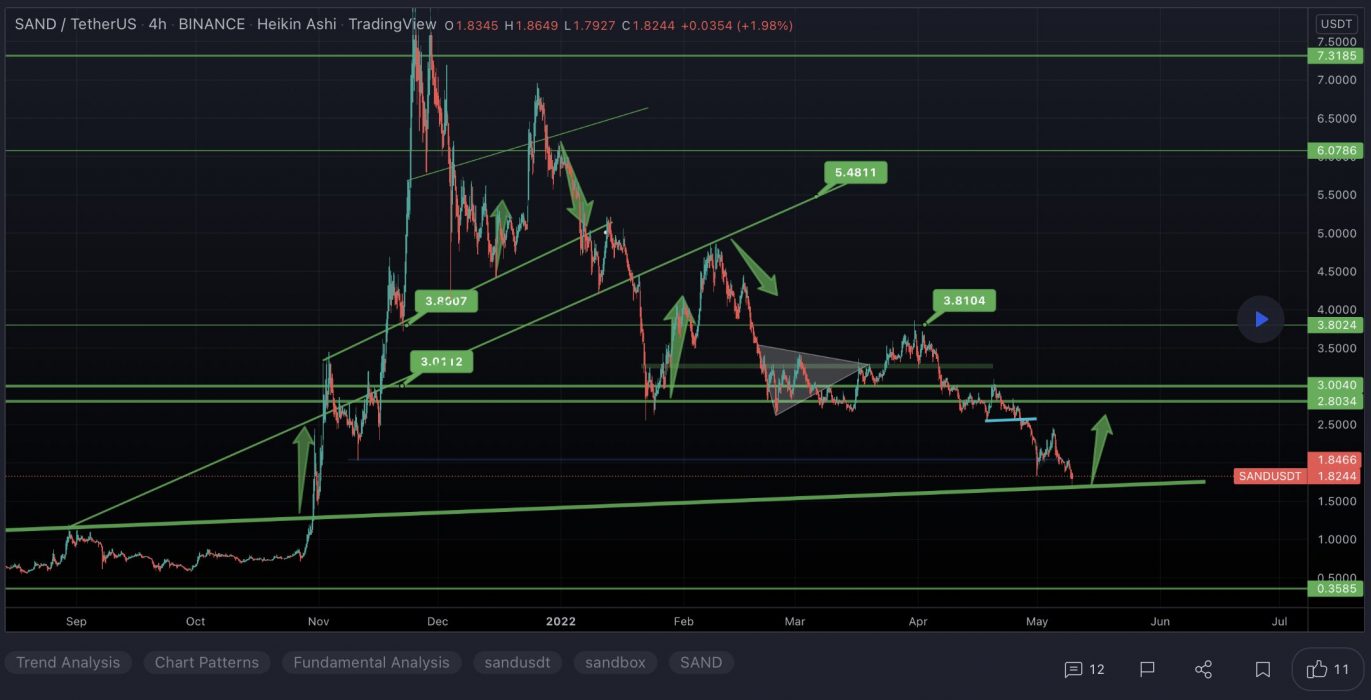
At the time of writing, SAND is ranked the 39th cryptocurrency globally and the current price is US$1.76. Let’s take a look at the chart below for price analysis:

Source: TradingView

SAND‘s impressive gains during Q1 halted at $4.95 before retracing 70% of the move. This price action created several areas of possible higher-timeframe resistance in the process.

The price found resistance on its last swing upward near $2.43 – an area that could provide resistance again. If this swing high breaks, the price might find resistance near $2.85. If this area does provide resistance, it would suggest the formation of a higher-timeframe consolidation.

The fast move up left little higher-timeframe support. However, a vast zone between $1.90 and $1.72 has provided support before and could give support again on a retest. This zone is between the 61.8%-to-78.6% retracement levels of 2021 Q4’s parabolic move.

Continuation downward through this level, especially if the overall market remains bearish, could retrace most of Q4’s move to the next higher-timeframe support near $1.55.

Learn How to Trade Live!

Join Dave and The Crypto Den Crew and they’ll show you live on a webinar how to take your crypto trading to the next level.

Where to Buy or Trade Altcoins?

These coins have high liquidity on Binance Exchange, so that could help with trading on AUD/USDT/BTC pairs. And if you’re looking at buying and HODLing cryptos, then Swyftx Exchange is an easy-to-use popular choice in Australia.